
Market Overview
| Study Period | 2020 - 2031 |
|---|---|
| Forecast Data Period | 2026 - 2031 |
| Base Year Market Size (2025) | USD 15.15 Billion |
| Market Size (2026) | USD 16.02 Billion |
| Market Size (2031) | USD 21.15 Billion |
| Growth Rate (2026 - 2031) | 5.72 % |
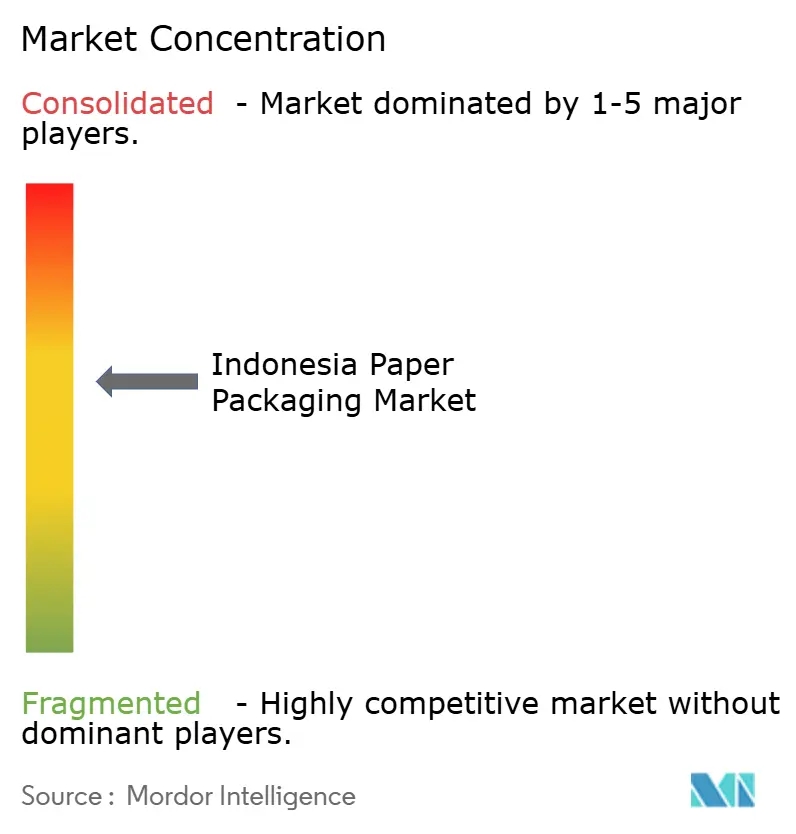
| Market Concentration | Medium |
Major Players *Disclaimer: Major Players sorted in no particular order Image © Mordor Intelligence. Reuse requires attribution under CC BY 4.0. | |
Indonesia Paper Packaging Market Analysis by Mordor Intelligence
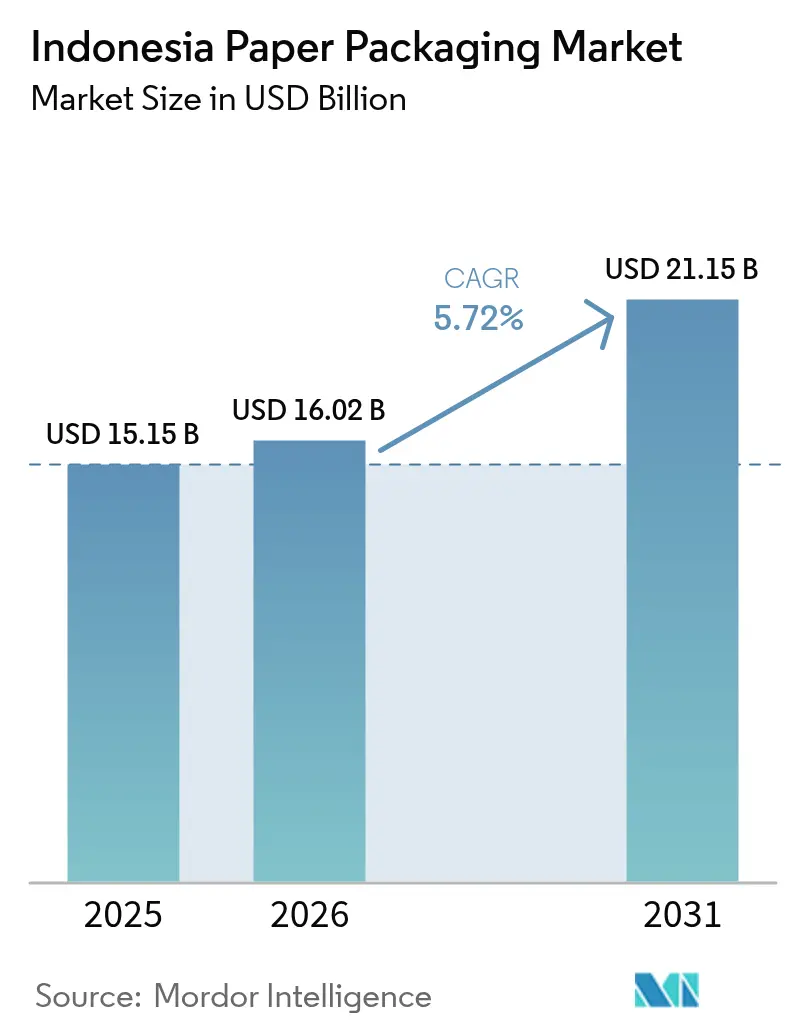
The Indonesia paper packaging market size in 2026 is estimated at USD 16.02 billion, growing from 2025 value of USD 15.15 billion with 2031 projections showing USD 21.15 billion, growing at 5.72% CAGR over 2026-2031. Strong consumer demand from a population of 275 million, rapid e-commerce expansion outside Java, and sustainability mandates from brand owners are the primary growth engines. Corrugated board retains its leadership position because it protects goods moving across 17,000 humid islands, while paperboard’s faster growth signals a shift towards premiumization in food, beauty, and personal-care categories. Investment in automated corrugators and water-based inks is modernizing production, while Indonesia’s national circular economy roadmap encourages supply chain players to adopt FSC-certified fiber and recyclable coatings. Headwinds stem from volatile recovered-paper rules, fragmented logistics, and electricity tariff hikes; however, government infrastructure spending and supplier diversification are gradually mitigating these risks.
Key Report Takeaways
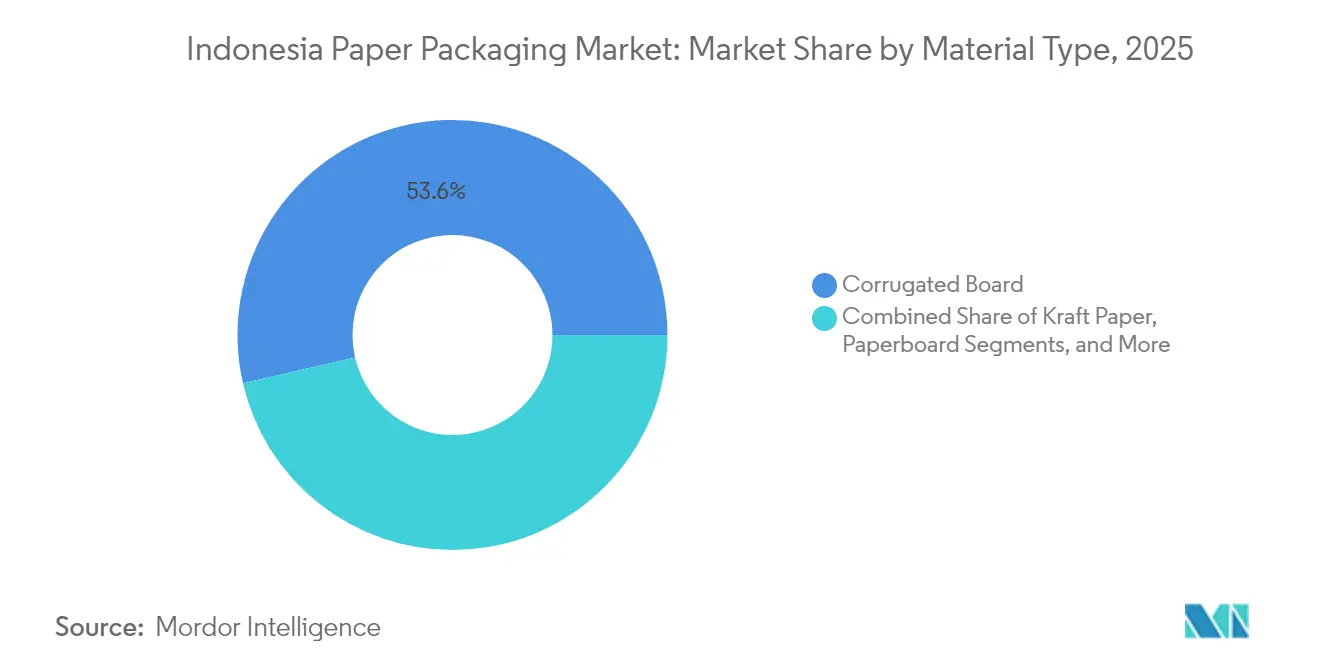
- By material type, corrugated board held 53.61% of Indonesia paper packaging market share in 2025, while paperboard is forecast to expand at a 7.04% CAGR to 2031.
- By product type, corrugated boxes captured 41.78% of the Indonesia paper packaging market size in 2025; folding cartons are advancing at an 7.76% CAGR through 2031.
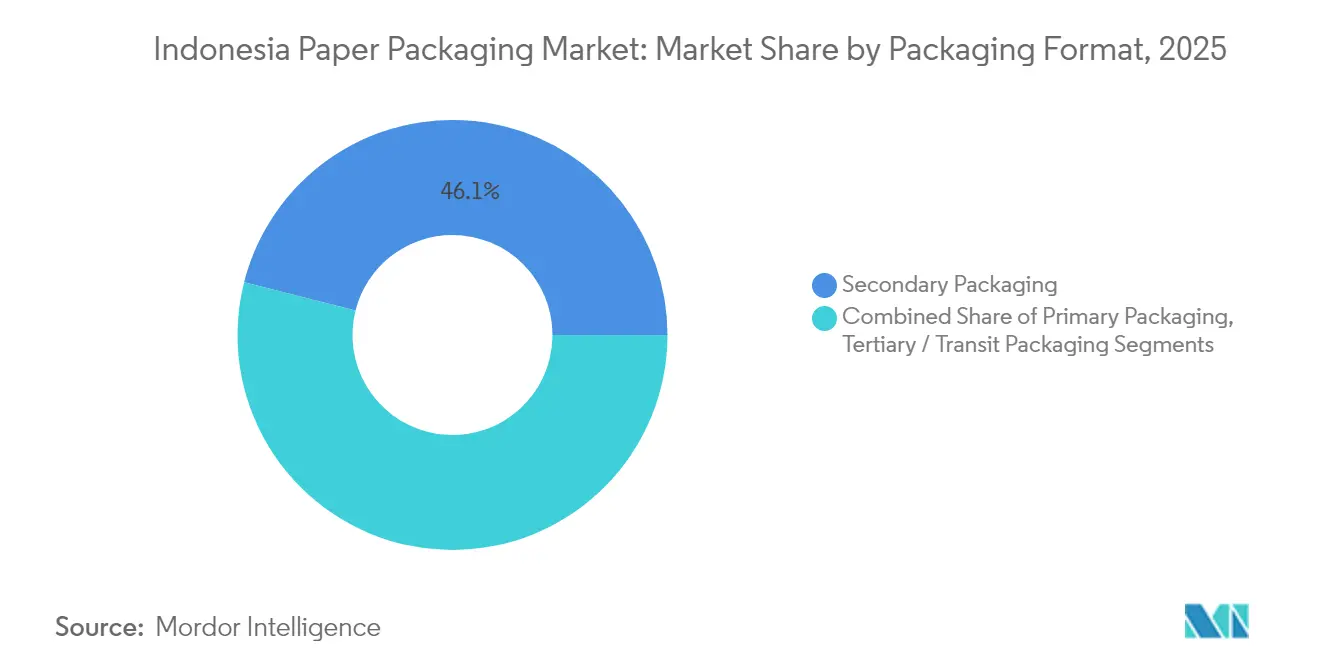
- By packaging format, secondary packaging accounted for 46.05% of Indonesia paper packaging market share in 2025 and is growing at a 6.74% CAGR to 2031.
- By end-use industry, food led with 31.85% revenue share in 2025, whereas personal care and cosmetics posted the highest projected CAGR at 7.53% to 2031.
- SCG Packaging, through its 99.72% stake in PT Fajar Surya Wisesa, controlled the largest single-company share of the Indonesia paper packaging market size in 2024.
Note: Market size and forecast figures in this report are generated using Mordor Intelligence’s proprietary estimation framework, updated with the latest available data and insights as of 2026.
Indonesia Paper Packaging Market Trends and Insights
Drivers Impact Analysis*
| Driver | (~) % Impact on CAGR Forecast | Geographic Relevance | Impact Timeline |
|---|---|---|---|
| Sustainability mandates from FMCG brand-owners | +1.2% | Java and Sumatra manufacturing hubs | Medium term (2-4 years) |
| E-commerce growth in tier-two and tier-three cities | +0.9% | Nationwide, early gains in Medan, Makassar, Palembang | Short term (≤ 2 years) |
| Rising domestic demand for ready-to-eat meals | +0.7% | Urban centers nationwide | Medium term (2-4 years) |
| Investment inflows into automated corrugators | +0.5% | Java industrial corridor, expanding to Sumatra | Long term (≥ 4 years) |
| Rapid adoption of water-based inks | +0.3% | National, led by Jakarta and Surabaya | Short term (≤ 2 years) |
| Source: Mordor Intelligence | |||
Sustainability mandates from multinational FMCG brand-owners
Multinationals require FSC-certified fiber and recyclable barriers, pushing local converters to upgrade materials and secure chain-of-custody credentials. A 2024 survey found 77% of Indonesian food-and-beverage firms willing to absorb higher costs for greener packaging, while 42% of consumers would pay a premium. [1]Digination Editorial Team, “Riset Tetra Pak: Perusahaan Makanan dan Minuman Berkomitmen Meminimalkan Penggunaan Plastik,” digination.idAsia Pulp and Paper’s zero-deforestation milestone across 2.6 million ha of plantation forest signals upstream compliance. Government green-procurement thresholds of IDR 200 million are amplifying demand for low-impact packaging solutions. Investments in water-based inks and halal-certified, bio-based coatings help Indonesian converters win regional export contracts in Southeast Asia and the Middle East.
E-commerce growth in tier-two and tier-three Indonesian cities
Package volumes in Medan, Makassar, and Palembang rose 35% annually, prompting demand for lightweight corrugated boxes optimized for last-mile delivery. Regional manufacturers such as PT Surabaya Mekabox have added digital-print lines for variable data, reducing lead times and supporting personalized branding. New corrugator installations in Sumatra and Kalimantan diversify supply away from Java, lowering freight costs and improving box integrity during multi-modal transit.
Rising domestic demand for ready-to-eat meals
Ready-to-eat consumption is climbing 15% annually in metropolitan areas, spurring grease-resistant and microwave-safe papers. Paperocks Indonesia is supplying hygienic meal-tray packaging for nutrition programs.[2]Paperocks Indonesia, “Inovasi Kemasan Makanan Aman dan Higienis untuk Mendukung Program Makan Bergizi,” paperocks.co.id Revised BPOM migration standards ensure material safety for oily and spicy foods, encouraging converters to adopt specialty barrier coatings. Folding-carton producers gain from portion-control designs that fit Indonesia’s diverse cuisine and limited cold-chain infrastructure.
Investment inflows into automated corrugators
PT Indah Kiat Pulp and Paper’s USD 2.82 billion Karawang expansion will add 3.9 million t of annual board capacity by 2026.[3]Investor Desk, “Grup Sinar Mas Indah Kiat Teken AJB, Punya Proyek Raksasa Puluhan Triliun,” investor.id Chinese suppliers dominate with integrated forming-printing systems that cut energy per unit by 15% and boost throughput 25%. Mid-sized converters such as Teguh Group are adopting modular lines to serve shorter runs for e-commerce brands. Automated quality control improves consistency, satisfying multinational buyers’ stringent standards.
Restraints Impact Analysis*
| Restraint | (~) % Impact on CAGR Forecast | Geographic Relevance | Impact Timeline |
|---|---|---|---|
| Volatile recovered-paper import regulations | -0.8% | National, acute for Java-based mills | Short term (≤ 2 years) |
| Fragmented logistics across the archipelago | -0.6% | National, most severe in eastern Indonesia | Long term (≥ 4 years) |
| Electricity tariff hikes for energy-intensive mills | -0.4% | Industrial zones nationwide | Medium term (2-4 years) |
| Shortage of skilled packaging engineers | -0.3% | Sumatra and Kalimantan | Long term (≥ 4 years) |
| Source: Mordor Intelligence | |||
Volatile recovered-paper import regulations
Frequent shifts in contamination limits and licensing add 15-20% to raw-material costs each quarter. Mills reliant on recycled fiber face shipment delays from stricter pre-shipment inspections. Integrated producers such as PT Toba Pulp Lestari benefit by supplying virgin alternatives. Manufacturers hedge risk by expanding domestic collection networks, yet outer-island infrastructure limits capture rates.
Fragmented logistics across the archipelago
Logistics costs absorb 23.5% of GDP, with port congestion and multi-modal transfers inflating packaging prices for distant markets. Secondary packaging must be over-engineered to survive humid, long-haul routes, increasing material usage. Government sea-toll subsidies and digital freight platforms are improving visibility, but service gaps persist in eastern islands, slowing penetration of aseptic cartons and pharmaceutical packs.
*Our forecasts treat driver/restraint impacts as directional, not additive. The impact forecasts reflect baseline growth, mix effects, and variable interactions.
Segment Analysis
By Material Type: Corrugated Leadership, Paperboard Upswing
Corrugated board contributed 53.61% of Indonesia paper packaging market size in 2025, favored for its strength in humid, multi-modal distribution. PT Fajar Surya Wisesa alone shipped over 1.5 million tons of corrugated medium that year. Paperboard’s 7.04% CAGR outpaces all materials, propelled by premium cosmetics and pharma packs seeking superior graphics.
Corrugated makers are adopting moisture-resistant liners and lightweight fluting, while paperboard suppliers like Alkindo roll out high-bulk grades that cut weight without sacrificing stiffness. Kraft paper and specialty grades remain niche but essential for industrial bags and labels.


By Product Type: Corrugated Boxes Dominate, Folding Cartons Accelerate
Corrugated boxes held 41.78% of Indonesia paper packaging market share in 2025 as e-commerce and FMCG verticals demand sturdy, stackable shipping containers. Folding cartons are forecast to expand at an 7.76% CAGR, mirroring growth in beauty and functional-food segments.
Rigid-box producers leverage digital finishing for short runs, while flexible paper wraps gain acceptance in quick-service restaurants. PT Oki Pulp and Paper Mills’ 2024 green bond financed low-plastic food wraps that extend shelf life
By Packaging Format: Secondary Packaging Prevails
Secondary packaging captured 46.05% of Indonesia paper packaging market size in 2025, owing to the multi-layer protection needs for archipelago shipping. Its 6.74% CAGR is sustained by e-commerce parcels requiring branded mailers and inner cushioning.
Innovations include resealable carry-handles and QR-code-enabled tracking, while Sonoco Asia’s rigid paper containers shield snacks from moisture and oxygen. Primary packaging remains vital for direct food contact, and tertiary wrapping supports bulk export load security.
By End-Use Industry: Food Leads, Personal Care Rises
Food applications commanded 31.85% revenue in 2025 as processed foods, rice, and snacks rely on compliant paper containers. Personal care and cosmetics are projected to climb 7.53% annually as Indonesia’s beauty market matures, seeking premium folding cartons with foil accents and halal adhesives.
Beverage players adopt aseptic cartons supplied by Tetra Pak Indonesia, servicing over 25 local drink brands. Healthcare, industrial, and electronics use niche anti-static or grease-proof grades, rounding out demand diversity.
Geography Analysis
Java accounted for roughly 64.55% of 2025 consumption and capacity, anchored by the Jakarta-Surabaya corridor’s skilled labor, port infrastructure, and proximity to FMCG plants. PT Indah Kiat’s Karawang megaproject will further entrench Java’s dominance once 3.9 million t of board rolls out after 2026.
Sumatra held a near-20.35% share, leveraging rich fiber plantations in Riau and efficient links to Malaysia and Singapore. Asia Pulp and Paper’s Riau mills feed both domestic and export corrugated markets, while local converters service plantation produce requiring moisture-resistant cartons.
Eastern Indonesia - Kalimantan, Sulawesi, Papua - makes up the remaining 15.10% yet offers the fastest 8-10% growth as mining and agriculture boom. High freight costs incentivize on-island box plants; government port upgrades and the National Logistics Ecosystem are expected to narrow regional price gaps.
Regulatory Landscape
Indonesia is tightening quality and environmental compliance for paper packaging, which directly affects converters serving food and FMCG customers. The Ministry of Industry issued Regulation No. 6 of 2025 (effective January 17, 2025), mandating SNI 8218:2024 compliance for paper and cardboard used as primary food packaging, shifting certification from a buyer-driven requirement to a formal gate for market access.
Implementation is also operationally specific: producers and importers need to process SNI certification through SIINas, including uploading Class 16 brand certificates and industrial permits. In parallel, the Ministry of Environment and Forestry is drafting an Extended Producer Responsibility (EPR) ministerial regulation as of July 2026 that shifts post-consumer waste funding to large manufacturers via Packaging Recovery Organizations (PROs), adding a new cost and reporting layer alongside Indonesia's broader circular economy direction.
Value Chain Analysis
The value chain runs from upstream fiber and recovered-paper sourcing to integrated pulp and paper production, then to converting (corrugation, paperboard converting, and printing and coating), followed by downstream distribution across Java-centric industrial corridors and outer-island logistics routes. Large integrated players, for example APP/Sinar Mas via PT Indah Kiat Pulp and Paper and SCG Packaging via PT Fajar Surya Wisesa, anchor supply of linerboard, medium, and paperboard, while mid-sized and regional converters focus on corrugated boxes, folding cartons, and secondary packs built for multi-modal shipping conditions across the archipelago.
Industry coordination and capability building are supported by bodies such as the Indonesian Packaging Federation (IPF), Asosiasi Pulp dan Kertas Indonesia (APKI), and the Indonesia Packaging Recovery Organisation (IPRO) (voluntary, industry-led), which collectively shape standardization, sustainability practices, and collection ecosystems. On the capacity and feedstock side, PT Indah Kiat Pulp and Paper commissioned an OCC line at Karawang rated at 2,000 tons/day (ANDRITZ) and started the first phase of its Karawang facility in 2026 (white paper 1.5 million tons/year and brown paper 0.9 million tons/year). This reinforces Java as a production node and increases the role of recovered fiber processing in local board supply.
Competitive Landscape
SCG Packaging’s near-100% control of PT Fajar Surya Wisesa and Asia Pulp and Paper’s integrated model give local champions scale, while global suppliers target premium niches. The top five firms collectively held an estimated 55-60% of Indonesia paper packaging market share in 2024.
Technology is the key battleground. Automated corrugators, digital printing, and AI-driven quality systems enhance output consistency and minimize waste. International players such as Tetra Pak, SIG Group, and Amcor focus on aseptic, high-barrier, and fully recyclable formats that command above-market margins.
White-space opportunities center on halal-compliant beauty packs, pharmaceutical serialization, and ethnically tailored e-commerce mailers. Packindo steers standard harmonization, and patent filings by PT Toba Pulp Lestari on high-purity pulp underscore domestic R&D momentum.
Indonesia Paper Packaging Industry Leaders
PT Industri Pembungkus Internasional
PT Fajar Surya Wisesa Tbk
PT Pabrik Kertas Indonesia (Pakerin)
PT Pura Barutama
PT Surabaya Mekabox
- *Disclaimer: Major Players sorted in no particular order

Market Opportunities and Future Outlook
Compliance-driven differentiation is creating room for converters that can document primary food-contact performance and brand-owner requirements under mandatory SNI 8218:2024. That, in turn, supports demand for testing, traceability, and certified inputs, including FSC chain-of-custody fiber and recyclable barrier systems referenced by multinational FMCG buyers. It also elevates the value of suppliers that can support SIINas documentation workflows and consistent lot-to-lot quality.
The shift toward producer-funded waste management is moving from voluntary collection efforts to a more formal financing model as the Ministry of Environment and Forestry drafts an EPR regulation in 2026 that uses Packaging Recovery Organizations, creating whitespace for PRO participation, collection partnerships, and packaging redesign programs aimed at improving recyclability and capture rates. At the same time, visible investment activity in Java is supporting higher-specification output and shorter lead times: APP-linked PT Indah Kiat Pulp and Paper started up recovered-fiber capability at Karawang (2,000 tons/day OCC line) and began ramping its new Karawang production facility in 2026. Separately, PT Hoifu Paper Packaging Indonesia broke ground in May 2026 on a new plant in the Kendal SEZ (Rp 1.12 trillion), signaling added converting capacity and competition for premium and export-oriented paper packaging programs.
Recent Industry Developments
- July 2026: Indonesia's Ministry of Environment and Forestry advanced drafting of an Extended Producer Responsibility rule that would require large manufacturers to fund post-consumer waste management through Packaging Recovery Organizations. The move shifts packaging sustainability from voluntary initiatives to a structured cost and compliance item for brand owners and their packaging suppliers. It also increases the strategic value of converters that can support recyclability improvements and reporting discipline.
- June 2026: Indonesia's Ministry of Industry met PT Pabrik Kertas Indonesia (Pakerin) regarding its cardboard paper production line that has been inactive since December 2024 amid internal disputes and liquidity pressure, and discussed facilitation steps including raw material supply support. Extended downtime at a domestic cardboard producer tightens the spotlight on supply continuity for corrugated and paperboard users, particularly those serving food and FMCG channels. Government mediation signals interest in maintaining local packaging paper capacity as demand patterns shift toward certified and recyclable formats.
- April 2025: SIG Group reported business momentum tied to new pack formats referenced in its Indonesia activities. Product-format refresh cycles in aseptic and paper-based packaging raise the bar for graphics, performance, and supplier qualification for beverage and liquid food brands. The update also reinforces the competitive pressure on local converters to add capability in high-barrier structures and faster changeovers.


Research Methodology Framework and Report Scope
Market Definition and Coverage
For this study, the Indonesia paper packaging market covers revenue generated from paper based packaging used to protect, ship, and sell products in the country, counted at the point of consumption and expressed in USD.
Scope exclusions: Plastic, metal, and glass packaging are excluded, and we also do not count non-packaging paper products such as printing and writing paper.
Segmentation Overview
- By Material Type
- Kraft Paper
- Paperboard
- Corrugated Board
- Other Material Types
- By Product Type
- Flexible Paper Packaging
- Pouches and Bags
- Wraps and Films
- Other Flexible Paper Packaging
- Rigid Paper Packaging
- Folding Carton
- Corrugated Boxes
- Other Rigid Paper Packaging
- Flexible Paper Packaging
- By Packaging Format
- Primary Packaging
- Secondary Packaging
- Tertiary / Transit Packaging
- By End-Use Industry
- Food
- Beverage
- Healthcare and Pharmaceuticals
- Personal Care and Cosmetics
- Industrial and Electronic
- Other End-Use Industries
Data Sources, Market Sizing, and Validation
Desk Research
Desk work starts with building the demand context for packaged goods and the supply context for packaging grades used in Indonesia. We mainly review public sources such as Statistics Indonesia (BPS) for manufacturing and trade series, Indonesia Customs style import and export tables where available through public releases, and relevant ministries for plastics reduction and circular economy direction that influences paper substitution.
To ground pricing and volume logic, we also refer to sources such as UN Comtrade for trade flows of paper and paperboard, FAOSTAT for pulp and paper indicators, and peer reviewed packaging and materials journals for lightweighting, recycled content, and barrier paper developments. Company annual reports, investor presentations, and reputable press are used to capture capacity additions, mill upgrades, and end market exposure, and we also use paid subscriptions for company financials and intelligence plus shipment-level trade checks when the public series is too aggregated. This list is not exhaustive, and many other public documents were used during data collection, validation, and research clarification.
Primary Interviews and Surveys
Primary work is used to pressure test the desk assumptions and to fill gaps around conversion yields, channel markups, and near term demand changes in food, beverage, personal care, healthcare, and industrial shipments. We speak with converters, paper and paperboard suppliers, distributors, and large buyers across Indonesia, then we cross-check those inputs with views from logistics and retail linked stakeholders so the final model stays practical.
Distribution of primary research fieldwork respondents
| Company type | Respondent position |
|---|---|
| Top tier: 35% | CXOs: 13% |
| Mid tier: 50% | Functional/Unit leaders: 40% |
| Smaller Players: 15% | Managers: 47% |
Market-Sizing & Forecasting
Sizing is built using a top-down structure where national packaging demand is reconstructed from packaged goods output and trade, and then translated into paper packaging use through format mix and substitution rates. Once the demand pool is set, average realized prices are applied by major paper packaging formats so revenue aligns with how buyers actually procure packaging.
To keep the totals realistic, results are corroborated with selective bottom-up approximations such as sampled converter revenues, capacity utilization checks at key plants, and a few channel checks on typical price ranges for corrugated boxes and folding cartons. Inputs used in the model include production trends in food and beverage and consumer goods, import and export movement of paper and paperboard, corrugated and paperboard share shifts linked to plastic reduction policies, recycled fiber availability, and freight and fuel cost direction that can change delivered packaging prices.
For forecasting, scenario analysis is used so the outlook reflects a base case plus sensitivity around consumer demand, e-commerce shipment intensity, and raw material price movement. When data is missing for small converters, we bridge gaps by using regional format penetration and typical conversion yields, which are then reviewed again with interview feedback before finalizing the run.
Data Validation & Update Cycle
Validation is done through a set of consistency checks that compare the model outputs with independent signals such as paper and paperboard trade direction, packaged goods growth, and announced capacity changes. Outliers are flagged, and assumptions are revisited when the implied price or volume movement looks too sharp for a single year.
A multi-step review happens before sign-off, where another analyst rechecks definitions, unit conversions, and year mapping, and then a final pass is completed close to delivery so the latest public updates are not missed. Reports are refreshed annually, and interim updates are triggered when major regulatory moves, large capacity starts, or clear demand shocks occur.
Mordor Intelligence's Indonesia Paper Packaging Market Size Compared Against Other Published Estimates
It is common to see different market values published for Indonesia paper packaging because the boundary of what is counted can change, even when the topic sounds the same. Differences also come from how price is treated, which year is used as the base, and how quickly assumptions are refreshed when raw material costs swing.
By tracking key packaging format splits and refreshing scope checks, Mordor Intelligence keeps the total tied to paper packaging consumption in Indonesia rather than mixing in adjacent paper products, and this choice alone can widen the spread versus studies that use broader paper and paperboard revenue pools. Gaps also show up when estimates rely mainly on grade level totals without validating conversion to packaging, or when currency timing and inflation pass-through are applied uniformly across formats that behave differently in practice.
Benchmark comparison
| Source | Market Size | Gaps in Research Methodology |
|---|---|---|
| Mordor Intelligence | USD 15.15 B (2025) | |
| Industry Research Publisher A | USD 5.60 B (2025) | Uses a narrower counted value pool, which can happen when only selected packaging formats or a smaller set of end uses are included, and when packaging conversion and pricing are not fully mapped across corrugated, paperboard, and flexible paper packs. |
| Global Data Book B | USD 8.10 B (2025) | Focuses on grade-based revenue (virgin versus recycled) and may not fully reconcile packaging format mix, secondary versus transit packaging use, and format-level price realization, which can lower the implied total for the same country and year. |
The comparison shows that scope boundaries and pricing translation steps are usually the biggest drivers of variation. When definitions, price logic, and cross-checks are written in a traceable way, users can replicate the steps and understand why the final number lands where it does.


Key Questions Answered in the Report
How large is the Indonesia paper packaging market in 2026?
The market is valued at USD 16.02 billion in 2026 and is forecast to grow at a 5.72% CAGR to 2031.
Which material dominates demand in Indonesian paper packs?
Corrugated board leads with 53.61% share thanks to its ability to protect goods shipped across humid, multi-modal routes.
What segment is growing fastest by product type?
Folding cartons are the fastest, advancing at an 7.76% CAGR through 2031 on rising premium-goods packaging.
Why is secondary packaging so important in Indonesia?
Complex archipelago logistics require multilayer protection, giving secondary formats 46.05% share and a 6.74% CAGR.
Which end-use shows the highest growth outlook?
Personal care and cosmetics are projected to expand at 7.53% annually as Indonesia’s beauty market premiumizes.
What is a key challenge restraining market growth?
Volatile recovered-paper import rules add up to 20% cost swings for mills reliant on recycled fiber.
Page last updated on:


 Your data is secure and never sold or shared.


