
Market Overview
| Study Period | 2021 - 2031 |
|---|---|
| Forecast Data Period | 2026 - 2031 |
| Base Year Market Size (2025) | USD 10.15 Billion |
| Market Size (2026) | USD 10.72 Billion |
| Market Size (2031) | USD 14.09 Billion |
| Growth Rate (2026 - 2031) | 5.63 % |
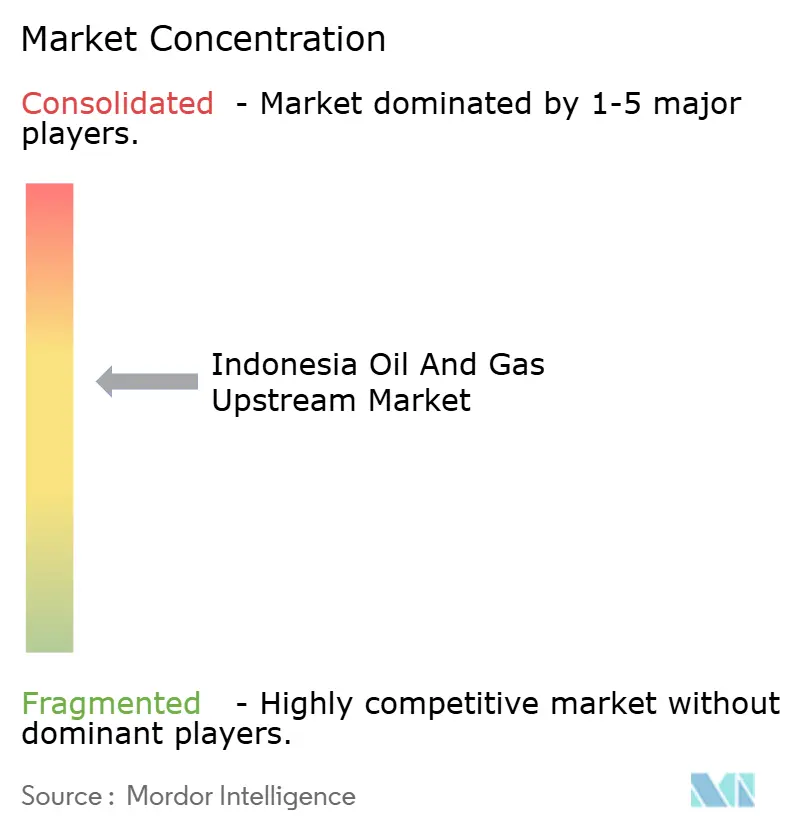
| Market Concentration | Medium |
Major Players *Disclaimer: Major Players sorted in no particular order Image © Mordor Intelligence. Reuse requires attribution under CC BY 4.0. | |
Indonesia Oil And Gas Upstream Market Analysis by Mordor Intelligence
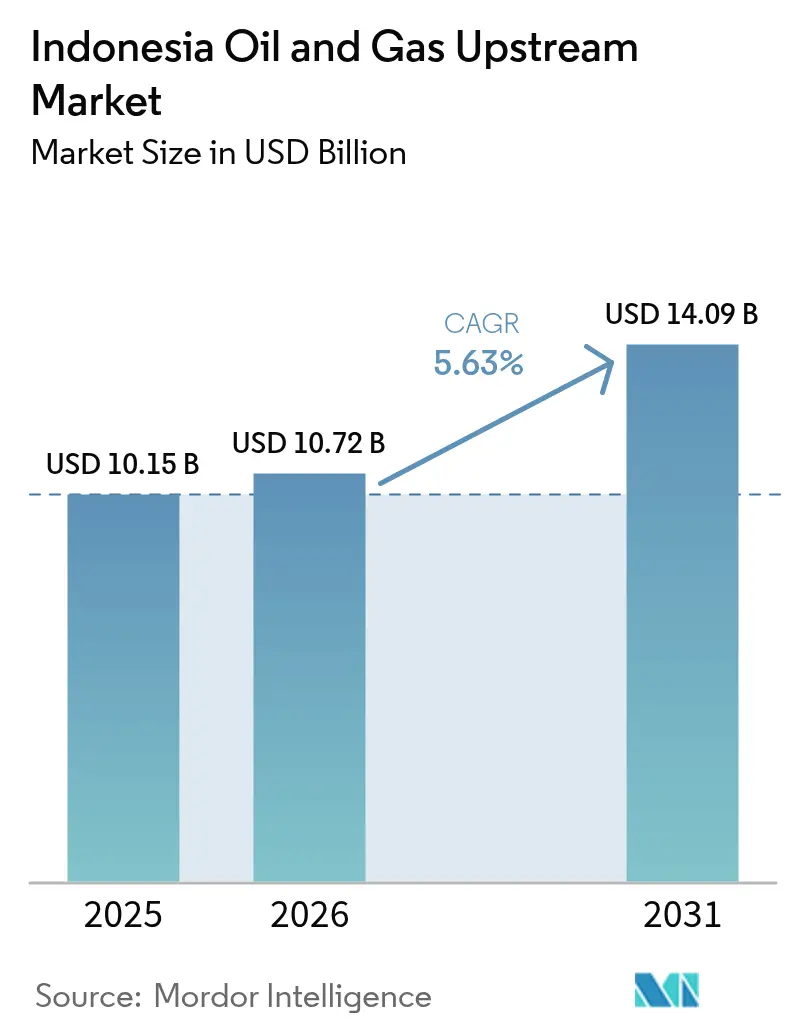
The Indonesia Oil And Gas Upstream Market size is expected to grow from USD 10.15 billion in 2025 to USD 10.72 billion in 2026 and is forecast to reach USD 14.09 billion by 2031 at 5.63% CAGR over 2026-2031.
Deep-water gas discoveries, flexible gross-split fiscal terms, and accelerating digitalization collectively strengthen the outlook for growth. Offshore activities capture capital as operators prioritize high-impact prospects in the Abadi and Andaman blocks, while LNG price linkages continue to underpin revenue. The Indonesian oil & gas upstream market benefits from robust domestic demand and expanding export capacity, yet faces structural decline at mature onshore fields that require enhanced recovery investments. Technology adoption—from AI-guided seismic interpretation to real-time production analytics—reduces non-productive time and enhances safety, ensuring that efficiency gains help offset aging asset pressures. Moderate market concentration, anchored by Pertamina’s 24% share, supports competitive capital deployment without inhibiting new entrants that target unconventional and deep-water plays.
Key Report Takeaways
- By location of deployment, offshore operations led with a 56.20% revenue share in 2025; onshore operations are forecast to deliver the fastest growth, with a 6.14% CAGR through 2031.
- By resource type, crude oil commanded 52.35% of the Indonesian oil & gas upstream market share in 2025, while natural gas is projected to expand at a 6.05% CAGR to 2031.
- By well type, conventional drilling accounted for a 92.75% share of the Indonesian oil & gas upstream market size in 2025 and is expected to advance at a 5.22% CAGR through 2031.
- By service, development and production services captured a 64.10% revenue share in 2025; decommissioning is projected to have the highest 7.74% CAGR between 2026 and 2031.
- Pertamina, ExxonMobil, Chevron, and TotalEnergies jointly held approximately 58% of 2024 production, reflecting a moderate level of concentration that preserves room for independent entrants.
Note: Market size and forecast figures in this report are generated using Mordor Intelligence’s proprietary estimation framework, updated with the latest available data and insights as of 2026.
Indonesia Oil And Gas Upstream Market Trends and Insights
Drivers Impact Analysis*
| Driver | (~) % Impact on CAGR Forecast | Geographic Relevance | Impact Timeline |
|---|---|---|---|
| Fiscal & licensing reform (GR 35/2004 revisions) | 1.20% | National, with concentrated benefits in North Sumatra, East Kalimantan | Medium term (2-4 years) |
| Deep-water gas discoveries (Abadi, Andaman) | 1.80% | Offshore Maluku, North Sumatra, East Kalimantan | Long term (≥ 4 years) |
| LNG export price-linkage upside | 0.90% | National, with primary impact in Bontang, Tangguh export hubs | Short term (≤ 2 years) |
| Production-sharing contract (PSC) extensions | 0.70% | National, concentrated in mature producing basins | Medium term (2-4 years) |
| CCS-EOR hubs enabling tertiary recovery | 0.60% | Java, South Sumatra, East Kalimantan mature fields | Long term (≥ 4 years) |
| AI-led subsurface imaging accuracy | 0.40% | National, early adoption in Pertamina Hulu Rokan operations | Short term (≤ 2 years) |
| Source: Mordor Intelligence | |||
Fiscal & Licensing Reform Accelerates Investment Flows
Revisions to Government Regulation 35/2004 introduce a selectable gross-split regime that awards contractors up to a 95% revenue share for unconventional projects, thereby improving the net present value and shortening the payback period. Operators now switch between cost-recovery and gross-split frameworks to match project risk, an option that has already attracted joint studies from Eni, Harbour Energy, ExxonMobil, and BP. The regulatory update directly addresses earlier investor concerns about fiscal rigidity and stimulates license uptake in frontier acreage, particularly in deep-water tracts where risk-weighted economics favor higher contractor shares. Concurrently, streamlined permitting under MEMR Regulation 13/2024 reduces license approval time from 24 months to 12 months, enabling faster exploration cycles.
Deep-Water Gas Discoveries Reshape Resource Portfolio
The Layaran-1 find in South Andaman validated a 6 TCF resource base and 30 MMSCFD test flow, while the Timpan-1 well holds 5-6 TCF and 27 MMSCFD output potential.[1] Alongside Eni's 5 TCF North Ganal discovery, Indonesia's proven reserves increased by roughly 30%, contingent upon appraisal.[2] SKK Migas schedules the first gas between 2028 and 2030, necessitating subsea pipelines and floating LNG storage that anchor a new export corridor. INPEX's Abadi LNG, which completed FEED in 2024, targets 9.5 MTPA and USD 20 billion capex, reinforcing Indonesia's oil & gas upstream market leadership in regional LNG supply.
AI-Led Subsurface Imaging Transforms Operational Efficiency
Pertamina Hulu Rokan reduced candidate well identification time to one day by utilizing machine-learning-driven seismic analytics—an 86% efficiency increase that accelerates rig scheduling and reserve replacement. The SOPPRED model reduced non-productive rig hours from 82 to 12 and saved 30,000 liters of diesel per well by anticipating gumai shale hazards. Cloud-based AI services from Indosat Ooredoo Hutchinson deliver high-resolution wave measurements that can increase production by 10% and reduce potential fatal injuries by 95%. Such gains lower lifting costs, extend economic field life, and strengthen the Indonesian oil & gas upstream market against price volatility.
CCS-EOR Hubs Enable Tertiary Recovery Potential
Indonesia holds 572 gigatons of CO₂ storage capacity in saline aquifers and 4.85 gigatons in depleted reservoirs, positioning CCS as both an emissions solution and a recovery enabler. Pertamina identified 950 million STB of EOR potential across 12 projects, utilizing its proprietary surfactant, PHR-24, which proved commercially viable in mature Sumatran fields. The Tangguh CCS facility—Southeast Asia’s largest—anchors a network approach that enables high-CO₂ gas fields to move forward, while China-Indonesia technology cooperation accelerates the deployment of tertiary recovery.
Restraints Impact Analysis*
| Restraint | (~) % Impact on CAGR Forecast | Geographic Relevance | Impact Timeline |
|---|---|---|---|
| Aging onshore mature fields | -1.40% | Central Sumatra, South Sumatra, East Java onshore basins | Medium term (2-4 years) |
| Regulatory & contract uncertainty | -0.80% | National, affecting new exploration licensing rounds | Short term (≤ 2 years) |
| Deep-water talent gap | -0.50% | Offshore East Kalimantan, Maluku, North Sumatra | Long term (≥ 4 years) |
| ESG-driven capital scarcity | -0.70% | National, with heightened impact on new offshore projects | Medium term (2-4 years) |
| Source: Mordor Intelligence | |||
Aging Onshore Mature Fields Constrain Production Growth
Roughly 70% of Indonesia’s 44,985 oil wells are mature, declining at a rate of 21% annually, and leaving 16,990 idle sites that require workovers or permanent abandonment (P&A) decisions. The heavy oil dominance in Central Sumatra’s Duri and Rantau Bais fields, with API gravities below 25°, increases thermal and chemical EOR costs. Reactivation programs target 4,500 wells but face economic hurdles without further fiscal sweeteners. Consequently, sustaining base output diverts capital expenditures from exploration, moderating the growth curve of the Indonesian oil & gas upstream market.
ESG-Driven Capital Scarcity Pressures Project Financing
Domestic banks allocate only 1-3% of green portfolios to renewables, yet impose stricter ESG lending filters on hydrocarbons, requiring ISO 14001 compliance and SKUP certification.[3] Pertamina’s 2024 Sustainable Finance Framework secured ISS validation, opening up hybrid green-transition funding; however, the firm still drew USD 2.5 billion in short-term conventional loans during market uncertainty. Stricter ESG scrutiny raises the cost of capital and can delay frontier developments, particularly those with higher carbon dioxide (CO₂) content.
*Our forecasts treat driver/restraint impacts as directional, not additive. The impact forecasts reflect baseline growth, mix effects, and variable interactions.
Segment Analysis
By Location of Deployment: Offshore Momentum Sustains Growth
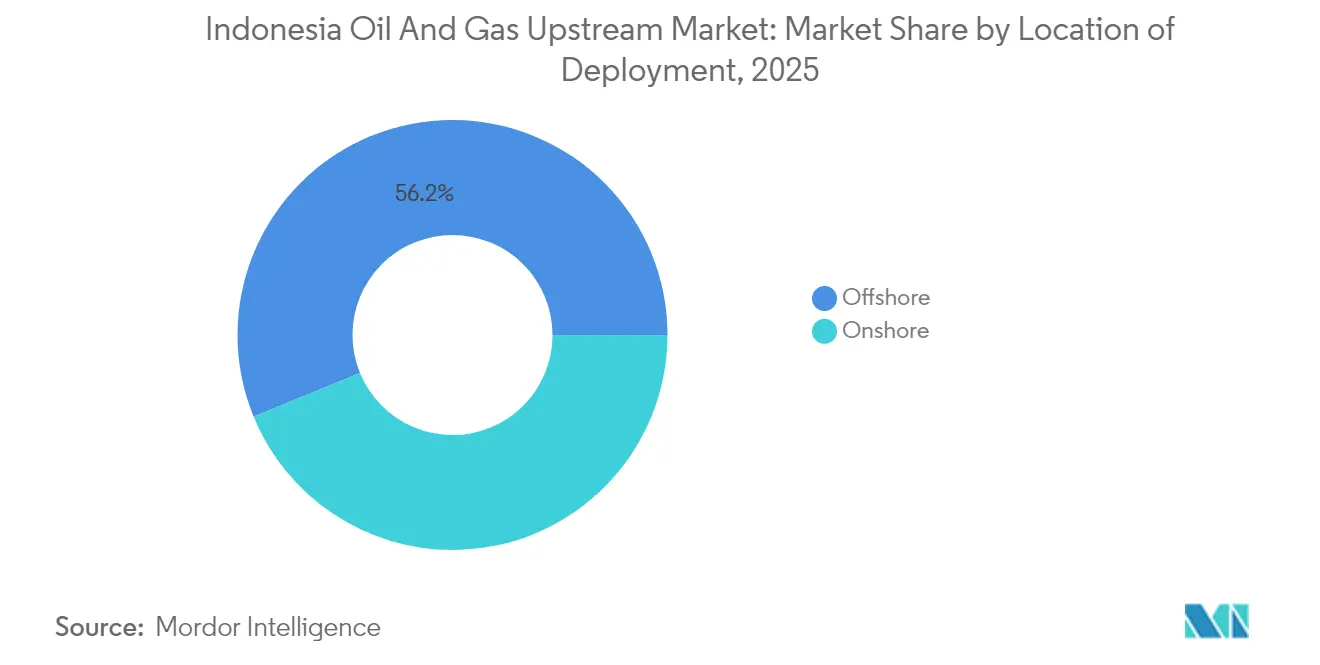
Offshore assets accounted for 56.20% of 2025 revenue and are expected to advance at a 5.88% CAGR, increasing the Indonesian oil & gas upstream market size for offshore assets to USD 8.01 billion by 2031. Massive gas clusters in Andaman and Masela underpin long-cycle cash flows, while brownfield subsea tie-backs around Mahakam preserve volume stability. Operators cite shorter sanction-to-first-gas timelines for jack-up re-entries, and flexible fiscal terms improve project IRR to double-digits under USD 65/bbl scenarios.
Onshore output trails, constrained by mature reservoirs but buffered by lower development costs and proximity to infrastructure. AI-aided workovers at Rokan achieved 152,161 bpd in June 2025, demonstrating that digital optimization can help narrow productivity gaps. Still, heavy crude viscosity and water-cut issues inflate lifting cost to USD 22/bbl versus offshore’s USD 16/bbl. The government’s aim to revive 4,500 idle wells should slow the decline; yet, offshore remains the main growth engine for the Indonesian oil & gas upstream market.

By Resource Type: Gas Ascendance Challenges Oil Supremacy
Crude oil held a 52.35% share in 2025, translating to USD 5.31 billion of the Indonesian oil & gas upstream market size, but expands modestly at a 3.95% CAGR as mature fields dominate the slate. Gas, in contrast, is expected to reach a 46.40% share by 2031, driven by a 6.05% CAGR, backed by startup schedules from Layaran, Timpan, and Abadi. Price-indexed LNG contracts enhance project netbacks when Asian spot prices trend above USD 16/MMBtu, attracting capital expenditure even amid debates about the energy transition.
Elevated CO₂ in Natuna D-Alpha kept bids away, underscoring the need for CCS to unlock mega-gas. Meanwhile, domestic gasification programs accelerate demand from fertilizers and power plants, ensuring offtake security. Collectively, the growth of natural gas materially reshapes the revenue mix within the Indonesian oil & gas upstream market.
By Well Type: Conventional Base Dominates, Unconventional Outlook Brightens
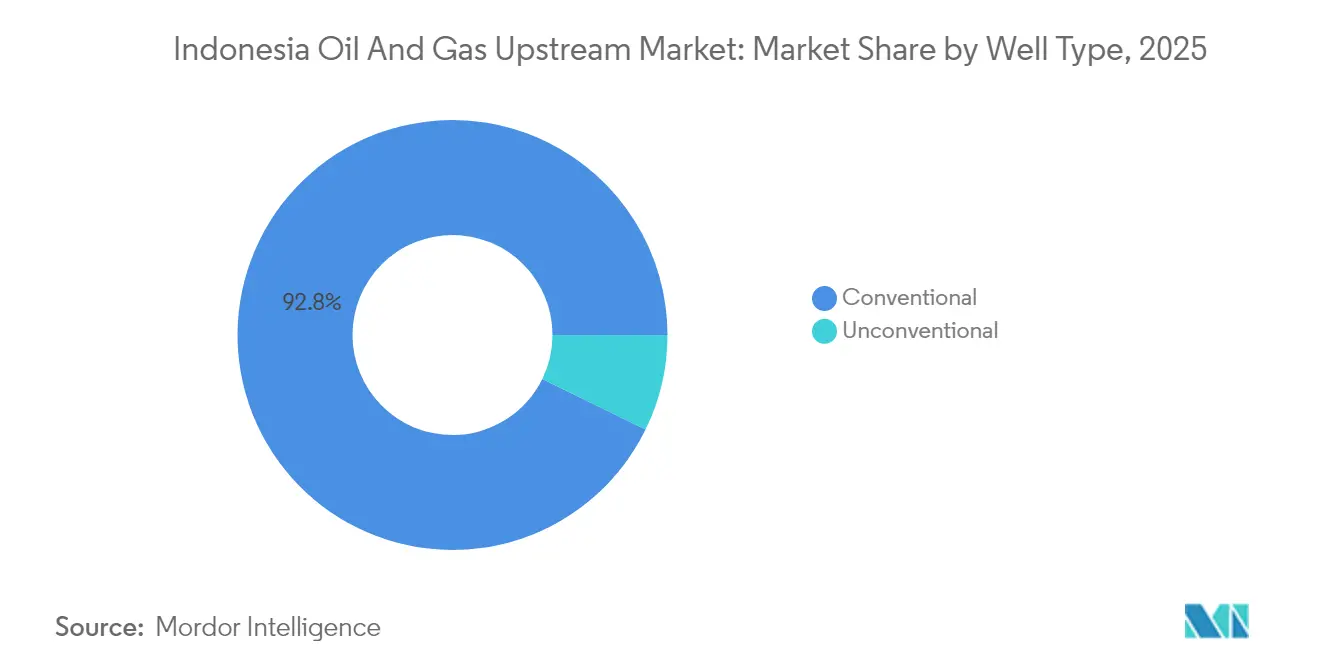
Conventional wells account for a 92.75% share, equivalent to USD 9.41 billion in 2025 revenue, and sustain a 5.22% CAGR through drilling campaigns that have doubled to 40 wells in 2024. This segment anchors near-term cash flow and underpins the Indonesia oil & gas upstream market share advantage for established operators.
Unconventional opportunities post the Gulamo DET-1 find are projected to achieve an 8.42% CAGR, targeting 233 TCF of shale potential across Sumatra. MEMR’s 95% gross-split for shale projects cuts break-even to USD 55/bbl oil equivalent, but hydraulic fracturing supply chains are nascent. Success hinges on technology alliances with North American specialists and water-management best practices, stages that could unlock a multi-billion-dollar upside for the Indonesian oil & gas upstream market.
By Service: Development & Production Lead, Decommissioning Accelerates
Development and production services captured 64.10% of 2025 spend, mirroring operators’ priority on short-cycle output and lifting cost reductions. Robotic process automation at PT Patra Drilling cut invoicing lag by 30 days and improved crew safety, proving digital ROI. The Indonesian oil & gas upstream market size for this service line is forecast to cross USD 9.26 billion by 2031.
Decommissioning services, although with a 4.68% share in 2025, are expected to surge at an 7.74% CAGR as 630 offshore platforms reach the end of their 40-year life. Government guidelines now require abandonment cost provisions in PSCs, spurring early engagement of specialized contractors. Exploration services maintain a stable 5.42% CAGR, driven by annual block auctions and 3D seismic commitments in the Andaman region.
Geography Analysis
East Kalimantan supplied 37.45% of national LNG in 2025 via the Bontang facility, validating the region’s infrastructure depth and export connectivity to Japan, South Korea, and China. Mahakam’s brownfield compression projects sustain plateau, while subsea tie-backs from North Ganal add incremental throughput. Planned CCS in the region further extends asset life and addresses shifts in carbon policy.
Central Sumatra remained Indonesia’s second-largest oil hub at 152,161 bpd in June 2025, driven by Rokan steam-flood optimization. Heavy-oil viscosity and high water-cut demand chemical EOR, which elevates unit costs but also yields upside through enhanced recovery factors. South Sumatra complements established pipeline networks feeding domestic refineries and power plants, anchoring demand certainty that underpins continuing infill drilling.
North Sumatra–Andaman and offshore Maluku mark Indonesia’s frontier axis. Layaran-1’s 6 TCF discovery and Abadi’s 9.5 MTPA LNG plan attract global capital, yet deep-water skills gaps and subsea infrastructure requirements prolong timelines. Still, the cumulative resource base positions these provinces as the future growth pole for the Indonesian oil & gas upstream market, shifting the production center of gravity eastward by the next decade.
Regulatory Landscape
Indonesia's upstream oil and gas activity is overseen by the Ministry of Energy and Mineral Resources (MEMR), with operations managed through SKK Migas under Law No. 22/2001 (as amended) and implementing regulations such as GR No. 35/2004 and GR No. 55/2009. PSCs are the primary contracting route, and business licensing is handled through the Online Single Submission (OSS) system to obtain a Business Identification Number (NIB).
The policy cycle has focused on fiscal and permitting adjustments, including MEMR Regulation No. 13/2024 on Gross Split PSCs and MEMR Decree No. 9.K/MG.01/MEM.M/2024 on accelerating conventional oil and gas business activities. In April 2026, the DPR RI announced the formation of a working committee (PANJA) to draft a new Oil and Gas Bill to replace the current Oil and Gas Law, keeping legislative work in focus for how governance and investment certainty could change.
Competitive Landscape
Pertamina controlled 24% of the 2024 upstream revenue, producing 69% of the nation's oil and 34% of its gas, leveraging integrated logistics and preferential acreage access. ExxonMobil Cepu remained the single largest field operator at 152,330 bpd, evidencing continued international relevance. Overall, the Indonesian oil & gas upstream market balances state participation with foreign expertise, fostering a moderately concentrated, innovation-oriented ecosystem.
Strategic alliances define recent moves. Eni and Petronas formed a joint venture targeting 3 billion barrels of oil equivalent (boe) of reserves and a 500,000 barrels of oil equivalent per day (boe/d) plateau, utilizing cash-flowing assets to fund exploration. Medco Energi's acquisition of Siak and Kampar blocks added 3,000 bpd and underscored consolidation trends among independents. Operators differentiate themselves by technology; AI rollouts, which claim 10% productivity gains and a 95% reduction in safety risks, present a competitive edge.
White-space opportunities surface in unconventional shale, deep-water floaters, and CCS hubs backed by 572 gigatons of storage headroom. Firms mastering these niches should capture above-average returns as Indonesia's oil & gas upstream market growth pivots from brownfield optimization to frontier monetization.
Indonesia Oil And Gas Upstream Industry Leaders
-
Chevron Corporation
-
Exxon Mobil Corp
-
PT Pertamina Persero
-
BP plc
-
INPEX Corp.
- *Disclaimer: Major Players sorted in no particular order
Market Opportunities and Future Outlook
Near-term opportunity is anchored in fast-cycle production additions and brownfield revitalization supported by state programs and operator execution. SKK Migas publicized a 2026 onstream target for multiple upstream projects with a combined investment of USD 1.319 billion, which supports spending across engineering, drilling, commissioning, and production-operations services tied to development and production activity. At the same time, the government is pushing exploration scale-up through an Indonesia oil and gas exploration program that targets 108 potential basins, widening the set of frontier and underexplored plays beyond established producing corridors.
Contract and collaboration structures are also opening pathways for technology-led involvement in mature assets. PT Pertamina Hulu Energi progressed Joint Operation and/or Technology (KSOT) partnering preparations for 22 oil and gas structures under the framework of ESDM Regulation No. 14/2025, which aligns with the need to improve recovery from aging fields and reactivate marginal opportunities. The 2026 state budgeting assumptions discussed by DPR RI Commission XII and the ESDM Minister include national oil and gas lifting targets for 2026, keeping attention on execution levers such as EOR, facility debottlenecking, and digital optimization alongside continued exploration licensing.
Recent Industry Developments
- July 2026: PT Pertamina Hulu Energi (PHE) launched Indonesia's first offshore chemical enhanced oil recovery (CEOR) project at the Rama Field in the Southeast Sumatra Working Area. The move marks a step-change in tertiary recovery deployment offshore, creating a replicable pathway for lifting production from mature assets and expanding demand for specialty chemicals and integrated production services.
- May 2026: Indonesia opened the first oil and gas bidding round of 2026, offering 13 blocks with estimated resources of 16 billion barrels of oil equivalent. The offering widens the pipeline of exploration acreage and can accelerate seismic and drilling activity for both incumbents and new entrants targeting frontier and deep-water plays.
- October 2024: PT Energi Mega Persada (ENRG), affiliated with the Bakrie Group, acquired all participating rights in the Sengkang oil and gas block. The deal consolidated operatorship and investment control in a producing asset, supporting near-term optimization and redevelopment activity within Indonesia's upstream portfolio.
Research Methodology Framework and Report Scope
Market Definition and Coverage
For this study, the Indonesia oil and gas upstream market is defined as the value of activities linked to finding, developing, producing, and closing oil and gas assets within Indonesia, including related field services tied to upstream work programs.
Scope exclusions: Midstream transport and storage, refining, petrochemicals, fuel retail, and power generation are not counted in this market sizing.
Segmentation Overview
- By Location of Deployment
- Onshore
- Offshore
- By Resource Type
- Crude Oil
- Natural Gas
- By Well Type
- Conventional
- Unconventional
- By Service
- Exploration
- Development and Production
- Decomissioning
Data Sources, Market Sizing, and Validation
Desk Research
Desk research was used to build the fact base for activity levels and the policy setting that influences upstream spending in Indonesia. We reviewed public releases and data series from sources such as SKK Migas updates, the Ministry of Energy and Mineral Resources (ESDM), Statistics Indonesia (BPS), and OPEC and IEA country tables for production and consumption context.
In addition, company annual reports, investor presentations, and audited financial statements were used to understand work program priorities, capex direction, and asset life cycle patterns. For cross-checking, we also referred to reputable press coverage and project award announcements, and we used a paid subscription for company financials and a patent database to confirm technology and development themes where they mattered for cost direction. These examples are not exhaustive, and many other public documents and datasets were reviewed to collect, verify, and clarify inputs.
Primary Interviews and Surveys
Primary work was done through expert interviews and structured surveys with upstream operators, oilfield service participants, supply chain and logistics stakeholders, and domain specialists who track Indonesia licensing and development activity. Inputs were used to test desk assumptions around project phase timing, typical service intensity by field type, and the pace of spending shifts between onshore and offshore programs.
Distribution of primary research fieldwork respondents
| Company type | Respondent position |
|---|---|
| Top tier: 32% | CXOs: 13% |
| Mid tier: 53% | Functional/Unit leaders: 30% |
| Smaller Players: 15% | Managers: 57% |
Market-Sizing & Forecasting
Sizing was built using a top-down and bottom-up combination. We first reconstructed national upstream activity and spending signals, then checked them using selective supplier and project-level approximations. The top-down side used Indonesia upstream investment and work program indicators as the demand pool, which were then allocated across major upstream service activities to reflect how spending typically flows during exploration, development, production support, and decommissioning.
To keep the model grounded, key inputs included upstream investment and expenditure trends, active block and field development timelines, well activity direction, onshore versus offshore mix, and oil versus gas project emphasis. Together, these drive changes in service intensity and pricing. Forecasting relied mainly on scenario analysis, since upstream spend can change quickly based on approvals, delays, and price expectations, and then the scenarios were stress-tested with expert views on near-term project pacing.
When bottom-up signals were used, they were limited to practical checks such as sampled project awards, typical service cost bands by activity, and consistency checks against publicly discussed capex commitments. Any gaps were filled using conservative ranges and revisited during validation calls.
Data Validation & Update Cycle
Outputs were validated through multiple checks so the final value does not rely on one data stream. We compared the modeled totals against independent signals such as upstream expenditure statements, activity milestones, and major project timing, and then reviewed outliers that appeared too high or too low versus known market conditions.
Before sign-off, assumptions were re-checked by another analyst, and follow-up calls were triggered when key inputs moved outside expected ranges, for example a material change in a large development schedule. Reports are refreshed annually, with interim updates when major regulatory changes, project sanctions, or macro shocks materially shift upstream spending expectations, and a final pre-delivery review is done to ensure the latest public information is reflected.
Mordor Intelligence's Indonesia Oil and Gas Upstream Market Size Versus Other Published Estimates
Published market sizes for Indonesia upstream often do not match, even when the topic name looks similar, because the counted cost items and timing assumptions can change the total a lot. Differences usually come from what is treated as upstream spend versus project capex, whether decommissioning is included, and how quickly future developments are assumed to move from planning into execution.
By tracking project phase gates and refreshing cost intensity assumptions with Mordor Intelligence in the middle of the sizing workflow, the market value stays aligned to exploration, development, production support, and decommissioning activity that can be supported by observable Indonesia program signals.
Benchmark comparison
| Source | Market Size | Gaps in Research Methodology |
|---|---|---|
| Mordor Intelligence | USD 10.15 B (2025) | |
| Industry Advisory A | USD 15.33 B (2024) | Uses reported upstream investment and total expenditure as the headline number, which can include administration items and broader operator spend that does not map one-to-one to upstream service market value in a single year. |
| Sector Report B | USD 10.72 B (2025) | The value appears to reflect a different scope boundary or pricing basis for upstream activities, and it may blend in a more aggressive capex translation to market value without clearly separating service phases such as decommissioning. |
The spread in the table mainly comes from whether the figure is an expenditure headline or a market value built from upstream activity mix, and from how phases are timed into the counted year. Using clear inclusions and repeatable checks helps keep the estimate tied to what is actually executed in Indonesia upstream programs.
Key Questions Answered in the Report
What is the current value of the Indonesia oil & gas upstream market?
It was USD 10.72 billion in 2026 and is projected to hit USD 14.09 billion by 2031.
How fast is upstream spending growing in Indonesia?
The sector is forecast to post a 5.63% CAGR between 2026-2031, driven by offshore gas and digital efficiency gains.
Which segment leads upstream activities?
Development and production services hold 64.10% of spending, reflecting a focus on maximizing existing assets.
Where are the largest new gas finds located?
Deep-water South Andaman, North Ganal, and Masela blocks collectively add more than 15 TCF of gas resources.
How is technology improving field economics?
AI-guided seismic imaging and real-time analytics cut well identification time by 86% and reduce non-productive rig hours.
What role does CCS play in Indonesia?
With 572 gigatons storage capacity, CCS supports enhanced oil recovery and enables development of high-CO? gas fields.