
Market Overview
| Study Period | 2021 - 2031 |
|---|---|
| Forecast Data Period | 2026 - 2031 |
| Base Year Market Size (2025) | USD 2.18 Billion |
| Market Size (2026) | USD 2.29 Billion |
| Market Size (2031) | USD 2.9 Billion |
| Growth Rate (2026 - 2031) | 4.88 % |
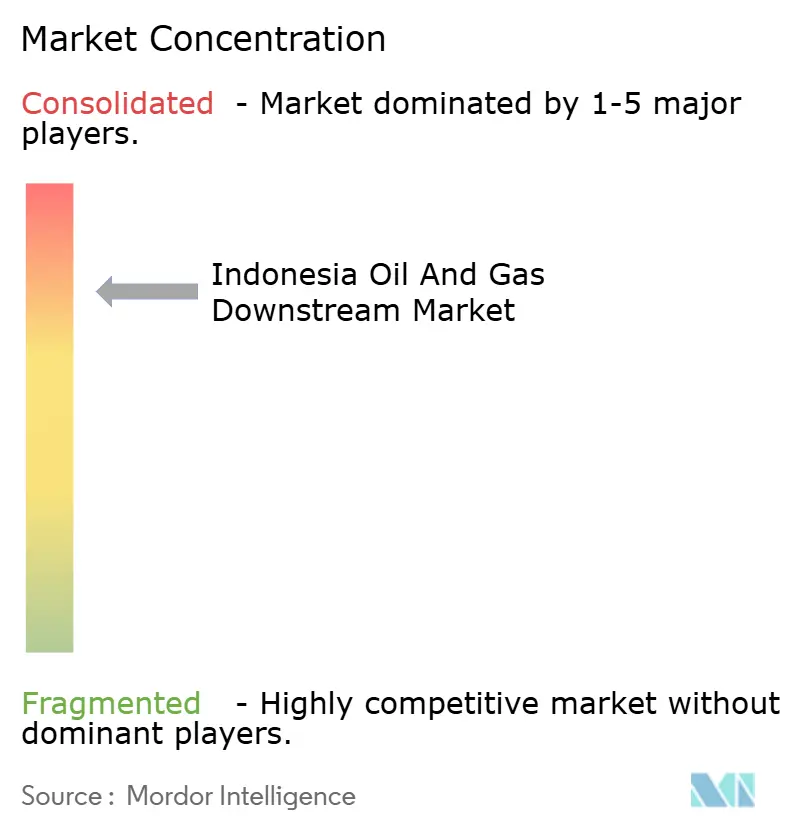
| Market Concentration | High |
Major Players *Disclaimer: Major Players sorted in no particular order Image © Mordor Intelligence. Reuse requires attribution under CC BY 4.0. | |
Indonesia Oil And Gas Downstream Market Analysis by Mordor Intelligence
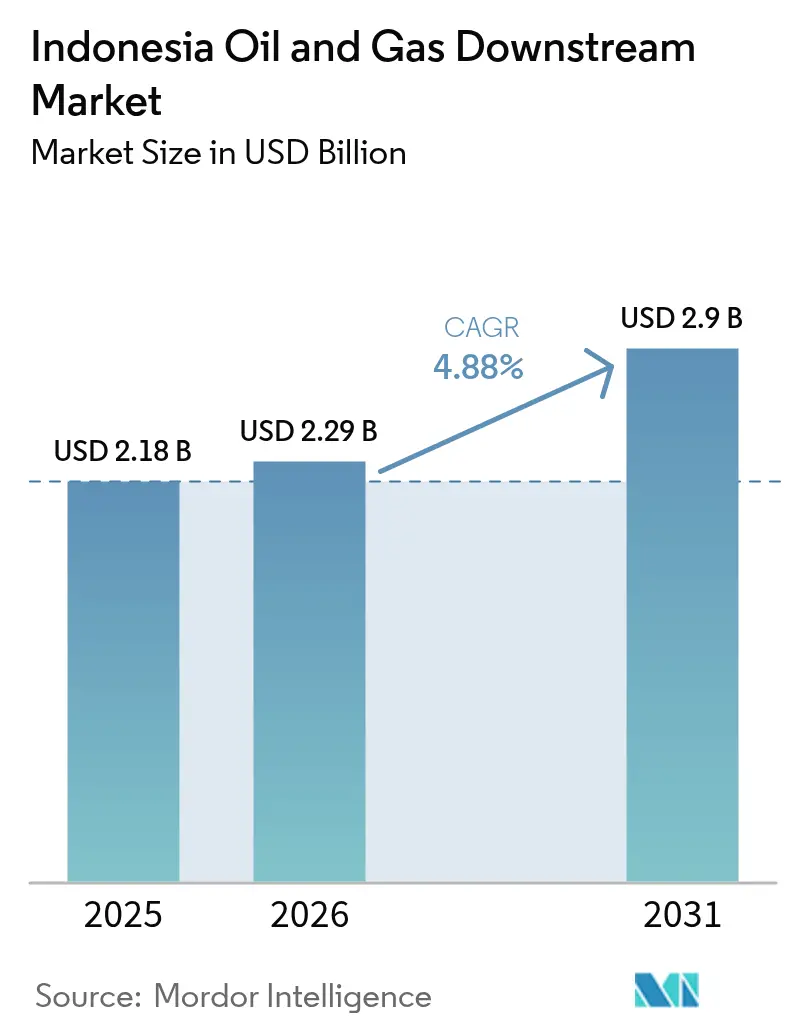
Indonesia Oil And Gas Downstream Market size in 2026 is estimated at USD 2.29 billion, growing from 2025 value of USD 2.18 billion with 2031 projections showing USD 2.9 billion, growing at 4.88% CAGR over 2026-2031.
Strong government backing for refinery expansions, rising domestic fuel demand, and world-scale petrochemical investments underpin this trajectory. Additional momentum comes from tighter fuel-quality rules that spur refinery upgrades and from escalating biodiesel blending mandates that pull more palm-oil feedstock into downstream processing. International majors are entering through joint ventures, prompting local players to modernize assets and strengthen cost positions. Intense competition from Singapore and Malaysia presses Indonesian operators to leverage domestic feedstock advantages and state incentives for new complexes.
Key Report Takeaways
- By type, refineries controlled 63.32% of Indonesia's oil and gas downstream market share in 2025, while petrochemical plants are set to log the fastest 6.55% CAGR through 2031.
- By product type, refined petroleum products held a 57.96% share of the Indonesian oil and gas downstream market size in 2025, whereas petrochemicals are forecast to expand at a 6.6% CAGR to 2031.
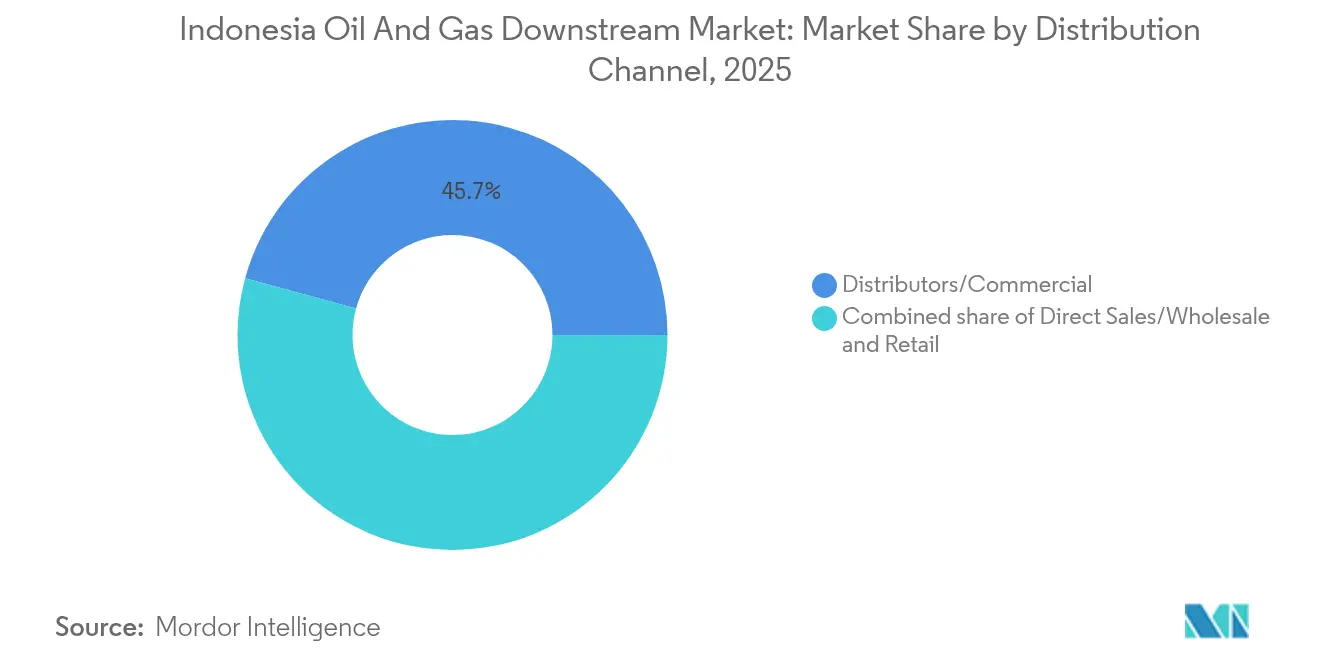
- By distribution channel, distributors and commercial sales captured a 45.74% share in 2025, yet retail channels are advancing at a 6.32% CAGR amid Pertamina's station modernization program.
Note: Market size and forecast figures in this report are generated using Mordor Intelligence’s proprietary estimation framework, updated with the latest available data and insights as of 2026.
Market Trends and Insights
Drivers Impact Analysis of Indonesia Oil And Gas Downstream Market*
| Driver | (~) % Impact on CAGR Forecast | Geographic Relevance | Impact Timeline |
|---|---|---|---|
| Government push to expand domestic refining capacity | 1.50% | National, concentrated in Java, Kalimantan, Sulawesi | Medium term (2-4 years) |
| Rising domestic fuel demand from transport & industry | 0.80% | National, urban centers and industrial zones | Long term (≥ 4 years) |
| Surge in investments for world-scale petrochemical complexes | 0.90% | Java and Sumatra coastal areas | Medium term (2-4 years) |
| Implementation of B35 biodiesel blending mandate | 0.70% | National, palm oil producing regions | Short term (≤ 2 years) |
| Mandatory Euro-4 sulfur limits driving refinery upgrades | 0.60% | National, existing refinery locations | Medium term (2-4 years) |
| Airport network expansion spurring jet-fuel value-chain projects | 0.50% | Major airports and aviation hubs | Long term (≥ 4 years) |
| Source: Mordor Intelligence | |||
Government Push to Expand Domestic Refining Capacity
Indonesia doubled its planned additions from 500,000 to 1 million barrels per day across 16 sites, creating regional hubs that cut logistics costs and lift energy security.[1] Balikpapan’s upgrade, now 91% complete, illustrates the technical depth and capital outlay required for Euro-4 fuel compliance. Distributed capacity also aligns with the industrial policy that shifts value from raw exports to processed fuels. Success hinges on securing crude supplies and training personnel capable of operating advanced hydrotreaters. The program positions Indonesia to reduce import dependence while supporting future petrochemical integration.
Rising Domestic Fuel Demand from Transport & Industry
GDP growth and urbanization accelerate vehicle ownership, aviation traffic, and factory output, stretching local supply and raising import bills.[2] Infrastructure, such as new toll roads and industrial estates, deepens regional fuel demand. Aviation route expansion increases jet-fuel needs, which require higher-spec refiners. Sustained demand gives investors confidence despite crude price swings, yet it magnifies exposure to external oil-price shocks.
Surge in Investments for World-Scale Petrochemical Complexes
Projects like Lotte Chemical’s USD 4 billion facility in Banten and ExxonMobil’s USD 15 billion East Java complex combine scale with carbon-capture technology.[3] Investors capitalize on competitive natural-gas pricing, palm-oil feedstocks, and tax incentives. Domestic firms such as Chandra Asri join the build-out, boosting employment and technology transfer. The wave strengthens Indonesia’s bid to become a regional chemical hub, though it heightens competition for gas and skilled labor.
Implementation of B35-to-B40 Biodiesel Mandate
Nationwide B40 blending, which began in mid-2024, has increased biodiesel demand by 2.3 million tons per year, thereby boosting palm-oil utilization and reducing fossil fuel imports.[4] Higher blends require upgraded storage, specialized pumps, and rigorous quality controls adhering to national standards. Distributors adjust logistics while integrators explore co-locating biodiesel and traditional fuel units to optimize throughput. Success depends on synchronizing palm-oil supply with fuel sales, ensuring stable economics for both sectors.
Restraints Impact Analysis of Indonesia Oil And Gas Downstream Market*
| Restraint | (~) % Impact on CAGR Forecast | Geographic Relevance | Impact Timeline |
|---|---|---|---|
| Environmental & decarbonization pressures on fossil assets | -0.70% | National, concentrated in industrial areas | Long term (≥ 4 years) |
| Chronic delays & cost overruns in refinery megaprojects | -0.50% | Major refinery development sites | Medium term (2-4 years) |
| Shortage of advanced downstream technical workforce | -0.40% | National, acute in specialized facilities | Long term (≥ 4 years) |
| Margin squeeze from Singapore/Malaysia hub competition | -0.30% | Regional, affecting export-oriented facilities | Medium term (2-4 years) |
| Source: Mordor Intelligence | |||
Environmental and Decarbonization Pressures on Fossil Assets
Indonesia’s Net Zero 2060 pledge attracts stricter emission rules and potential carbon pricing that inflate operating costs. Global lenders deploy ESG filters, limiting finance for traditional plants unless carbon-capture modules are integrated. Extended permitting and civil-society scrutiny can hold back new builds, raising the specter of stranded assets as cleaner energy alternatives scale up. Operators must weigh near-term demand against long-run climate liabilities.
Chronic Delays and Cost Overruns in Refinery Megaprojects
The Pertamina-Rosneft Tuban project, now scheduled for 2026, exemplifies the challenges of land acquisition and contractor coordination. Inflation in steel and specialized equipment pushes budgets beyond initial scopes, forcing renegotiations and eroding investor confidence. Slippage cascades into crude-supply contracts and product offtake deals, complicating cash flows and dampening sector credibility.
*Our forecasts treat driver/restraint impacts as directional, not additive. The impact forecasts reflect baseline growth, mix effects, and variable interactions.
Indonesia Oil And Gas Downstream Market Segment Analysis
By Type:
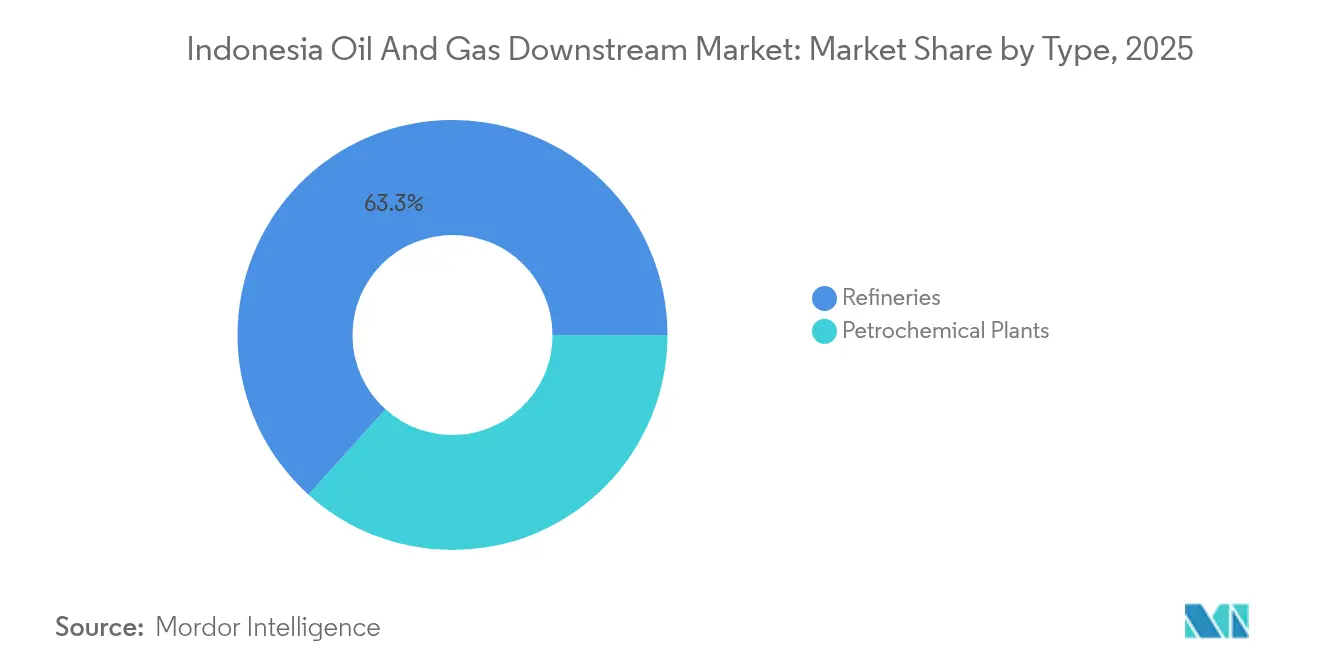
Refineries Anchor Market FoundationRefineries remained the backbone, with a 63.32% share of Indonesia's oil and gas downstream market in 2025, underpinned by government programs aimed at doubling national throughput. The Indonesian oil and gas downstream market size attributed to refineries is forecast to expand steadily through 2031 as Balikpapan and Tuban come online. Margins, however, face pressure from higher environmental compliance costs and tighter regional competition. Petrochemical plants, aided by world-scale complexes, are projected to record a 6.55% CAGR, reflecting shifting value toward higher-margin chemicals. International majors supply advanced process technology and capital, while domestic firms provide regulatory insight and local logistics.
The integration trend blurs the boundaries between refinery and chemical operations, allowing for shared feedstock optimization and an economy of scope. Combined sites capture naphtha streams for cracker units, improving overall utilization. Workforce challenges persist, as high-skill engineers often migrate abroad, prompting the development of joint training programs. Government oversight ensures safety and environmental performance, though enforcement consistency varies across provinces.

By Product Type:
Petrochemicals Drive Value CreationRefined petroleum products accounted for 57.96% of Indonesia's oil and gas downstream market share in 2025, supplying gasoline, diesel, and jet fuel to the growing transport and industrial sectors. The Indonesian oil and gas downstream market size linked to refined fuels is expected to expand slowly as efficiency gains counterbalance vehicle growth. Petrochemicals, led by ethylene and polyethylene, are expected to post the fastest 6.6% CAGR, driven by Asian demand and local feedstock advantages. Companies leverage natural-gas derivatives and palm-oil-based chemicals to tap higher value pools.
Quality standards tighten across all product lines, compelling investment in hydrocrackers and finishing units. Lubricants capture niche growth from rising automotive sales, while specialty chemicals benefit from the expansion of packaging and consumer-goods manufacturing. Digital batch tracking enhances quality assurance, bolstering export credibility to regional buyers.
By Distribution Channel:
Retail Modernization Accelerates GrowthDistributors and commercial bulk sales accounted for 45.74% of total 2025 revenue, reflecting a dependence on large buyers, such as power plants and transportation fleets. Retail channels, although smaller, are projected to rise at a 6.32% CAGR as Pertamina refurbishes its stations with cashless payment, convenience retail, and alternative fuel options. The Indonesian oil and gas downstream market, tied to retail, is expected to benefit from expanding passenger-car ownership and the growth of ride-hailing services.
Bulk channels focus on custom blends and just-in-time delivery to mining and manufacturing sites scattered across the archipelago. Digital logistics platforms optimize routing and inventory for remote islands, reducing stockouts. Foreign brands assess selective entry but face local content and partnership requirements that limit their ability to roll out rapidly.
Geography Analysis
Java hosts the bulk of refining and petrochemical capacity, servicing the nation’s largest consumer base and manufacturing clusters. Sumatra supplies significant crude and palm oil output, supporting integrated biodiesel operations that feed both domestic blending mandates and export markets. The Indonesian oil and gas downstream market share concentrated in Java is expected to moderate as new assets in Kalimantan and Sulawesi come online.
Kalimantan’s planned refinery projects capitalize on the proximity to coal and gas reserves, yet infrastructure gaps and environmental constraints hinder progress. Eastern regions, such as Maluku and Papua, form part of a 16-site expansion plan that targets fuel security, although workforce shortages and higher logistics costs increase project complexity. Coastal sites are favored for petrochemical exports, while inland plants serve as part of the domestic distribution corridors.
Logistical challenges from Indonesia’s archipelagic geography necessitate marine terminals, floating storage, and multi-modal links to ensure a steady supply. Weather disruptions prompt strategic stockpiling on remote islands. Regulatory enforcement varies by province, introducing compliance uncertainty that investors factor into their risk assessments.
Regulatory Landscape
Indonesia's downstream oil and gas activities (processing, transportation, storage, and trading) are primarily regulated by the Ministry of Energy and Mineral Resources (MEMR/ESDM), with supervision handled by the Downstream Oil and Gas Regulatory Agency (BPH Migas). BPH Migas regulates and oversees fuel supply and distribution and natural gas transportation via pipelines, while the Directorate General of Oil and Gas under MEMR sets policy direction for downstream development.
Key legal anchors include Government Regulation No. 36 of 2004 on downstream oil and natural gas business activities (as amended). Business licensing for processing, storage, transportation, and trading is routed through the Online Single Submission (OSS) system. Presidential Regulation No. 191 of 2014 and later amendments continue to guide fuel distribution and retail pricing administration for certain fuel categories, and risk-based licensing reforms under Government Regulation No. 28 of 2025 require sector-level implementing rules that translate the framework into operational permitting and compliance requirements for new and upgraded downstream assets.
Competitive Landscape
PT Pertamina and its subsidiaries have the largest footprint, thanks to their vertically integrated refining, distribution, and retail networks, which underpin a moderately consolidated market. International majors such as TotalEnergies, Shell, and ExxonMobil adopt partnership models, supplying capital and advanced technology while navigating local regulations. The combined share of the five largest players hovers near 55%, maintaining significant but not dominant concentration.
Strategic moves focus on capacity upgrades, carbon capture integration, and digital process control to reduce operating costs and meet Euro 4 and future Euro 5 standards. ExxonMobil’s East Java complex couples refining with sequestration, signaling a pivot toward lower-carbon downstream assets. Shell’s predictive-maintenance rollout reduced operating expenses by 12%, demonstrating the competitive edge gained through digitalization.
Regional rivals in Singapore and Malaysia, who leverage efficient ports and lower compliance costs, are prompting Indonesian firms to utilize domestic feedstock and take advantage of government incentives. Niche entrants are exploring bio-based chemicals and sustainable aviation fuel, although scale and financing remain significant hurdles. Technology partnerships and local workforce development will shape long-term advantages.
Indonesia Oil And Gas Downstream Industry Leaders
-
PT Pertamina(Persero)
-
TotalEnergies SE
-
Shell plc
-
BP plc
-
PETRONAS
- *Disclaimer: Major Players sorted in no particular order
Indonesia Oil And Gas Downstream Market Companies Covered in this Report
- PT Pertamina (Persero)
- PT Kilang Pertamina Internasional
- PT Perusahaan Gas Negara Tbk
- PT Chandra Asri Petrochemical Tbk
- TotalEnergies SE
- Shell plc
- Chevron Corporation
- Exxon Mobil Corporation
- BP plc
- Eni S.p.A.
- PETRONAS
- Sinopec (China Petroleum & Chemical Corp.)
- China National Petroleum Corp.
- PT Trans-Pacific Petrochemical Indotama
- Lotte Chemical Titan
- PT Pupuk Kalimantan Timur
- ConocoPhillips
- PT Medco Energi Internasional Tbk
- Korea National Oil Corp.
- PT Badak NGL
Market Opportunities and Future Outlook
Policy-backed capacity additions and fuel-quality and biofuel mandates are creating investable workstreams across refining, terminals, and distribution infrastructure. In January 2026, Pertamina officiated the operational launch of the Balikpapan RDMP upgrade (USD 7.4 billion), lifting capacity from 260,000 to 360,000 bpd and reinforcing demand for debottlenecking and Euro-grade upgrade packages at existing sites. In April 2026, the government launched phase II downstreaming projects tied to refinery expansion at Cilacap (RU IV) and Dumai (RU II), with a stated 62,000 bpd gasoline processing uplift targeted by Q4 2030, which expands the addressable market for EPCC, catalysts, utilities, and supporting marine and storage logistics.
Biofuel blending policy is also reshaping downstream demand patterns and infrastructure needs. MEMR Decree 113.K/EK.05/MEM.E/2026 sets a mandatory roadmap at B40 in 2026 and B50 for 2027-2030, increasing requirements for blending quality control, tankage segregation, additive handling, and last-mile distribution readiness. Alongside large petrochemical builds referenced in the market context (including Lotte Chemical in Banten and ExxonMobil-linked downstream integration concepts), these measures create room for integrated refinery-petrochemical configurations, low-carbon retrofit packages such as carbon-capture integration where feasible, and digital logistics and retail modernization initiatives led by incumbents such as Pertamina.
Recent Industry Developments in Indonesia Oil And Gas Downstream Market
- July 2026: Indonesia officially launched the mandatory B50 biodiesel program on July 1, 2026, moving diesel supply to a 50% palm-oil-based blend nationwide. The rollout started across 29 fuel terminals with a transition window through September 30, 2026, to clear remaining B40 inventories, tightening requirements for storage, blending, and fuel-quality controls across the distribution chain.
- June 2026: Pertamina Patra Niaga raised prices for non-subsidized fuels, including RON-92 Pertamax and RON-95 Pertamax Green, following its periodic evaluation of global crude benchmarks. The adjustment reinforced price sensitivity in the retail channel and increased the need for operators to manage margin volatility through supply optimization and differentiated premium-fuel offerings.
- September 2025: Pertamina reported the Balikpapan refinery upgrade at 96.5% completion, with the RFCC unit scheduled to start up in Q4 2025. The project lifts capacity from 260,000 to 360,000 bpd and upgrades product quality, supporting domestic supply substitution and increasing demand for advanced refining operations and reliability practices.
Indonesia Oil And Gas Downstream Market Report Scope and Research Methodology
Market Definition and Coverage
For this methodology, the Indonesia oil and gas downstream market is defined as the value generated from domestic downstream operations that convert hydrocarbons into sellable products and move them to end buyers through wholesale and retail routes, covering refining and petrochemical plant output along with lubricants in the downstream basket.
Scope exclusions: Upstream exploration and production, and pure midstream transmission-only services are excluded unless they are bundled as part of downstream product supply in the same value chain step.
Segments Covered in This Report
- By Type
- Refineries
- Petrochemical Plants
- By Product Type
- Refined Petroleum Products
- Petrochemicals
- Lubricants
- By Distribution Channel
- Direct Sales/Wholesale
- Distributors/Commercial
- Retail
Data Sources, Market Sizing, and Validation
Desk Research
Desk research was used to build a clean fact base on Indonesia fuel demand, refinery operations, and trade dependency, which later helped us anchor the model to realistic volume and price ranges. We referred to public sources such as the Ministry of Energy and Mineral Resources (ESDM) statistics handbooks, BPS trade and industry tables, customs import and export releases, and OPEC and IEA country energy balances where available.
To make the downstream picture more complete, we also used company annual reports, audited financial statements, investor presentations, and credible press reporting to track refinery upgrades, utilization commentary, and product mix direction. In parallel, selective paid subscriptions for company financials, patents, and shipment level trade checks were used to cross-check timelines and remove outliers when a public series looked delayed or inconsistent. The desk sources listed here are illustrative, and many other public documents and datasets were also consulted for data collection, validation, and clarification.
Primary Interviews and Surveys
Primary discussions were used to convert public volume and capacity signals into realistic sell-through and pricing assumptions, especially when product mix and channel margins were not visible in public data. We spoke with downstream operators, distributors, logistics and storage participants, and large industrial buyers across Indonesia to validate utilization, import reliance, and how price controls and subsidies flow into realized revenues.
Inputs from these interviews were then used to test the model under different demand and price paths, so final totals did not depend on one single assumption set.
Distribution of primary research fieldwork respondents
| Company type | Respondent position |
|---|---|
| Top tier: 27% | CXOs: 13% |
| Mid tier: 56% | Functional/Unit leaders: 40% |
| Smaller Players: 17% | Managers: 47% |
Market-Sizing & Forecasting
Sizing starts with a top-down reconstruction of Indonesia downstream value where refinery throughput, product demand (in kiloliters or tons), and net import and export flows are translated into revenue using observed price bands and product mix splits. Where public series are reported at different lags, the sequence is aligned using the latest annual totals and then reconciled with near-term indicators.
Results are then corroborated using selective bottom-up approximations, such as sampled selling price times estimated volumes by major product groups and channel checks on distributor and retail markups, which are used to adjust totals when the first pass looks too high or too low. Key inputs considered include refinery capacity additions and downtime schedules, utilization rates, fuel consumption growth by sector, regulated price changes and subsidy intensity, crack spread direction, and the share of imports in meeting gasoline and diesel demand.
For forecasting, scenario analysis is used as the main technique because demand and pricing can shift quickly with policy, currency moves, and project execution. Assumptions for demand growth, utilization progression, and price pass-through are stress-tested with expert feedback, and gaps in bottom-up checks are handled through conservative ranges rather than forcing false precision.
Data Validation & Update Cycle
Validation is done through repeated cross-checks, where modeled revenues are compared against independent signals such as national product sales, refinery throughput trends, and import bills, and then reviewed for breaks that cannot be explained by policy or macro changes. When a variance is too large, the working assumptions are revisited, and respondents are re-contacted to confirm whether the change is structural or timing-related.
Before sign-off, the model goes through a multi-step analyst review so calculations, units, and currency conversions are consistent across years. Reports are refreshed annually, and interim updates are made when material events occur such as major refinery start-ups, policy shifts in pricing, or sharp demand shocks. Before delivery, a final pass is performed so clients receive the latest updated view available at that time.
Mordor Intelligence's Indonesia Oil and Gas Downstream Market Size Measured Against Other Published Estimates
Published market sizes for Indonesia oil and gas downstream often look far apart because the scope lines are drawn differently and the value being measured is not the same across sources. Differences commonly come from whether refining and petrochemical plant output is treated as the core, or whether broader fuel retail turnover and gas processing value are added on top.
In this study, the key gap drivers are product inclusion, channel coverage, and how prices are applied, since regulated price steps and subsidy mechanics can make realized revenues diverge from spot-linked assumptions. Some external totals also use aggressive growth paths for refinery expansions or apply a single average selling price across products, and then keep that price logic unchanged for longer update cycles, which makes the numbers drift from current market conditions.
Benchmark comparison
| Source | Market Size | Gaps in Research Methodology |
|---|---|---|
| Mordor Intelligence | USD 2.18 B (2025) | |
| Global Consultancy A | USD 60.58 B (2023) | Uses a much broader downstream definition that appears to fold in petroleum product distribution, marketing, and retail network turnover, which inflates value versus counting refining and petrochemical plant output as the main revenue pool. |
| Industry Research House B | USD 69.49 B (2025) | Emphasizes refining and integrated petrochemical investment value with a wider monetization approach to downstream activity, and the estimate is sensitive to assumed price pass-through and project ramp-up timing. |
The table shows that the widest spread comes from whether retail and marketing turnover is included and how product pricing is averaged across fuels and petrochemical outputs, and this narrower counting of downstream value is the choice applied by Mordor Intelligence.
Key Questions Answered in the Report
What is the projected value of the Indonesia oil and gas downstream market by 2031?
The market is forecast to reach USD 2.9 billion by 2031.
Which segment is expected to grow the fastest within Indonesia's downstream sector?
Petrochemical plants are projected to post the highest 6.55% CAGR through 2031.
How much refinery capacity is Indonesia targeting through its expansion program?
The government plans to add 1 million barrels per day across 16 locations by 2030.
What is driving retail fuel channel growth in Indonesia?
Pertamina’s station modernization, cashless payments, and rising vehicle ownership support a 6.32% CAGR in retail sales.
How is Indonesia addressing environmental pressures in downstream operations?
Projects now integrate carbon-capture technology and pursue Euro-4 fuel upgrades to align with Net Zero 2060 commitments.