
Market Overview
| Study Period | 2020 - 2031 |
|---|---|
| Forecast Data Period | 2026 - 2031 |
| Base Year Market Size (2025) | USD 40.97 Billion |
| Market Size (2026) | USD 48.39 Billion |
| Market Size (2031) | USD 98.87 Billion |
| Growth Rate (2026 - 2031) | 15.36 % |
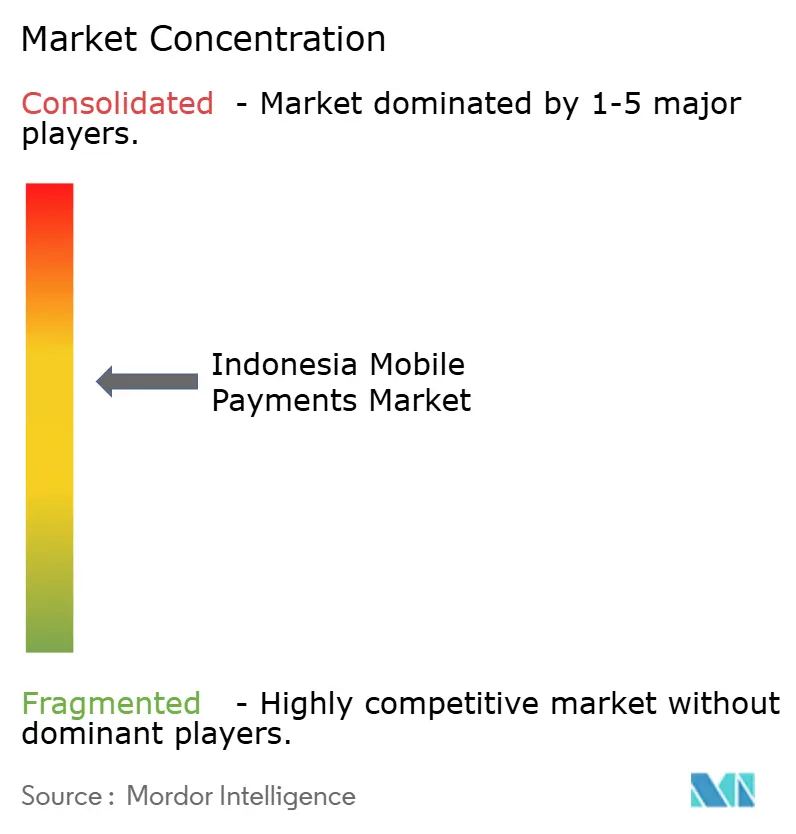
| Market Concentration | Medium |
Major Players *Disclaimer: Major Players sorted in no particular order Image © Mordor Intelligence. Reuse requires attribution under CC BY 4.0. | |
Indonesia Mobile Payments Market Analysis by Mordor Intelligence
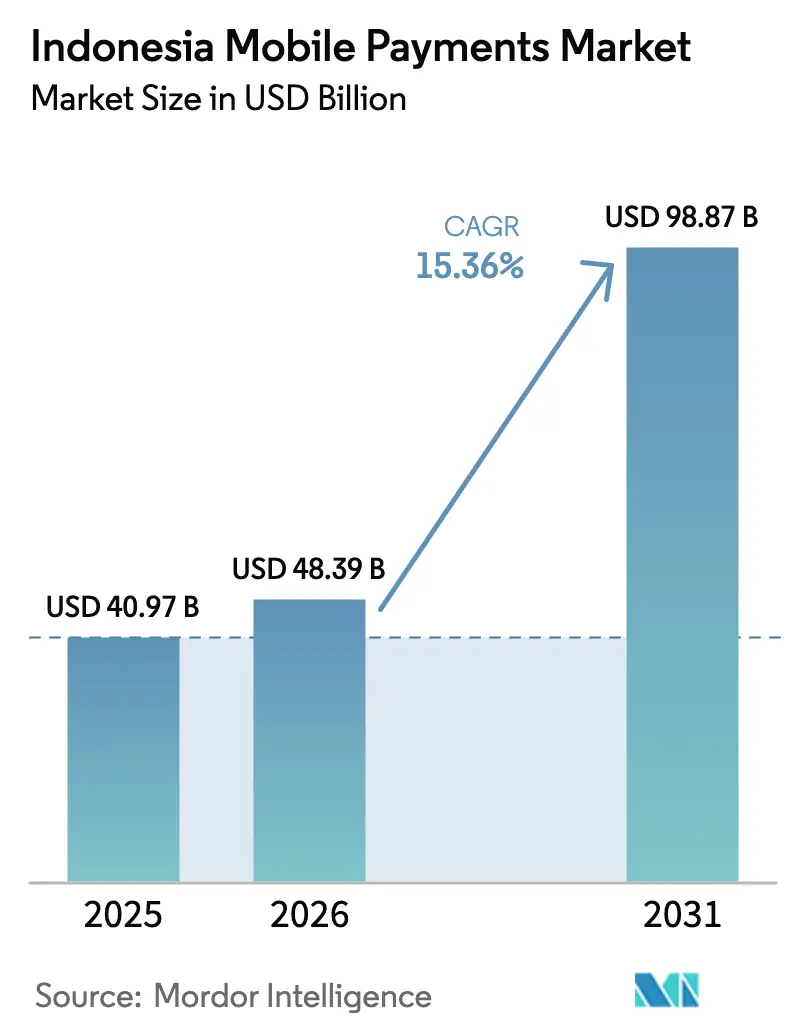
The Indonesia mobile payments market size is projected to expand from USD 40.97 billion in 2025 and USD 48.39 billion in 2026 to USD 98.87 billion by 2031, registering a CAGR of 15.36% between 2026-2031. Domestic QR code standardization, real-time transfer rails and super-app bundling are reinforcing a behavioral shift away from cash, while cross-border QR interoperability is opening new tourist-spend corridors. Competitive pressure is rising as wallet operators pivot from interchange fees to embedded lending, insurance and investments, a transition that makes proprietary data the primary source of differentiation. Government cashless mandates in public transportation and social-commerce adoption in tier-2 and tier-3 cities are widening the daily use case mix and accelerating merchant onboarding. Fraud mitigation and float-balance ceilings remain structural frictions, yet the continued decline in data costs and the completion of Palapa Ring fiber connectivity are gradually reducing rural acceptance barriers.
Key Report Takeaways
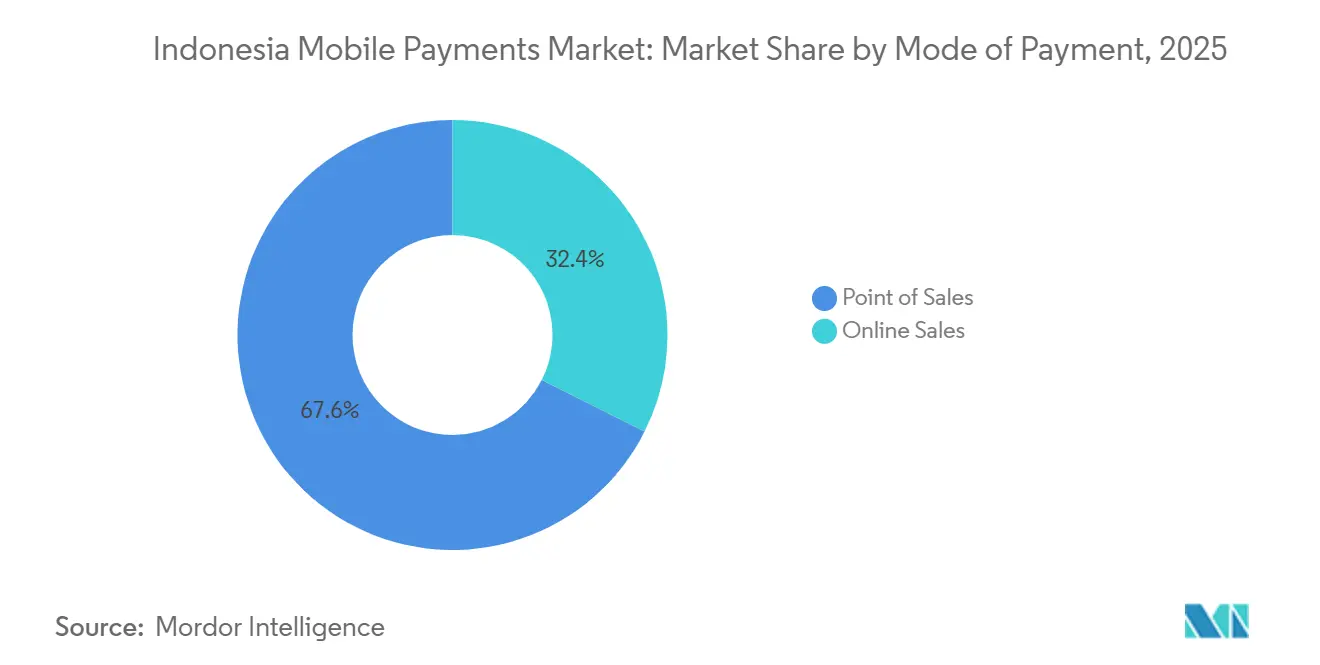
- By mode of payment, Point of Sales led with 67.59% of Indonesia mobile payments market share in 2025, while Online Sales is forecast to advance at a 17.43% CAGR through 2031
- By payment type, Other Payment Types commanded 48.67% share of the Indonesia mobile payments market size in 2025; QR-Based payments are expanding at a 16.24% CAGR over 2026-2031.
- By transaction type, Peer-to-Peer transactions dominated with 63.92% share in 2025, whereas Person to Business flows hold the fastest growth outlook at a 16.17% CAGR to 2031.
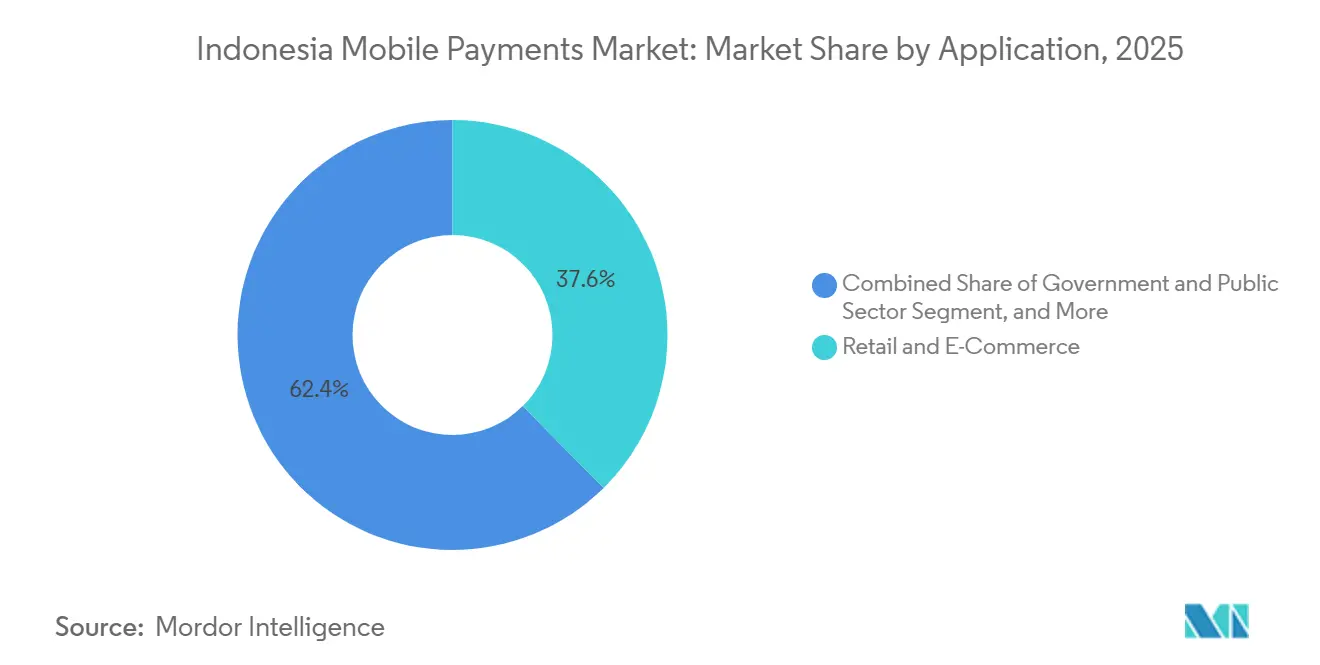
- By application, Retail and E-Commerce contributed 37.59% revenue share in 2025, yet Transportation and Logistics is projected to climb at an 18.56% CAGR through 2031.
Note: Market size and forecast figures in this report are generated using Mordor Intelligence’s proprietary estimation framework, updated with the latest available data and insights as of 2026.
Indonesia Mobile Payments Market Trends and Insights
Drivers Impact Analysis*
| Driver | (~) % Impact on CAGR Forecast | Geographic Relevance | Impact Timeline |
|---|---|---|---|
| Bank Indonesia’s Nationwide QRIS Mandate Accelerating Merchant On-Boarding | +3.8% | National, Java and Sumatra Focus | Short Term (≤ 2 Years) |
| Social-Commerce Boom in Tier-2/3 Cities Expanding Wallet GMV | +2.9% | Kalimantan, Sulawesi, Eastern Indonesia | Medium Term (2-4 Years) |
| Government Cashless Incentives in Public Transport (JakLingko) Driving Daily Use-Cases | +2.4% | Jakarta, Bandung, Surabaya | Medium Term (2-4 Years) |
| BI-FAST Real-Time Transfer Fee Reduction Stimulating Account-to-Wallet Payments | +2.1% | Urban Banking Corridors | Short Term (≤ 2 Years) |
| Rise of Embedded Finance in Indonesian Super-Apps Unlocking New Merchant Categories | +2.5% | Java Urban Centers, Outer Islands | Medium Term (2-4 Years) |
| Cross-Border QR Code Linkages with Malaysia and Singapore Boosting Inbound Tourist Spend | +1.7% | Bali, Jakarta, Batam | Long Term (≥ 4 Years) |
| Source: Mordor Intelligence | |||
Bank Indonesia’s Nationwide QRIS Mandate Accelerating Merchant On-Boarding
The zero-MDR policy for sub-IDR 500,000 (USD 29.7) transactions removed cost barriers for micro-merchants, adding 34.23 million new outlets and lifting quarterly QR volumes by 148.5% in 2025.[1] Standardized QR formats now let consumers pay with any wallet using a single scan, pushing providers to compete on loyalty perks and credit add-ons rather than exclusivity. Closed-loop operators are therefore leveraging transaction data to launch working-capital loans and inventory-planning dashboards that sit inside the payment flow, reinforcing stickiness among small retailers while offsetting lost interchange revenue.
Social-Commerce Boom in Tier-2/3 Cities Expanding Wallet GMV
Live-stream retail on Shopee Live and TikTok Shop created an impulse-buy channel in secondary cities where logistics costs once restrained e-commerce adoption. ShopeePay’s one-click integration cut cart abandonment by 28% in 2025, and social-commerce GMV in Makassar, Pontianak and Manado grew 62% year on year as buyers settled within the video feed instead of switching apps.[2] Relaxed KYC thresholds for low-ticket sellers lowered entry hurdles for informal entrepreneurs, fostering a fresh long-tail of merchants that feed recurring wallet inflows.
Government Cashless Incentives in Public Transport (JakLingko) Driving Daily Use-Cases
JakLingko’s cashless-only rule from January 2025 converted 3.2 million commuters into habitual wallet users, with ridership among digital payers up 35% six months after launch.[3] Bundling route planning, ticket purchase and real-time tracking inside GoPay, OVO and LinkAja apps removed the friction of reloadable tap cards. The model’s success in Jakarta catalyzed similar mandates in Surabaya and Bandung, embedding wallets into daily mobility and reinforcing payment frequency beyond discretionary shopping.
BI-FAST Real-Time Transfer Fee Reduction Stimulating Account-to-Wallet Payments
A flat IDR 2,500 (USD 0.16) fee democratized instant interbank transfers, driving BI-FAST volumes to 1.22 billion in Q3 2025. Users now prefer topping up wallets through mobile banking rather than paying higher convenience-store cash-deposit fees, while gig workers benefit from immediate earnings settlement. Banks have responded by embedding one-tap wallet reload buttons into digital apps, further tightening the linkage between traditional accounts and super-app ecosystems.
Restraints Impact Analysis*
| Restraint | (~) % Impact on CAGR Forecast | Geographic Relevance | Impact Timeline |
|---|---|---|---|
| Persisting OTP and Social-Engineering Fraud Undermining Consumer Trust | -2.3% | Urban Centers | Short Term (≤ 2 Years) |
| High MDR for Micro-Merchants Outside Subsidized Schemes | -1.8% | Rural and Peri-Urban Zones | Medium Term (2-4 Years) |
| Regulatory Ceiling on E-Money Float Balances Limiting Ticket Size | -1.4% | National | Medium Term (2-4 Years) |
| Low NFC-Enabled Smartphone Penetration in Rural Indonesia | -1.2% | Eastern Indonesia, Remote Kalimantan | Long Term (≥ 4 Years) |
| Source: Mordor Intelligence | |||
Persisting OTP and Social-Engineering Fraud Undermining Consumer Trust
Fraud losses reached IDR 7 trillion (USD 0.42 billion) between late 2024 and 2025, with OTP phishing and SIM-swap schemes representing 68% of cases.[4] Biometric logins and transaction velocity caps have reduced incident severity, but older users in tier-3 cities still favor cash due to fear of digital theft. OJK’s September 2024 mandate for real-time fraud monitoring adds compliance costs for wallets, though conviction rates below 12% continue to hinder deterrence.
High MDR for Micro-Merchants Outside Subsidized Schemes
Transactions above the subsidy threshold attract MDR fees up to 2.5%, eroding slim margins for rural motorcycle dealers and furniture sellers. A Lampung dealer highlighted that a 1.5% fee on a IDR 15 million (USD 0.89 thousand) scooter equates to three days of profit, prompting cash discounts to sidestep digital rails. Without tiered MDR relief or volume-based rebates, many high-ticket merchants opt to stay offline, capping rural penetration for the Indonesia mobile payments market.
*Our forecasts treat driver/restraint impacts as directional, not additive. The impact forecasts reflect baseline growth, mix effects, and variable interactions.
Segment Analysis
By Mode of Payment: Physical Retail Anchors Volume, Digital Channels Drive Value
Point of Sales accounted for 67.59% of 2025 volume, anchoring the Indonesia mobile payments market on in-store groceries, fuel and quick-service restaurants. QRIS’s zero-fee regime below IDR 500,000 lets small vendors accept wallets without margin sacrifice, preserving cashflow certainty. Online Sales, though smaller today, is forecast to compound at 17.43% as social-commerce embeds one-tap checkouts and subscription platforms scale video, software and cloud storage packages. The divergence signals that while brick-and-mortar will keep headline volume, digital channels will capture a larger slice of discretionary spending value over the forecast horizon, expanding total addressable reach for the Indonesia mobile payments market.
Physical retail also benefits from behavioral overlap: shoppers who scan a QR code to pay for groceries often top up their wallets via BI-FAST in the same session, closing a data loop that enables targeted promotions on their next store visit. Conversely, online users generate richer SKU-level insights, letting marketplaces bundle pay-later offers and loyalty cashbacks that lift average order value. Together, the two channels reinforce a blended payment habit, cushioning seasonality shocks and widening reachable GMV for the Indonesia mobile payments industry.
By Payment Type: QR Codes Democratize Access, NFC Awaits Infrastructure
Legacy text-based options such as USSD and SMS held 48.67% share in 2025, reflecting continued feature-phone usage and consumer preference for visible confirmation messages. However, QR-Based flows are on track for a 16.24% CAGR, energized by QRIS interoperability and bilateral links that let Malaysian and Singaporean tourists pay Indonesian merchants in native wallets. The simplicity of printed codes, costing a fraction of NFC terminals, keeps merchant capex minimal and accelerates rural rollout.
NFC lags because sub-USD 125 devices lack chipsets, and merchants resist buying dedicated readers when QR achieves network ubiquity. Yet as handset prices fall and mass-market Android models add NFC modules, tap-to-pay could emerge for transit gates and high-footfall retail, particularly where speed trumps camera alignment. Over the forecast period, QR will remain the universal denominator, but NFC may carve premium urban niches, nudging blended acceptance that further enlarges the Indonesia mobile payments market.
By Transaction Type: P2P Dominates Volume, P2B Captures Commercial Growth
Peer-to-Peer transfers held 63.92% share in 2025, underscoring cultural norms of mutual assistance and the convenience of splitting bills instantly. Low float-balance ceilings keep ticket sizes modest, yet high frequency sustains engagement and generates behavioral data for credit scoring. Person to Business transactions, growing at 16.17% CAGR, ride on public-sector mandates and merchant QR absorption. As P2B volumes scale, wallets can monetize through merchant analytics dashboards, inventory financing and targeted advertising, enriching revenue streams while deepening the Indonesia mobile payments market’s commercial relevance.
The social quotient of P2P also seeds network effects: users who receive transfers are nudged to leave balances in-app for future purchases, creating an internal liquidity loop that lowers wallet providers’ funding costs. In turn, providers channel float balances into money-market instruments within regulatory caps, subsidizing rewards that attract still more users, a virtuous cycle strengthening wallet defensibility in the Indonesia mobile payments market.
By Application: Retail Leads Today, Transport Shapes Tomorrow
Retail and E-Commerce contributed 37.59% of 2025 market value, buoyed by convenience stores and online marketplaces integrating cashback and loyalty engines. Transportation and Logistics is the breakout vertical, projected at an 18.56% CAGR as ride-hailing, courier and public-transit platforms embed fare collection, route guidance and surge pricing within payment layers. Wallets gain daily stickiness through multi-modal commutes, while couriers leverage instant payouts to retain riders, creating intertwined supply-and-demand incentives that enlarge throughput for the Indonesia mobile payments market size.
Beyond these anchors, hospitality, education and healthcare are integrating QR invoicing to ease reconciliation, while government portals accept wallets for taxes and permits, widening everyday relevance. Each incremental use case nudges cash-first users toward digital familiarity, gradually lifting the Indonesia mobile payments market penetration curve even in cash-entrenched rural segments.

Geography Analysis
Java generated roughly 60% of 2025 transaction volume, powered by 145 million residents, dense banking networks and smartphone penetration above 75% among 18-45-year-olds. Sumatra ranks second, buoyed by remittances and cross-border trade that normalize digital settlement with Malaysia and Singapore. Kalimantan, Sulawesi and Papua lag due to patchy 4G and merchant density below 40% outside capitals, but Palapa Ring backhaul is closing the gap, enabling wallets to deploy QR kits through post-office agents that onboarded 1.8 million rural merchants in 2025.
Jakarta remains the innovation flywheel, hosting 38% of fintech startups and 52% of VC allocation. Pilots such as JakLingko’s cashless transit debut in the capital before replicating in Surabaya, Bandung and Medan, accelerating spillover diffusion. Eastern islands face cultural inertia favoring face-to-face transactions, yet digital remittances from urban migrant workers are injecting liquidity and demonstrating convenience, gradually eroding cash primacy.
Tourist destinations illustrate cross-border potential: Bali merchants processed 18% of tourist-facing volume via Alipay+ and WeChat Pay in 2025, bypassing currency exchange and batching delays. Batam and Bintan leveraged Singaporean day-tripper flows to pilot QRIS acceptance for GrabPay and Touch ’n Go, handling USD 47 million in the first half of 2025. These corridors validate ASEAN’s regional QR blueprint, scheduled to add Thailand, Vietnam and the Philippines by 2027, a development set to expand inbound GMV and cement Indonesia’s leadership in the wider Southeast Asian payment stack.
Uniform consumer-protection rules mandate receipts, 14-day dispute windows and IDR 500,000 (USD 29.7) liability caps, yet enforcement varies outside Java where regulator field units are thin. Inconsistent oversight enables occasional rogue operators to offer low-fee wallets without deposit insurance, posing trust risks that hamper adoption in remote zones. Nevertheless, digital remittances saved households USD 280 million in fees during 2025, capital redirected to education and healthcare, underscoring tangible welfare gains and bolstering the inclusive growth narrative for the Indonesia mobile payments market.
Regulatory Landscape
Bank Indonesia (BI) and Otoritas Jasa Keuangan (OJK) shape Indonesia's mobile payments ecosystem through licensing, interoperability rules, and consumer protection. A major framework shift took effect on 31 March 2026, when BI Regulation No. 10 of 2025 and related implementing rules (including PADG 32/2025) became effective. The rules introduced the TIKMI assessment (Transactions, Interconnections, Competence, Risk Management, and IT Infrastructure) to classify payment system providers and align permitted activities and cooperation arrangements with BI-approved business plans, with the first SBP and RBSP submissions due by 30 April 2026.
For day-to-day product governance, QRIS remains the mandated national QR standard under BI, with updates expanding capabilities such as data-based messaging technologies and additional funding sources. BI-FAST continues as the national real-time retail transfer rail under BI's payment-system governance. On the credit overlay, OJK's POJK 32/2025 formalized BNPL licensing and conduct requirements after its 15 December 2025 promulgation. OJK also took over regulation of digital financial assets and crypto activities via POJK 27/2024 and its amendment POJK 23/2025, which reshapes how wallets, fintechs, and affiliated platforms structure any token-linked payment or investment adjacencies.
Value Chain Analysis
Indonesia's mobile payments value chain is built on BI-led standards and national rails, then executed through banks, wallets, processors, and merchant distribution networks. At the infrastructure layer, QRIS supports interoperable merchant acceptance, while BI-FAST provides real-time retail clearing and settlement for account-to-wallet and bank transfers. API interoperability initiatives such as SNAP also help standardize integration. Under the BI payment-system framework effective from 31 March 2026, participants need to demonstrate capability and risk readiness under TIKMI, so compliance and technology controls become core operating inputs at scale.
On the service layer, licensed banks (including BCA, Mandiri, BNI, and BRI) and non-bank wallets (GoPay, OVO, DANA, ShopeePay, and LinkAja) acquire users, manage KYC and risk controls, and run in-app journeys such as P2P, P2B, bill pay, and transit. Acquirers, gateways, and aggregators like Midtrans and Xendit connect online merchants and long-tail sellers to QRIS and wallet acceptance, while last-mile onboarding is handled through field agents, marketplaces, and super-app ecosystems that bundle loyalty and embedded-finance offers. Key frictions cluster around MDR sensitivity for higher-ticket micro-merchants, fraud controls, and the operational challenge of aligning partnerships and product rollouts with BI-approved business plans.
Competitive Landscape
The Indonesia mobile payments market is moderately fragmented; the top five, GoPay, OVO, ShopeePay, DANA and LinkAja, controlled about 70% share in 2025, but no single wallet exceeds 25%. Super-apps harvest captive user bases from ride-hailing and e-commerce to cross-sell credit, insurance and mutual funds, moving revenue reliance from interchange to embedded finance. GoPay’s 2024 tie-in with Mandiri Livin’ gives customers savings yields and overdraft lines while granting Mandiri exposure to 50 million Gojek users, a template emulated by ShopeePay’s linkage with SeaBank and DANA’s marketplace integrations.
PayLater specialists Kredivo and Akulaku target thin-file millennials with BNPL at checkout, yet portfolio resilience is untested against macro slowdown. Meanwhile, bank-led wallets from BCA, BRI and Mandiri compete on deposit insurance and higher transaction ceilings, appealing to affluent users constrained by e-money float caps. Foreign entrants Alipay+ and WeChat Pay build tourist beachheads before teaming with local partners for domestic acceptance, adding cross-border cachet and pressuring incumbents to match UX polish.
Regulatory sandboxes allow year-long pilots in blockchain settlements and AI fraud scorers, speeding iteration but also injecting compliance uncertainty for graduates seeking full licenses. Technology bifurcation persists: Jakarta pilots biometric logins and tokenization, whereas tier-3 cities lean on QR simplicity and SMS receipts. Rural merchant acceptance remains the largest white space, with wallets and banks racing to deploy low-cost QR kits that bring micro-retail into the Indonesia mobile payments market fold.
Indonesia Mobile Payments Industry Leaders
-
PT Dompet Karya Anak Bangsa (GoPay)
-
PT Espay Debit Indonesia Koe (DANA)
-
PT Nusa Satu Inti Artha (DOKU)
-
PT Fintek Karya Nusantara (LinkAja)
-
PT Veritra Sentosa Internasional (PayTren)
- *Disclaimer: Major Players sorted in no particular order
Market Opportunities and Future Outlook
Interoperable cross-border QR acceptance is a visible whitespace for higher-frequency wallet usage in tourist and cross-border trade corridors, supported by BI-led bilateral linkages. In April 2026, Indonesia and South Korea launched a QR cross-border payment linkage for direct local currency settlement, and in June 2026 the two-way cross-border QR payment service between Indonesia and China became fully operational. Together, these linkages expand addressable inbound and outbound spend beyond domestic QRIS use.
Domestically, the opportunity is centered on scaling higher-trust, higher-value payment journeys on top of national rails as BI moves the ecosystem from basic digitization toward resilience and data infrastructure under the Payment System Blueprint (BSPI) 2030. With QRIS reaching 60.77 million users as of February 2026, and a 2026 regulatory push for tools such as BI-Payment Clear and BI-Payment Info, providers have room to differentiate through fraud reduction, improved dispute handling, and compliant data-driven services. Merchant analytics and embedded finance are key examples, and they must fit within BI's TIKMI-based activity governance and OJK's BNPL licensing perimeter under POJK 32/2025.
Recent Industry Developments
- June 2026: Bank Indonesia and partners enabled the two-way cross-border QR payment service between Indonesia and China to become fully operational. The change broadens QRIS-linked acceptance for travelers and cross-border commerce flows, giving wallet operators and acquirers a larger pool of QR transactions that do not rely only on domestic spend cycles.
- December 2025: OJK issued POJK 32/2025 to formalize licensing and conduct requirements for Buy Now Pay Later (BNPL) services. This tightened compliance expectations for pay-later offerings embedded in super-apps and checkouts, while clarifying the ruleset for banks and non-banks that distribute BNPL at scale.
- September 2024: OJK introduced a mandate for real-time fraud monitoring for digital payment activity. The requirement raised the operational bar for wallets and payment providers by accelerating investment into monitoring, alerting, and incident response capabilities amid rising OTP and social-engineering fraud.
Research Methodology Framework and Report Scope
Market Definition and Coverage
For this report, the Indonesia mobile payments market is measured as the value of payment transactions completed using a mobile device, across consumer and business use cases, within Indonesia during the study period.
Scope exclusions: We exclude cash payments, pure card-present payments without a mobile initiation step, and non-payment mobile financial services such as lending or insurance.
Segmentation Overview
- By Mode of Payment
- Point of Sales
- Online Sales
- By Payment Type
- NFC
- QR-Based
- Other Payment Types
- By Transaction Type
- Peer-to-Peer (P2P)
- Person to Business
- By Application
- Retail and e-Commerce
- Transportation and Logistics
- Hospitality and Food-Service
- Government and Public Sector
- Other Applications (Education, Healthcare)
Data Sources, Market Sizing, and Validation
Desk Research
Desk research helped us anchor the market model to real transaction signals and local payment rails. We reviewed public statistics and policy publications such as Bank Indonesia releases (including e-money and QRIS indicators), Financial Services Authority (OJK) disclosures, and Statistics Indonesia (BPS) macro series that influence consumption and digital adoption.
To avoid building the model only on one data stream, we also used sources such as the World Bank and IMF for currency and macro assumptions, as well as company filings, investor decks, association updates, and reputable press coverage for go-to-market and pricing cues. In a few places, paid subscriptions for company financials and news intelligence, import-export shipment-level checks where relevant for device-linked payment acceptance, and patent database scans were used to validate timelines and product direction. These source examples are illustrative and not exhaustive, and many other public references were used for data collection, validation, and clarification.
Primary Interviews and Surveys
Primary work focused on aligning transaction value build-ups with what issuers, payment facilitators, merchant-facing teams, and ecosystem experts see in day-to-day volumes. We used interviews and structured surveys to pressure-test assumptions on QR-based usage, in-app checkout behavior, and P2P versus person-to-business mix, and then we revisited outliers until the input ranges made sense for Indonesia.
Distribution of primary research fieldwork respondents
| Company type | Respondent position |
|---|---|
| Top tier: 29% | CXOs: 14% |
| Mid tier: 50% | Functional/Unit leaders: 29% |
| Smaller Players: 21% | Managers: 57% |
Market-Sizing & Forecasting
Sizing starts with a top-down reconstruction of mobile payment value by mapping Indonesia payment rails and usage patterns to addressable transaction pools, and then rolling them forward using adoption and activity indicators. The totals are cross-checked with selective bottom-up approximations, where sampled transaction volumes and typical take-rates, along with channel checks on merchant acceptance, help confirm the direction and keep the model realistic.
Inputs used in the model include the pace of QR-based payments versus NFC and other modes, the split between point-of-sale and online sales, shifts in P2P versus person-to-business usage, and spend intensity by application areas such as retail and e-commerce, transportation and logistics, and hospitality and food-service. We also track exchange-rate movement and inflation to keep nominal value changes from being mistaken for true adoption changes.
For forecasting, scenario analysis is used because policy milestones, merchant acceptance ramp, and consumer behavior can change quickly, and experts often describe the future in ranges rather than one straight line. Where bottom-up data is thin (for example in smaller merchant categories), we fill gaps using proxy penetration rates and conservative activity assumptions, and then we re-check the implied averages against interview feedback.
Data Validation & Update Cycle
Outputs are validated through multiple checks, including internal consistency tests across modes, transaction types, and applications, followed by variance checks against independent payment activity signals. When a metric looks off, we trace it back to the assumption level and re-contact relevant participants to confirm whether the change is real or caused by timing, reporting, or currency effects.
Before sign-off, the model and narrative go through multi-step analyst review so that definitions, math, and assumptions remain aligned. Reports refresh annually, and interim updates are made when material events occur, such as rule changes, major ecosystem shifts, or visible swings in payment activity. Right before delivery, a final pass is completed so clients receive the most current view possible.
Mordor Intelligence's Indonesia Mobile Payments Market Size Versus Other Published Estimates
Published market numbers for Indonesia mobile payments often vary because each study chooses a different boundary for what counts as a mobile payment, and then applies its own currency and timing rules. Differences also show up when some estimates emphasize only wallet value, while others reflect broader transaction value that includes QR-based payments across many apps.
A practical gap driver is refresh cadence and currency timing, since fast-moving monthly transaction trends and FX swings can shift the USD view even when local-currency activity is steady, and the refresh-led check process used by Mordor Intelligence keeps assumptions like average transaction size and mode mix aligned to the latest validated signals.
Benchmark comparison
| Source | Market Size | Gaps in Research Methodology |
|---|---|---|
| Mordor Intelligence | USD 40.97 B (2025) | |
| Trade Journal A | USD 538.00 B (2025) | Often reported as total digital payments GTV across the economy, which can include non-mobile channels and broader instruments beyond the mobile payment definition, and it may apply different FX conversion timing. |
| Regional Research Note B | USD 4.69 B (2023) | Typically focuses on a narrower slice such as wallet revenues or a limited set of mobile payment types, which can undercount QR-based and in-app checkout flows captured in transaction-value models. |
The spread across sources mainly comes down to what is being counted, whether it is broad digital payment value, a narrow wallet subset, or mobile payment transaction value with clear mode and use-case rules. By keeping the scope tied to defined mobile-initiated transactions, and by re-checking FX timing and implied averages during updates, the final number stays traceable to inputs that can be reviewed and repeated.
Key Questions Answered in the Report
How fast is digital payment value growing in Indonesia?
The Indonesia payments infrastructure market is projected to expand at a 9.83% CAGR from 2026 to 2031, rising from USD 127.32 billion in 2026 to USD 203.47 billion by 2031.
Which payment instrument is gaining share quickest?
E-money, propelled by super-app wallets and QRIS acceptance, is increasing at an 11.21% CAGR, outpacing card-based options.
Why do merchants prefer QRIS to traditional cards?
QRIS carries merchant discount rates below 0.7% and settles within 24 hours, whereas card interchange often exceeds 1.5% and clears on a T+2 cycle.
What role does BI-FAST play in corporate disbursements?
The real-time rail's flat IDR 2,500 (USD 0.15) fee and sub-second settlement are pushing payroll and supplier payments away from expensive RTGS channels.
Which vertical shows the fastest digital-payment growth?
Transportation and mobility leads with an 11.02% CAGR, driven by ride-hailing and delivery apps embedding closed-loop wallets.
How fragmented is the competitive landscape today?
Five super-app or API-gateway leaders process about 60% of wallet volume, giving the market a moderate concentration score of 6.