
Market Overview
| Study Period | 2020 - 2031 |
|---|---|
| Forecast Data Period | 2026 - 2031 |
| Base Year Market Size (2025) | USD 12.86 Billion |
| Market Size (2026) | USD 13.59 Billion |
| Market Size (2031) | USD 17.78 Billion |
| Growth Rate (2026 - 2031) | 5.52% CAGR |
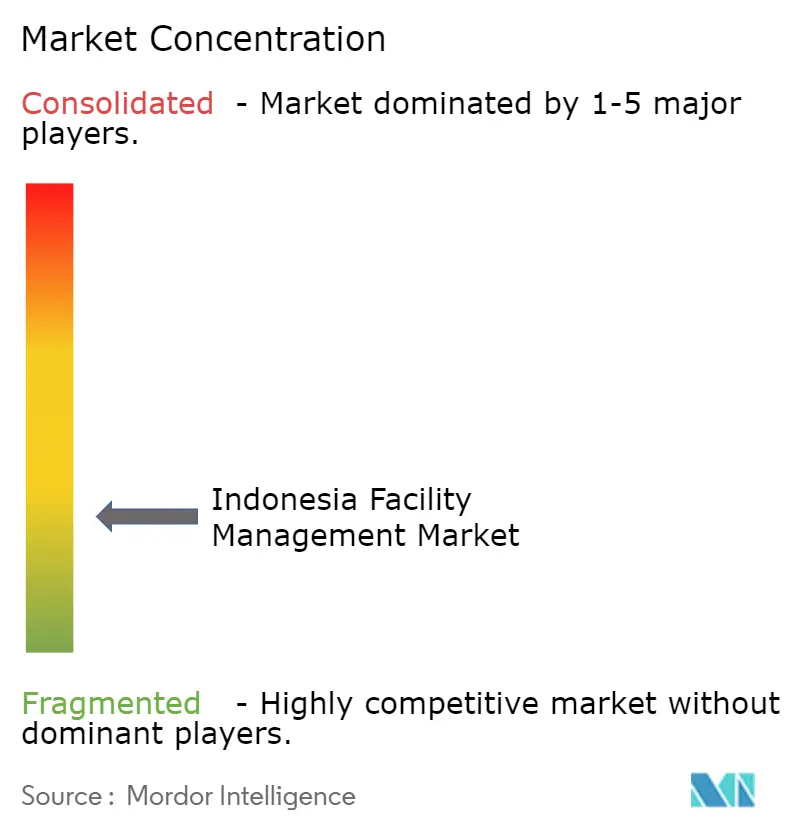
| Market Concentration | Low |
Major Players *Disclaimer: Major Players sorted in no particular order Image © Mordor Intelligence. Reuse requires attribution under CC BY 4.0. | |
Indonesia Facility Management Market Analysis by Mordor Intelligence
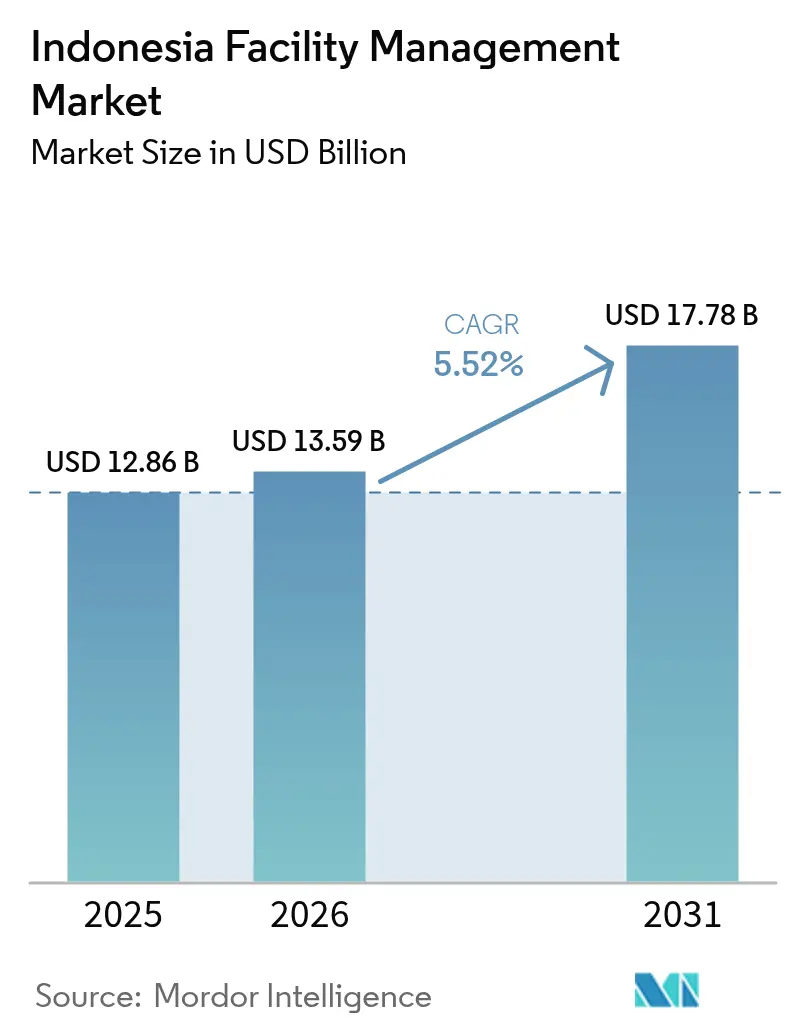
The Indonesia facility management market size is expected to increase from USD 12.86 billion in 2025 to USD 13.59 billion in 2026 and reach USD 17.78 billion by 2031, growing at a CAGR of 5.52% over 2026-2031. Jakarta’s shift from ad-hoc maintenance contracts to outcome-based service models, backed by availability-based payment terms that reward uptime and energy savings, is redefining value propositions for vendors. An infrastructure budget of USD 25.5 billion for 2025 is channeling recurring facility management demand into toll roads, mass-transit hubs and industrial estates. Multinational occupiers continue to favor ISO 41001-compliant integrated providers, while domestic specialists defend niche verticals such as hospitals and airports. Wage inflation for certified HVAC and fire-safety technicians remains the primary cost headwind, yet ESG-linked loans that offer interest-rate discounts for green-certified assets are enlarging budgets for energy-efficient retrofits and predictive maintenance.
Key Report Takeaways
- By service type, hard services led with 58.42% of the Indonesia facility management market share in 2025; soft services are projected to expand at a 5.87% CAGR through 2031.
- By offering type, in-house delivery accounted for 57.36% of the Indonesia facility management market size in 2025, while outsourced integrated models are advancing at a 5.73% CAGR to 2031.
- By end-user industry, commercial facilities captured 38.67% of revenue in 2025, whereas industrial and process sites are forecast to grow at 6.12% through 2031.
Note: Market size and forecast figures in this report are generated using Mordor Intelligence’s proprietary estimation framework, updated with the latest available data and insights as of 2026.
Indonesia Facility Management Market Trends and Insights
Drivers Impact Analysis*
| Driver | (~) % Impact On CAGR Forecast | Geographic Relevance | Impact Timeline |
|---|---|---|---|
| Surge In ESG-Linked Financing Favoring Green-Certified Facilities | +1.2% | National, Concentrated In Jakarta, Surabaya, Bandung | Medium Term (2–4 Years) |
| Urbanization In Major Metros | +1.1% | Greater Jakarta, Surabaya, Bandung, Medan, Makassar | Long Term (≥ 4 Years) |
| Infrastructure Pipeline Investment | +1.0% | National, Priority Corridors In Java, Sumatra, Kalimantan | Medium Term (2–4 Years) |
| Proliferation Of Mixed-Use Mega-Developments In Secondary Cities | +0.9% | Surabaya, Bandung, Semarang, Medan | Medium Term (2–4 Years) |
| Rising Occupancy Optimization | +0.7% | National, Led By Jakarta CBD And Industrial Estates | Short Term (≤ 2 Years) |
| Labor And Safety Regulation | +0.6% | National, Enforced By Ministry Of Manpower | Short Term (≤ 2 Years) |
| Source: Mordor Intelligence | |||
Surge In ESG-Linked Financing Favoring Green-Certified Facilities
Indonesia’s commercial banks tied USD 4.8 billion of real-estate loans to EDGE, LEED or GREENSHIP ratings in 2025, lowering borrowing costs by up to 60 basis points. Developers used the savings to fund HVAC retrofits, LED relamping and water-recycling projects that require vendors capable of documenting carbon and energy metrics for quarterly audits. Certified floor space reached 11 million m² across 385 projects, with 62% located outside Jakarta, demonstrating how secondary-city landlords employ green credentials to court multinational tenants.[1]Green Building Council Indonesia, “Certified Projects Database 2025,” gbcindonesia.org
Urbanization In Major Metros
Greater Jakarta’s density climbed to 15,342 residents per km² in 2025, accelerating vertical mixed-use towers that stack offices, hotels and residences within a single footprint. Each property depends on integrated facility management to synchronize disparate service-level agreements, driving bundled contracts that replace fragmented vendor rosters. Surabaya’s Pakuwon Mall expansion alone added 120,000 m² of leasable space, supported by a district-cooling plant that trimmed operating costs by 19% relative to standalone chillers.[2]Statistics Indonesia, “Urban Population and Density Statistics 2025,” bps.go.id
Infrastructure Pipeline Investment
The 2025 state budget directs USD 25.5 billion toward toll roads, ports and industrial estates, many of which require 10-15-year facility management concessions anchored in ISO 55000 asset-management standards. Patimban Deep Sea Port awarded a 12-year integrated package for cargo equipment upkeep, perimeter security and hazardous-material compliance, illustrating how long-dated agreements create annuity-like cash flows for service providers.[3]Angkasa Pura Supports, “Facility Management Services Portfolio,” angkasapurasupports.co.id
Proliferation Of Mixed-Use Mega-Developments In Secondary Cities
Surabaya, Bandung and Semarang launched 27 projects exceeding 50,000 m² between 2024-2025, decentralizing demand away from Jakarta. Integrated providers now manage cleaning, security and HVAC zoning across office, hospitality and retail podiums under single contracts that consolidate as many as 14 legacy vendors. Labor costs in these cities run 22% below Jakarta, but shortages of technicians certified in advanced fire-alarm and chiller optimization require apprenticeship programs with local polytechnics.
Restraints Impact Analysis*
| Restraint | (~) % Impact on CAGR Forecast | Geographic Relevance | Impact Timeline |
|---|---|---|---|
| Margin Pressure on Leading Firms | -0.8% | National, Acute in Jakarta and Industrial Zones | Short Term (≤ 2 Years) |
| Skilled Labor Shortages | -0.7% | National, Severe in HVAC and Fire-Safety Trades | Medium Term (2–4 Years) |
| Dependency on Imported Building Automation Hardware | -0.4% | National, Influencing Smart-Building Deployments | Medium Term (2–4 Years) |
| Fragmented Provincial Regulatory Oversight | -0.3% | Multi-Province Operators, Mainly Java and Sumatra | Long Term (≥ 4 Years) |
| Source: Mordor Intelligence | |||
Margin Pressure on Leading Firms
Average wages for skilled technicians rose 14% in 2025 as automotive and electronics plants absorbed technical labor, compressing operating margins at major vendors to 4.2% from 5.8% a year earlier. Minimum-wage hikes of up to 9% in Jakarta further squeezed profitability, prompting smaller operators to exit low-margin cleaning and security contracts. Integrated providers countered by cross-subsidizing soft services with higher-margin MEP maintenance and energy-management offerings.[4]Ministry of Manpower, “Decree KEP-226/2024 on Minimum Wages,” kemnaker.go.id
Skilled Labour Shortages
Vocational institutes produced 38,000 facility management graduates in 2025 against industry demand for 62,000, leaving a 24,000-person gap concentrated in HVAC troubleshooting, fire-alarm programming and BAS integration. Contract penalties for unfilled technician posts averaged 2% of monthly fees, forcing providers to recruit retired military personnel and sponsor dual-certification courses that combine technical training with English proficiency.
*Our forecasts treat driver/restraint impacts as directional, not additive. The impact forecasts reflect baseline growth, mix effects, and variable interactions.
Segment Analysis
By Service Type: Hard Services Anchor Revenue, Soft Services Accelerate
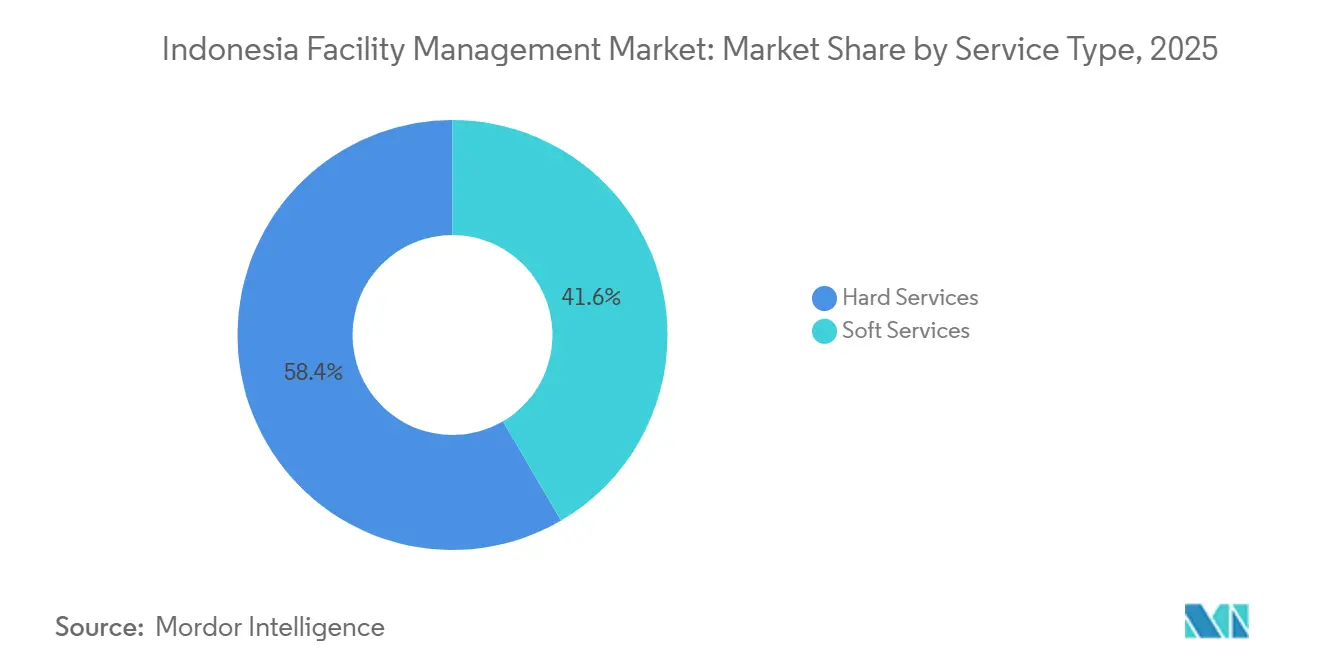
Hard services contributed 58.42% of revenue in 2025, reflecting ongoing demand for MEP, HVAC and fire-safety work that must comply with SNI 03-3989 standards. The Indonesia facility management market size for soft services is set to expand faster at 5.87% through 2031 as mixed-use towers outsource cleaning, security and catering. Growth is amplified in Surabaya and Bandung, where recent mega-developments require mechanized cleaning systems and certified security guards.
Asset-management solutions linked to ISO 55000 computerized systems now underpin factories in Cikarang and Karawang, cutting unplanned downtime by 23%. Meanwhile, fire-safety services advanced 6.1% in 2025 after regulators mandated biannual drills for high-rise buildings, creating predictable inspection and training revenue. Robotic scrubbers deployed by one multinational reduced labor hours 34%, demonstrating how technology offsets wage inflation.


By Offering Type: Outsourced Models Gain as Complexity Rises
In-house management maintained 57.36% share in 2025, favored by ministries and family-owned conglomerates that value direct oversight. Integrated outsourced contracts, however, are advancing at 5.73% as multinationals seek single-point accountability backed by ISO 41001 certification. Bundled contracts already represent 19% of outsourced spend, appealing to landlords that want cost transparency without relinquishing critical system control.
Integrated agreements increasingly peg 30% of fees to uptime and energy-saving targets, aligning provider incentives with tenant satisfaction. A recent airport concession granted a 10-year term contingent on achieving 99.5% HVAC uptime and 15% energy savings against 2023 baselines. Such outcome-based models position technology-enabled vendors for outsized share gains as service complexity rises.
By End-User Industry: Industrial Segment Surges On EV Investments
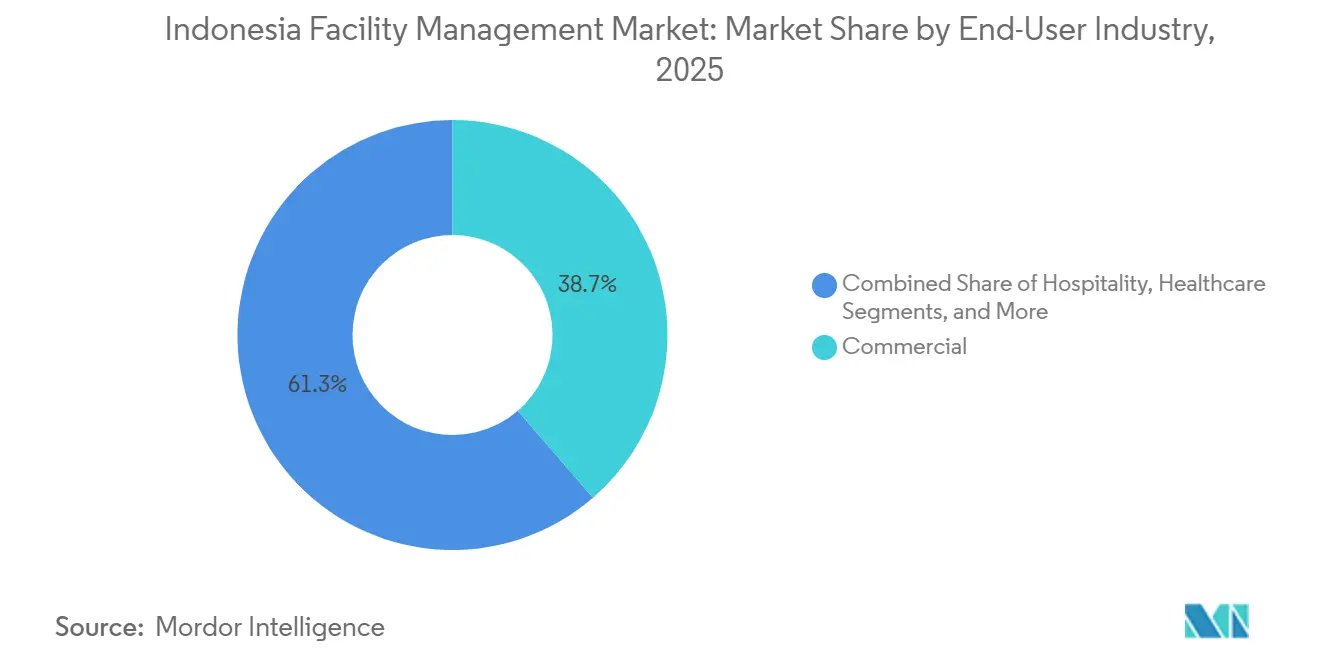
Commercial buildings generated 38.67% of revenue in 2025, underpinned by Jakarta’s Grade-A office stock where facility spending averages USD 4.20 per m² per month. Industrial facilities linked to electric-vehicle supply chains are projected to expand at 6.12%, the fastest across end-users, as battery and cathode plants in Karawang and Subang demand cleanroom environments and predictive maintenance for lithium-processing equipment.
Hospitality rebounded to 87% of pre-pandemic spending in 2025 but faces margin squeeze because long-term contracts cap price escalations below wage growth. Healthcare remains a high-potential niche thanks to infection-control requirements that few providers can meet, evidenced by a 5-year network contract that cut hospital-acquired infections by 29% through UV-C disinfection and HEPA-filtered HVAC.

Geography Analysis
Java accounted for 68% of national revenue in 2025, anchored by Greater Jakarta’s 23.4 million m² of professionally managed office and retail space. West Java’s manufacturing corridor attracted USD 18.3 billion of investments during 2024-2025, driving mandatory ISO 14001 and ISO 45001 certifications for facility service bids. East Java’s logistics and mixed-use clusters grew spending 8.2%, beating the national average.
Sumatra expanded 6.7% as Medan’s new offices and Palembang’s sports complexes outsourced multi-year security and MEP contracts, although differing provincial fire-audit cycles inflate compliance costs. Kalimantan and Sulawesi captured only 9% of revenue, yet the emerging Nusantara capital project is forecast to require USD 1.2 billion of cumulative services through 2035, promising scale opportunities for early entrants. Bali’s hospitality-centric market has already recovered to 92% of 2019 spending, with resort operators prioritizing solar-thermal water heating and organic-waste composting to secure green credentials.
Government policy is redirecting 31% of a IDR 387 trillion infrastructure budget toward regions outside Java, funding toll roads in Sumatra, ports in Kalimantan and airports in Papua. Regional tenders now favor bidders that hire at least 90% local staff, enabling domestic mid-tier players to undercut multinationals on labor costs. A new decree that all government buildings above 5,000 m² achieve minimum EDGE certification further boosts demand for vendors with IoT sensors and cloud analytics that monitor energy and water performance in real time.
Regulatory Landscape
Facility management operations in Indonesia are shaped by Ministry of Public Works and Housing (PUPR) rules for building operation and technical compliance, alongside labor and safety enforcement by the Ministry of Manpower. The Smart Building framework under Permen PUPR No 10/2023 sets requirements for building management systems (BMS) and integrated monitoring of mechanical, electrical, and security infrastructure, supporting demand for providers that can run automated controls and document performance in line with green-building and safety obligations.
State-asset and public-facility oversight has tightened through rules aimed at standardizing maintenance and reporting practices across government portfolios. Permen PUPR No 6 of 2025, implemented through the OSS (Online Single Submission) risk-based licensing approach in early 2026, and Permen PUPR No 4 of 2026 on management of state-owned assets (BMN) increase the importance of structured maintenance records, auditable work orders, and reporting discipline for contractors serving ministries and public assets. GR 34/2025 also reinforces standardized valuation, accounting, and reporting for state-owned assets under Danantara-linked governance. For digital facilities, compliance extends into the Ministry of Communication and Digital Affairs (MOCDA) domain through electronic system governance and registrations, adding an additional layer of operational controls for data centers and connected infrastructure estates.
Value Chain Analysis
Demand comes from commercial real estate owners and occupiers, industrial estates, public infrastructure operators, and digital infrastructure platforms (data centers and fiber networks) that require high-uptime operations. Contracting typically moves from asset owners and government entities to lead FM integrators (integrated or bundled models), and then to specialist subcontractors for MEP/HVAC, fire systems, security guarding, cleaning, landscaping, pest control, and waste handling. Outcome-based SLAs and availability-linked payment terms are pushing integrators to strengthen performance management, technician scheduling, and compliance documentation.
Upstream inputs include labor (certified HVAC, fire-safety, and BAS technicians), OEM equipment and spare parts (chillers, fire panels, BMS controllers, sensors), and FM software (CMMS, energy analytics, reporting tools). Technology partners and infrastructure developers are increasingly part of delivery, as shown by smart-estate command centers such as PT Samakta Mitra and NEC Indonesia at Kota Deltamas, integrating IoT and AI monitoring across utilities and facilities. Digital infrastructure expansion is also contributing, with Digital Realty and Bersama Digital Infrastructure Asia forming a 50/50 JV to develop and operate data centers in Indonesia. Skilled labor availability and dependency on imported building-automation hardware remain key bottlenecks, affecting lead times for retrofits, spares, and commissioning. This increases the importance of vendor-managed inventory, standardized maintenance playbooks, and training pipelines with local institutes.
Competitive Landscape
The top five international operators held a combined 28% share in 2025, leaving ample headroom for domestic specialists. Competition centers on portfolio breadth, technology adoption and certification credentials. AI-driven predictive maintenance at 34 sites reduced emergency repairs by 27% for one leading multinational, strengthening its position in outcome-based tenders. Another global provider’s mobile dashboard that consolidates occupancy, air quality and energy data helped it renew 89% of expiring contracts.
Healthcare facilities represent the most attractive white-space: fewer than 12 local providers hold the required infection-control and medical-gas certifications, yet the segment is projected to grow 8.1% through 2031. New entrants from Japan and Singapore are recruiting biomedical technicians and leveraging regional cost advantages to capture hospital and government tenders. The market is bifurcating as leading firms invest in IoT sensors, cloud CMMS and robotic cleaners while price-focused operators continue to rely on manual workflows, a gap that widens as tenants request ESG-aligned reporting based on GRI standards.
Indonesia Facility Management Industry Leaders
PT Shield On Service Tbk (SOS)
PT Patra Jasa
PT. Spektra Solusindo
Renno Indonesia
AEON Deligh Indonesia
- *Disclaimer: Major Players sorted in no particular order

Market Opportunities and Future Outlook
A primary opportunity is concentrated in high-criticality TMT and industrial corridors, where uptime, power quality, and security controls expand premium FM scope, including integrated BMS, energy optimization, and predictive maintenance. In concrete capacity indicators, Digital Edge Indonesia announced a USD 4.5 billion, 500 MW AI-ready hyperscale CGK Campus in Bekasi in January 2026, and Digital Realty formed Digital Realty Bersama to develop and operate data centers in Indonesia in July 2026. Together, these projects expand the installed base of mission-critical facilities that require specialized MEP operations, EHS compliance, and 24/7 response coverage.
Another opportunity is end-to-end operations support around connectivity and smart-infrastructure programs that tie buildings and estates to data, sensors, and reporting. Indonet launched a third underground fiber route of over 80 km in its Eastern Corridor connecting Jakarta to Bekasi and Karawang in July 2026, and Indosat Ooredoo Hutchison completed the carve-out of its fiber infrastructure business into PT Infra Fiber Teknologi (IFT) in July 2026. These moves increase the number of distributed infrastructure assets that need standardized preventive maintenance, field service management, and security. On the built-environment side, the Smart Building framework under Permen PUPR No 10/2023 and Nusantara smart-building guidance provide a clearer procurement pathway for vendors that can integrate BMS, IoT sensors, and auditable ESG reporting into outcome-based FM contracts, particularly across mixed-use projects and public assets where compliance documentation and performance baselines are central.
Recent Industry Developments
- July 2026: Digital Realty and Bersama Digital Infrastructure Asia formed a 50/50 joint venture, Digital Realty Bersama, to develop and operate data centers in Indonesia. The move expands the mission-critical facility base that relies on high-uptime MEP operations, security, and energy management, raising demand for specialized integrated FM and data-center capable subcontractors.
- April 2026: PT Shield On Service Tbk officially finalized its merger with PT ALSOK BASS Indonesia Security Services, integrating operations under the SOSS entity. The consolidation strengthens scale in guarding-led contracts and supports cross-selling into bundled facility management packages across multi-site clients.
- September 2025: Patra Jasa Facility Management Services signed a cooperation agreement with PT Pertamina Patra Niaga Regional Kalimantan to manage facility assets. The agreement reinforces energy-sector facility portfolios as anchor clients for hard services and compliance-led maintenance delivery outside Java.


Research Methodology Framework and Report Scope
Market Definition and Coverage
For this report, the Indonesia facility management market is counted as the value of services used to operate, maintain, and support buildings and sites, covering both hard services (like MEP and HVAC upkeep) and soft services (like cleaning and security).
Scope exclusions: We exclude building construction and major capex renovation works that materially change the asset, because these are treated as project and contracting spend instead of ongoing facility management.
Segmentation Overview
- By Service Type
- Hard Services
- Asset Management
- MEP and HVAC Services
- Fire Systems and Safety
- Other Hard Facility Management Services
- Soft Services
- Office Support and Security
- Cleaning Services
- Catering Services
- Other Soft Facility Management Services
- Hard Services
- By Offering Type
- In-house
- Outsourced
- Single Facility Management
- Bundled Facility Management
- Integrated Facility Management
- By End-User Industry
- Commercial
- Hospitality
- Institutional and Public Infrastructure
- Healthcare
- Industrial and Process
- Other End-User Industries
Data Sources, Market Sizing, and Validation
Desk Research
Desk work starts by mapping the demand pool that drives facility management spending in Indonesia, which helps us avoid sizing based only on supplier claims. For market anchors, we use public data series such as Statistics Indonesia (BPS) for output and employment trends, Bank Indonesia for macro and inflation indicators, the Ministry of Public Works and Housing for infrastructure direction, and the Financial Services Authority (OJK) plus the Indonesia Stock Exchange for listed-company disclosures.
To keep the model grounded, we also review company annual reports, investor presentations, and reputable press coverage on large property and industrial site expansions, followed by relevant peer reviewed papers on building energy use and maintenance practices. When needed, paid subscriptions are used in a limited way for company financial intelligence, tender and contract tracking, and import export shipment checks on key equipment linked to hard services. These examples are not exhaustive, and many other public and paid sources were also referenced to collect data, validate assumptions, and clarify gaps.
Primary Interviews and Surveys
Primary interviews and surveys were used to pressure test the service scope, pricing logic, and the split between in-house and outsourced delivery, since these can shift the market value even when building stock is stable. We spoke with a mix of buyers (property, industrial, and public facility teams) and providers (hard and soft service specialists, plus integrated contractors), and we validated assumptions across major demand centers in the country through multiple respondent cohorts.
Distribution of primary research fieldwork respondents
| Company type | Respondent position | Region |
|---|---|---|
| Top tier: 26% | CXOs: 16% | |
| Mid tier: 58% | Functional/Unit leaders: 24% | |
| Smaller Players: 16% | Managers: 60% |
Market-Sizing & Forecasting
Sizing is built using top-down logic where Indonesia building and infrastructure activity is translated into an addressable facility management spend pool, which is then split by hard and soft service intensity and by delivery model. To keep it realistic, we cross-check the totals with selective bottom-up approximations, such as sampled contract rate cards, typical site level staffing and maintenance schedules, and supplier roll ups where coverage is visible, and then we adjust for gaps.
Key inputs used in the model include the stock and pipeline of commercial and institutional space, the pace of industrial and logistics site additions, outsourcing penetration by end user, typical contract lengths and rebid cycles, wage inflation for technicians and cleaning staff, and energy efficiency and compliance driven maintenance cycles. Forecasts are primarily built using scenario analysis, since contract repricing, outsourcing shifts, and policy led infrastructure pushes can move faster than simple trend lines, and assumptions are aligned to what interviewees expect on pricing and uptake.
Data Validation & Update Cycle
We validate outputs by triangulating the modeled market value against independent signals, such as the direction of tender activity, listed player revenue exposure where disclosed, and the implied service spend per square meter for major facility types. Variances are reviewed in multiple steps, and outliers are traced back to inputs like wage escalation, outsourcing share, and the hard services intensity for industrial sites.
Reports are refreshed annually, and interim updates are triggered when material events occur, such as large regulatory changes, major infrastructure budget shifts, or unusual inflation swings that affect service pricing. Before delivery, the model receives a fresh final pass so the numbers reflect the latest available inputs and interview feedback.
Mordor Intelligence's Indonesia Facility Management Market Sizing Compared With Other Published Estimates
Published market sizes for facility management in Indonesia can differ even when they look like they cover the same country, because the service basket and the pricing base year are not aligned. Differences also come from how in-house delivery is valued, how bundled contracts are treated, and whether the estimate follows actual contract repricing or assumes smooth growth.
Construction and major renovation spending is a common item that gets blended into some estimates, and that item sits outside Mordor Intelligence's scope because this study focuses on recurring operations and maintenance service value. Another gap driver is the handling of outsourcing, where some sources mainly size third-party services, while others add an implied value for in-house teams without checking what is already captured inside service contracts and staffing costs.
Benchmark comparison
| Source | Market Size | Gaps in Research Methodology |
|---|---|---|
| Mordor Intelligence | USD 12.86 B (2025) | |
| Trade Journal A | USD 12.74 B (2024) | Uses a 2024 base year and a faster near-term growth path through 2030, with limited clarity on how in-house delivery is monetized and how contract repricing is updated. |
| Industry Network B | USD 14.31 B (2025) | Appears to include a broader spend pool with less detail on exclusions like project-led building works, and service category grouping is more aggregated, which can lift totals. |
Across the three figures, most of the spread is explained by what gets counted as facility management versus project activity, followed by the base year used for pricing and the treatment of in-house value. By keeping variables like outsourcing share, wage and price escalation, and service intensity tied to observable demand signals, we keep the total traceable and easier to reproduce over time.


Key Questions Answered in the Report
What is the current value of the Indonesia facility management market and its expected growth?
The market is valued at USD 12.86 billion in 2025 and is projected to reach USD 17.78 billion by 2031, registering a 5.52% CAGR.
Which service category dominates spending in Indonesian facilities?
Hard services such as MEP, HVAC and fire systems account for 58.42% of 2025 revenue, reflecting the need for compliant mechanical upkeep.
Why are integrated facility management contracts gaining popularity?
Multinationals prefer single-point accountability, and outcome-based agreements link payments to uptime and energy-saving metrics that reduce overall costs.
How is ESG financing influencing facility management budgets?
Banks offer interest-rate discounts for green-certified buildings, spurring investments in energy-efficient retrofits that increase demand for certified vendors.
Which end-user segment is forecast to grow the fastest?
Industrial and process facilities tied to electric-vehicle supply chains are expected to expand at 6.12% through 2031.
What challenges do providers face when operating across multiple provinces?
Differing fire-safety and labor regulations require parallel documentation systems, adding compliance costs for multi-site operators.
Page last updated on:


