
Market Overview
| Study Period | 2020 - 2031 |
|---|---|
| Forecast Data Period | 2026 - 2031 |
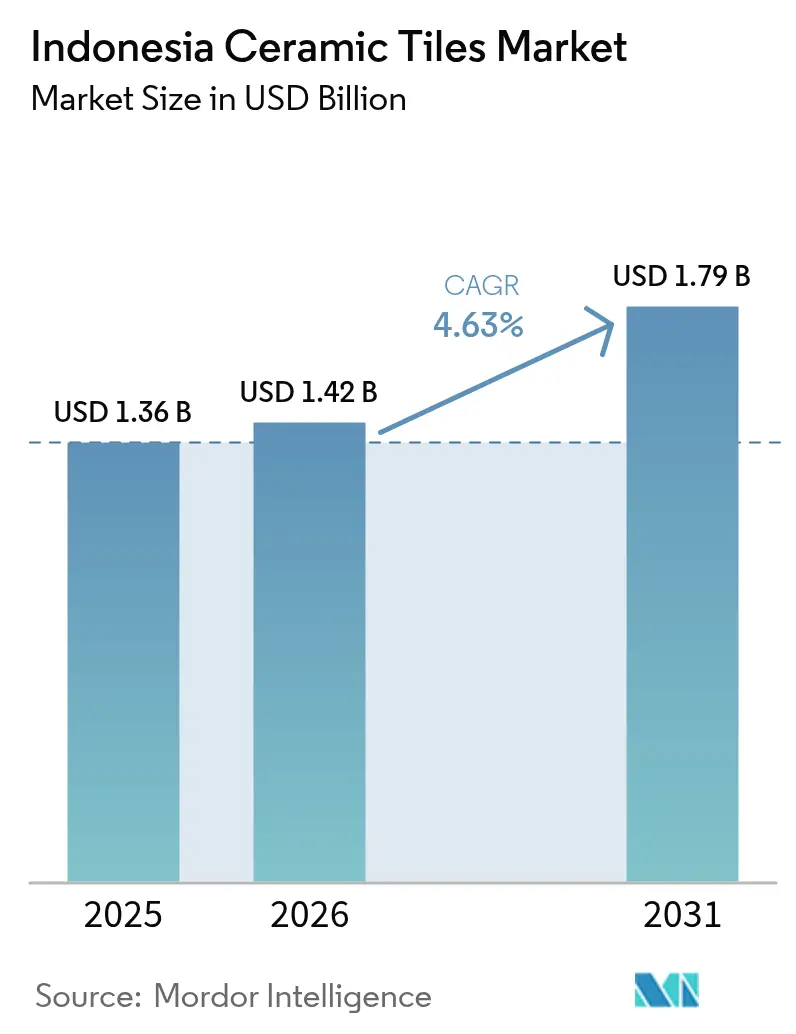
| Base Year Market Size (2025) | USD 1.36 Billion |
| Market Size (2026) | USD 1.42 Billion |
| Market Size (2031) | USD 1.79 Billion |
| Growth Rate (2026 - 2031) | 4.63 % |
| Market Concentration | Medium |
Major Players *Disclaimer: Major Players sorted in no particular order Image © Mordor Intelligence. Reuse requires attribution under CC BY 4.0. | |
Indonesia Ceramic Tiles Market Analysis by Mordor Intelligence
The Indonesia ceramic tiles market size was valued at USD 1.36 billion in 2025 and estimated to grow from USD 1.42 billion in 2026 to reach USD 1.79 billion by 2031, at a CAGR of 4.63% during the forecast period (2026-2031). Demand momentum stems from the government’s subsidized-gas policy, a 100-200% duty wall against low-cost imports, and the massive 3 Million Houses program, all of which drive fresh orders across residential, commercial, and public projects. Robust GDP growth of 5.1% through 2027, steady urban migration, and higher renovation spending among middle-income households add multiple layers of resilience to construction activity. Manufacturers capitalize on porcelain’s durability-driven appeal, while digital sales channels widen geographic reach and partly offset Indonesia’s high inter-island freight costs. Local producers also benefit from mandatory SNI quality standards that raise compliance hurdles for importers and protect pricing power in premium product niches. [1]Ministry of Industry, “Statistik Industri Keramik 2025,” kemenperin.go.id.
Key Report Takeaways
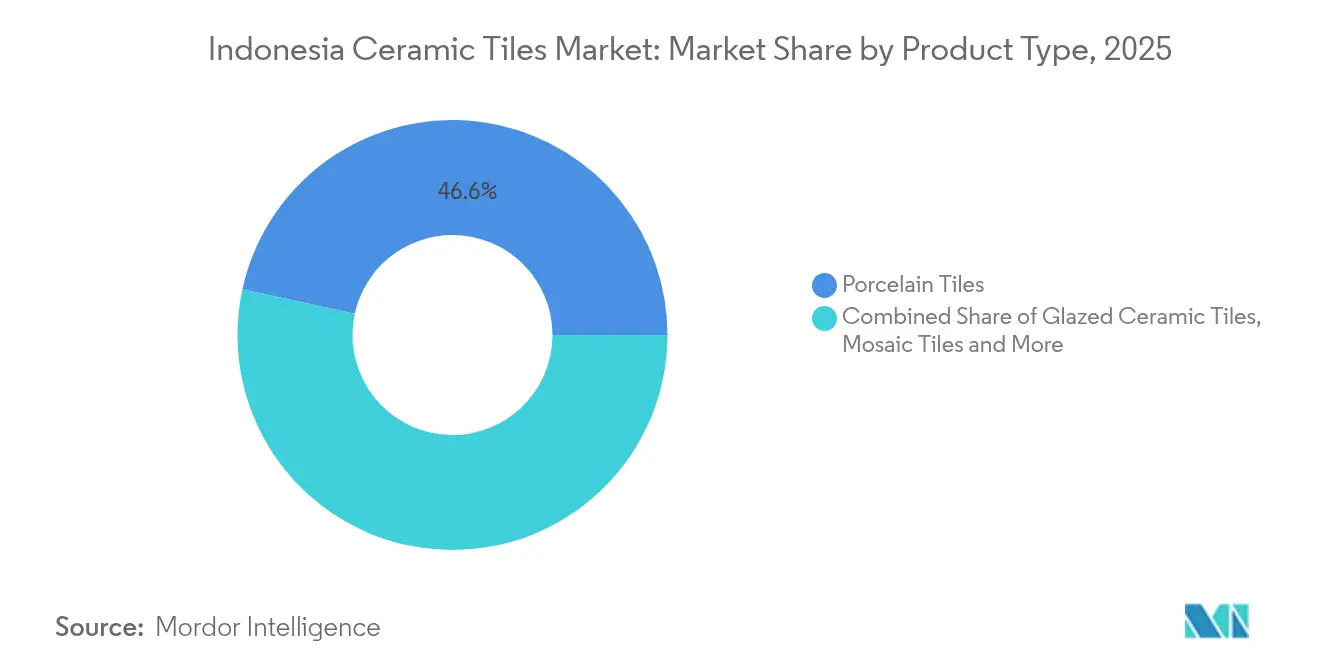
- By product type, porcelain tiles led with 46.58% of Indonesia ceramic tiles market share in 2025; mosaic tiles are advancing at a 5.28% CAGR to 2031.
- By application, floor installations captured 61.48% share of the Indonesia ceramic tiles market size in 2025, while roofing tiles are projected to expand at 5.44% CAGR through 2031.
- By end-user, residential construction held 54.32% revenue share in 2025 and is on track for a 5.67% CAGR up to 2031.
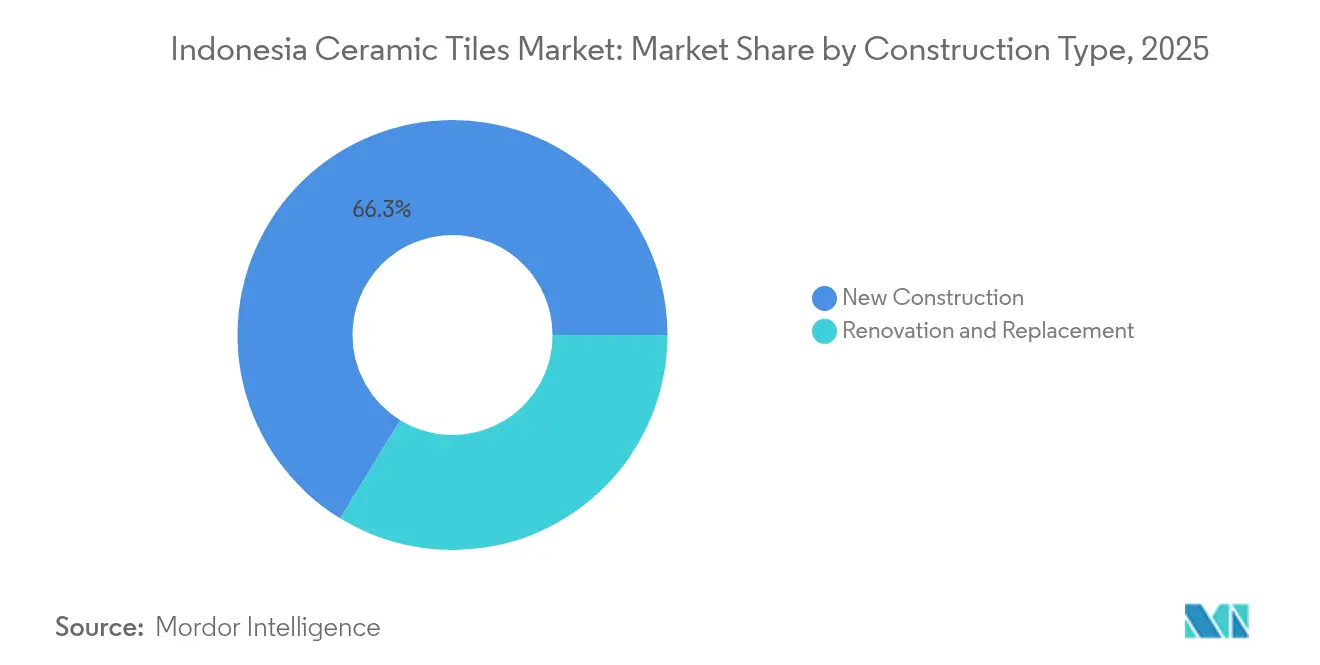
- By construction type, new projects commanded 66.25% share of the Indonesia ceramic tiles market size in 2025; renovation work shows the stronger growth pulse at 5.98% CAGR.
- By geography, Java accounted for 41.05% share of the Indonesia ceramic tiles market in 2025, whereas Bali & Nusa Tenggara is forecast to post the fastest 6.18% CAGR through 2031.
Note: Market size and forecast figures in this report are generated using Mordor Intelligence’s proprietary estimation framework, updated with the latest available data and insights as of 2026.
Indonesia Ceramic Tiles Market Trends and Insights
Drivers Impact Analysis*
| Driver | (~) % Impact on CAGR Forecast | Geographic Relevance | Impact Timeline |
|---|---|---|---|
| Gas-price cap for energy-intensive ceramics | 1.2% | Java, Sumatra, with spillover to Kalimantan | Medium term (2-4 years) |
| Post-pandemic residential boom in Java & Bali | 0.9% | Java & Bali, extending to urban centers nationwide | Short term (≤ 2 years) |
| Duty hike on Chinese imports | 0.8% | National, with concentrated benefits in Java production hubs | Short term (≤ 2 years) |
| Government "One Million Houses" program | 1.1% | National, with priority in Java, Sumatra, Kalimantan | Long term (≥ 4 years) |
| Rapid urbanisation of secondary cities | 0.7% | Sumatra, Kalimantan, Sulawesi secondary urban centers | Long term (≥ 4 years) |
| Rising middle-class renovation spending | 0.6% | Java, Bali, extending to Sumatra metropolitan areas | Medium term (2-4 years) |
| Source: Mordor Intelligence | |||
Gas-price cap for energy-intensive ceramics
The USD 6.75 per MMBTU ceiling under the Certain Natural Gas Price Policy trims roughly 30% of kiln operating costs for tile plants, granting domestic producers a decisive cost edge[2]Ministry of Energy and Mineral Resources, “Perpanjangan Harga Gas Tertentu,” esdm.go.id. Capacity-planning confidence rises because the subsidy runs through 2025, enabling factories to lock in feedstock and schedule equipment upgrades. The benefit concentrates in Java and Sumatra, where pipeline infrastructure supports high utilization despite national supply gaps. Subsidized gas helps plants counter rupiah depreciation impacts on imported raw materials. However, deliveries cover only 65-70% of contracted volumes, turning fuel availability into a gating constraint for near-term output growth. The government's broader strategy of using energy subsidies to support domestic manufacturing aligns with Indonesia's industrial policy objectives, positioning ceramic tiles as a strategic sector for import substitution and export development initiatives.
Post-pandemic residential boom in Java & Bali
Mortgage rate incentives and tax relief revived stalled housing projects and spurred new launches once mobility restrictions eased[3]Bank Indonesia, “Indonesian Residential Property Price Index Q1-2025,” bi.go.id. Java’s urban centers account for 60% of population and 58% of GDP, funneling a large portion of tile demand into high-density apartment and landed-housing schemes. Bali’s premium villa pipeline favors large-format, design-rich tiles that lift average selling prices. The renovation wave also stays strong as remote work habits push home-owners to upgrade kitchens and bathrooms. Collectively, these drivers underpin more than half of all volume additions through 2027. The integration of smart home technologies and sustainable building practices in new residential developments creates opportunities for ceramic tile manufacturers to develop innovative products that meet evolving consumer expectations and regulatory requirements for energy-efficient construction.
Duty hike on Chinese imports
Safeguard tariffs of 100–200% neutralize low-cost inflows that once undercut local factory gate prices by up to 25%. The measure restores breathing space for Indonesian plants to run at economic batch sizes and recoup energy-intensive investments. Importers now focus on niche designs not readily available from domestic lines, segmenting the market by quality tier. Consumers see modest price increases, yet policy makers deem the trade-off acceptable for industrial job retention. The duty structure remains adjustable, allowing authorities to recalibrate if shortages emerge. The policy's implementation through regulatory mechanisms rather than blanket prohibitions provides flexibility for adjustment based on market conditions and domestic industry development progress, enabling calibrated responses to changing competitive dynamics.
Government “One Million Houses” program
The current administration scaled the target up to 3 million low-cost units annually, institutionalizing a multi-year demand pipeline for standard-size floor and wall tiles[4]Ministry of Public Works, “Program Sejuta Rumah 2025,” pu.go.id. International co-financing embeds green-build criteria, steering suppliers toward low-VOC glazes and recycled inputs. Bulk procurement practices compress per-square-meter costs but guarantee large volume off-take, anchoring factory throughput. Vertical apartment formats intensify tile usage per building footprint, especially in wet areas. Program spillovers reach remote provinces, nudging manufacturers to diversify distribution beyond Java. The integration of green building practices and energy-efficient design standards in program specifications creates opportunities for ceramic tile manufacturers to develop products that meet sustainability requirements while serving mass-market price points.
Restraints Impact Analysis*
| Restraint | (~) % Impact on CAGR Forecast | Geographic Relevance | Impact Timeline |
|---|---|---|---|
| Industrial gas-supply bottlenecks | -1.1% | Java, Sumatra production centers with pipeline access | Short term (≤ 2 years) |
| Depreciating rupiah inflates imported raw-material costs | -0.8% | National, with concentrated impact on import-dependent manufacturers | Medium term (2-4 years) |
| Domestic over-capacity drives price wars | -0.6% | Java, Sumatra manufacturing hubs with high concentration | Short term (≤ 2 years) |
| High inter-island logistics costs across the archipelago | -0.9% | Eastern Indonesia, remote islands, inter-regional trade | Long term (≥ 4 years) |
| Source: Mordor Intelligence | |||
Industrial gas-supply bottlenecks
Pipeline network limits force many kilns to operate below 70% of design loads, eroding economies of scale. Frequent pressure drops interrupt firing cycles and raise reject rates. Rent-seeking behavior in allocation processes adds further uncertainty to production planning. Manufacturers without dual-fuel capability must absorb idle costs or delay deliveries. Investors defer capacity expansion until transmission upgrades assure steady volume. Foreign investors' reconsideration of ceramic industry investments, as reported by Asaki, demonstrates how supply reliability concerns translate into reduced capital formation and technological upgrading that could otherwise support market expansion and competitiveness improvements.
Depreciating rupiah inflates imported raw-material costs
Specialty clays, glazes, and spare parts sourced in USD or CNY instantly become dearer when the local currency weakens. Small and medium manufacturers lacking hedging instruments feel the pinch most acutely. Price sensitivity in mass housing limits pass-through ability, squeezing margins. Capital expenditure on European digital-printing lines also climbs in local-currency terms. Currency stabilization therefore ranks high on industry wish lists to sustain competitiveness. The rupiah's performance relative to the Chinese yuan becomes particularly significant given China's role as a major supplier of ceramic tile production equipment and raw materials, creating complex currency exposure patterns that affect both input costs and competitive dynamics with Chinese imports.
*Our forecasts treat driver/restraint impacts as directional, not additive. The impact forecasts reflect baseline growth, mix effects, and variable interactions.
Segment Analysis
By Product Type: Porcelain Dominance Drives Premium Shift
Porcelain tiles held a 46.58% share of the Indonesia ceramic tiles market in 2025, reflecting widespread acceptance in malls, hotels, and transit hubs where high abrasion resistance is crucial. The Indonesia ceramic tiles market size for porcelain is projected to widen alongside rapid commercial real-estate expansion in Jakarta and Surabaya. Mosaic formats, though starting at a smaller base, exhibit the highest 5.28% CAGR as homeowners embrace design individuality in bathroom and kitchen revamps. Domestic firms leverage ink-jet printing and large-slab presses to mimic marble and wood, capturing spend that once flowed to natural stone. Regulatory emphasis on low-VOC glazes also nudges producers toward eco-friendlier formulations, reinforcing porcelain’s premium tag.
Value migration toward larger modules (60×120 cm and 80×80 cm) benefits efficient installation and modern aesthetics sought by architects. Unglazed and anti-slip variants gain traction in industrial floors and outdoor patios where functional safety tops visual preference. Handmade artisanal tiles retain a niche among luxury resorts in Bali, commanding high margins despite limited scale. The Indonesia ceramic tiles market continues to reward suppliers able to mesh technical attributes with on-trend looks, especially when backed by SNI certification that reassures buyers on durability benchmarks. Energy-efficient fast-firing kilns further lower cost per square meter, allowing competitive pricing even under fuel volatility.


By Application: Flooring Relies on Climate Advantages
Flooring captured 61.48% of the Indonesia ceramic tiles market share in 2025 because households value waterproofing and ease of cleaning amid tropical humidity. Developers increasingly specify 3-mm grout lines and rectified edges to achieve seamless visuals in high-traffic retail settings. Roofing tiles, expanding at 5.44% CAGR, meet rising demand for thermally stable, cyclone-resistant coverings in secondary cities prone to severe weather. Wall cladding benefits from heightening hygiene requirements in hospitals and educational premises where washable surfaces are mandatory. The Indonesia ceramic tiles industry also finds upside in modular raised-floor systems integrating airflow and cabling for future-ready office towers.
Continuous design innovation such as antibacterial glazes widens hospital and food-processing appeal. Outdoor decks adopt porcelain pavers that tolerate heavy footfall and monsoon deluges better than timber. Underfloor-heating compatibility, once limited to temperate markets, now appears in premium Indonesian villas, boosting ceramic relevance. Compliance with OECD resilience guidelines positions tile roofing as a preferred alternative to galvanized sheets in public housing upgrades. The segmentation underscores how functional imperatives and evolving building codes sustain diversified growth paths across applications.
By End-User: Residential Commands Dual Momentum
Residential builders consumed 54.32% of national tile shipments in 2025 and still clock the fastest 5.67% CAGR, propelled by affordable-housing mandates and a vibrant remodeling culture. Younger families gravitate toward compact apartments outfitted with easy-maintenance porcelain, increasing per-unit tile density relative to landed homes. High-end consumers in Bali and Jakarta upgrade to textured slabs inspired by terrazzo and onyx, highlighting the Indonesia ceramic tiles market’s swift premiumization. Commercial demand follows tourism and retail footprints, with resort refurbishments absorbing statement-piece mosaics to refresh guest experiences. Healthcare and education sectors adopt large-format tiles to minimize joints and improve infection control, extending non-residential opportunity breadth.
Government spending on clinics and community centers channels steady baseline volumes independent of property cycles. Rapid mall expansions in Surabaya and Medan anchor repeat orders for anti-scratch matt slabs that survive trolley loads. Transport-hub investments surrounding the new Nusantara capital will requisition hard-wearing tile in concourses and platforms. Residential renovators, aided by micro-finance schemes, inject design variety into mass-produced suburban estates, enlarging the addressable renovation basket. Overall, end-user diversification buffers the Indonesia ceramic tiles industry against shocks confined to a single customer segment.
By Construction Type: New-Build Dominates but Renovation Accelerates
New-build accounted for 66.25% of tile uptake in 2025, mirroring Indonesia’s infrastructure leap and housing backlog. Bulk tendering across public projects secures predictable demand yet pressures suppliers to maintain competitive pricing. Renovation, projected at a brisk 5.98% CAGR, fills factory kilns during lulls in new-build activity and supports margin resilience through customization premiums. Ageing structures in Jakarta’s satellite cities need bathroom and façade overhauls to meet modern safety codes, stoking continuous replacement cycles. The Indonesia ceramic tiles market therefore balances cyclical new-project swings with steadier aftermarket business.
Post-occupancy fit-outs—particularly in speculative office towers—add incremental volumes once anchor tenants commit, extending revenue tails for builders and tile makers alike. Prefabricated bathroom pods integrated into skyscrapers raise large single-order quantities for factory-glazed wall panels. Seismic-upgrade mandates in fault-line areas stimulate demand for flexible thin-tile cladding systems. Sustainable retrofit incentives under provincial green-building ordinances direct budget toward low-embodied-carbon ceramic options. These currents jointly elevate the renovation profile within overall consumption.
By Distribution Channel: Digital Commerce Reshapes Reach
Specialty tile outlets preserved a 44.76% revenue share in 2025, favored by contractors who value technical counsel and sample libraries. DIY megastores leverage national branch networks to court cost-conscious renovators seeking weekend installation kits. Online marketplaces, on a 6.92% CAGR curve, remove geographic limits and give eastern-province shoppers access to Java-stocked designs, trimming the effective impact of freight differentials. Direct contractor supply deals lock in repeat high-volume transactions for mid-rise housing clusters. The Indonesia ceramic tiles market thus migrates toward an omnichannel environment where physical showrooms and virtual catalogs coexist fluidly.
Virtual-reality room simulators help buyers envision patterns without lugging sample boards, shortening decision cycles. Click-and-collect models mesh e-orders with warehouse pickup, mitigating breakage risk during last-mile delivery. Live-stream demos on social platforms showcase installation techniques, boosting consumer confidence in DIY adoption. Payment-installment functions embedded in e-wallets democratize access to premium ranges among first-time homeowners. At the wholesale end, blockchain-based supply tracking strengthens trust in provenance and quality claims for institutional buyers.
Geography Analysis
Java generated 41.05% of Indonesia ceramic tiles market turnover in 2025, supported by dense urban clusters, mature highway links, and container terminals that compress logistics overhead. Jakarta’s 34 million-resident megalopolis alone commands major renovation flows as property owners modernize ageing stock ahead of lease renewals. Surabaya and Bandung diversify demand with retail and university expansions, while Batang Integrated Industrial Park supplies export-oriented production capacity that benefits from nearby seaports. Java’s established showroom ecosystem shortens lead times between design inspiration and purchase, underpinning luxury tile penetration. Bankable household incomes push average selling prices above the national mean, enhancing margins for style-led product categories.
Sumatra’s economy, anchored by palm oil and mining, evolves into a robust second pillar: rising worker incomes in Medan, Pekanbaru, and Palembang accelerate residential starts and interior upgrades. The Trans-Sumatra Toll Road reduces truck transit time, narrowing delivered-cost gaps with Java-made inventory. South Sumatra’s petrochemical cluster spawns ancillary construction, fueling durable-flooring demand in industrial and office premises. Tile merchants partner with regional developers on bulk procurement frameworks that guarantee volume throughput for local warehouses. Despite distance, improved roll-on/roll-off ferries add scheduling certainty and lower breakage, enhancing Sumatra’s attractiveness as an expansion frontier.
Bali & Nusa Tenggara post the swiftest 6.18% CAGR as tourism revival re-ignites villa and resort construction cycles. Premium hospitality chains specify marble-look porcelain slabs and artistic mosaics to differentiate new properties, raising revenue per square meter relative to national averages. Eco-retreat builders adopt energy-reflective roof tiles compliant with green-resort certification, cementing high-value niches for specialized suppliers. Local artisans collaborate with large producers to blend handcrafted accents within mass-manufactured lines, reinforcing Bali’s design-led identity. Meanwhile, Kalimantan and Sulawesi draw attention through the Nusantara capital build-out and nickel-downstreaming projects, respectively, each creating pockets of concentrated tile requirements that justify mobile stockyards and pop-up showrooms.
Value Chain Analysis
Indonesia's ceramic tiles value chain begins with extraction and processing of minerals such as clay, feldspar, quartz sand, kaolin, and zirconium silicate, followed by spray-drying, pressing, glazing/ink-jet decoration, kiln firing, sorting, and packaging at domestic plants. Raw-material sourcing is concentrated, with around 50-60% of national ceramic raw material supply (notably clay and feldspar) coming from West Java, which elevates exposure to provincial mining and permitting actions. Energy is a structural input for the chain, and kiln operations rely on natural-gas availability in core production corridors in Java and parts of Sumatra, shaping plant utilization, maintenance cycles, and product-mix choices (including the shift toward higher-value porcelain and larger formats).
Downstream, heavy and breakable finished tiles move through national distributors, specialty tile and building-material stores, DIY chains, and direct contractor supply, with omnichannel models increasingly used to broaden reach beyond Java. Inter-island logistics remains a cost driver across the archipelago, making warehousing, route planning, and packaging quality critical to reduce damage and improve service levels. Industrial estates such as Batang, Kendal, and Semarang support the chain by pairing access to ports, toll roads, and utilities with proximity to demand centers, while industry coordination via ASAKI and engagement with the Ministry of Industry has become more visible during recent raw-material disruptions tied to regional policy constraints in West Java.
Competitive Landscape
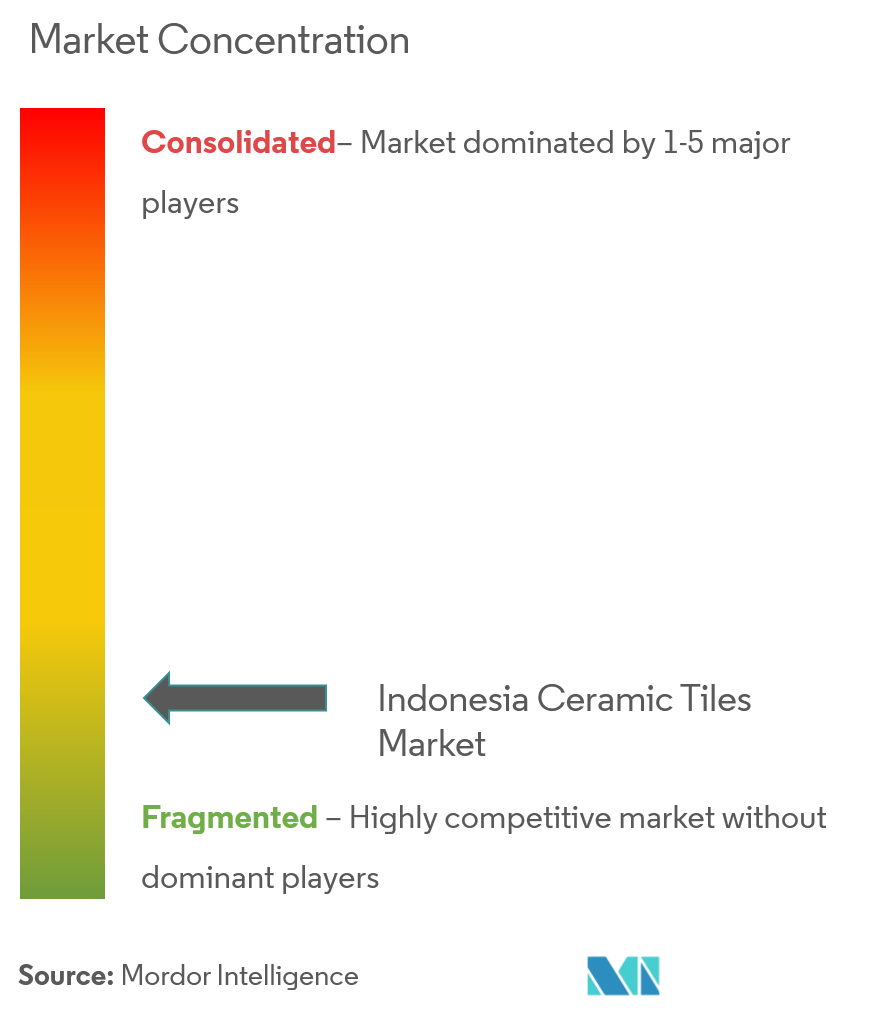
Indonesia ceramic tiles market competition remains moderate as more than a dozen sizable firms jostle for post-tariff domestic share while small and medium outfits serve regional tastes. Cost leadership tilts toward vertically integrated groups that secure clay deposits, run efficient roller-kilns, and maintain in-house logistics fleets, insulating them from imported fuel and freight shocks. Differentiation plays surface in digital-printing mastery, water-jet cut mosaics, and large-slab presses capable of 160×320 cm formats that appeal to high-end architects. Government gas subsidies further widen operating-margin dispersion between certified plants and less efficient rivals that burn LPG back-ups. Joint ventures with European technology suppliers accelerate quality climb, making local output credible substitutes for Italian or Spanish imports in upscale projects.
Market entrants push e-commerce-first models, shipping directly from central warehouses to homeowners willing to schedule deliveries around fixed ferry timetables. Legacy retailers retaliate by bundling measurement, installation, and after-sales warranties, erecting service moats that pure online players cannot easily replicate. Over-capacity still invites sharp price skirmishes during seasonal lulls, occasionally prompting temporary furnace shutdowns to stabilize inventory. Consolidation whispers surface each time smaller kilns struggle under a weak rupiah, yet family-owned governance structures slow merger negotiations. Foreign brands eye tariff-shielded margins through toll-manufacture arrangements with Indonesian factories, circumventing safeguard duties while injecting global designs into local catalogs.
Sustainability credentials become an emergent battlefield: producers adopting regenerative-heat recuperation and recycled-glass frits gain favor in LEED and EDGE-certified buildings. Marketing narratives spotlight water-recycling at slip-casting bays and solar roofs atop drying chambers, speaking to developers chasing ESG finance. Corporate social responsibility programs in earthquake-affected zones donate tiles for school reconstruction, quietly building goodwill and brand visibility. On the innovation front, antimicrobial glazes infused with nano-silver target health-care tenders, a niche likely to scale as hygiene consciousness deepens post-pandemic. Altogether, the competitive scene rewards agility in technology, channel strategy, and sustainability positioning.
Indonesia Ceramic Tiles Industry Leaders
Arwana Citramulia Tbk
Platinum Ceramics Industry
KIA Keramik Tbk
Roman Ceramic International
Mulia Keramik Indahraya
- *Disclaimer: Major Players sorted in no particular order

Market Opportunities and Future Outlook
Capacity additions and geographic diversification within Indonesia create whitespace for suppliers that can serve both mass housing and premium formats with reliable lead times. PT Arwana Citramulia Tbk's preparation to start operating Plant 4D in Ogan Ilir, South Sumatra, with 5.5 million square meters of annual capacity is a practical signal of investment moving closer to non-Java demand corridors and to distribution lanes feeding Sumatra and eastern provinces. At the industry level, ASAKI has communicated a collective investment plan of around Rp 5 trillion tied to expansion and higher utilization in 2026, while also noting that some former importers have shifted into domestic manufacturing, including a new facility referenced in Surabaya with sizable daily output, reinforcing the opportunity for domestic OEM and private-label production that leverages Indonesia's trade protections.
Product and channel opportunities are concentrated in renovation-led demand and higher-specification tile categories that compete with imported design niches. The government's 3 Million Houses program supports large, standardized volumes, while premiumization in commercial and hospitality projects supports larger formats, digital-print surfaces, and specialized performance attributes, encouraging upgrades in pressing, glazing, and quality-control capability. At the same time, supply-side constraints are shaping opportunity around energy resilience and logistics: ASAKI has pushed for a natural-gas Domestic Market Obligation (DMO) concept after reporting declines in industrial gas allocation in West Java by February 2026, making dual-fuel readiness, efficiency retrofits, and supply-chain planning differentiators for manufacturers and distributors operating across Indonesia's high-freight inter-island environment.
Recent Industry Developments
- April 2026: Platinum Ceramics Group opened The Living Gallery showroom in Semarang, Central Java, expanding its direct-to-customer and specification-focused retail footprint. The new showroom supports brand-led merchandising and faster design consultation, which can lift premium product mix and reduce reliance on third-party outlets in a key Java distribution corridor.
- June 2026: PT Arwana Citramulia Tbk advanced plans to start operating Plant 4D in Ogan Ilir, South Sumatra, targeting 5.5 million square meters of annual capacity. The move signals a major expansion toward non-Java demand corridors and strengthens distribution reach feeding Sumatra and eastern provinces.
- December 2024: Suvo Strategic Minerals and Huadi Bantaeng Industry Park agreed to form a joint venture for nickel-slag-based low-carbon cement. The initiative supports broader green construction material ecosystems in Indonesia, which can influence tile demand specifications in public and private projects that incorporate sustainability-linked procurement criteria.


Research Methodology Framework and Report Scope
Market Definition and Coverage
This market covers the value of ceramic tiles sold in Indonesia for building and renovation uses, including common ceramic and porcelain tile formats used mainly on floors and walls. The sizing is tracked in USD at the market level and then checked through practical demand and supply signals.
Scope exclusions: This sizing does not count non-ceramic surfacing materials and it excludes broader building finishes such as paints, adhesives, and sanitary ware.
Segmentation Overview
- By Product Type
- Porcelain Tiles
- Glazed Ceramic Tiles
- Unglazed Ceramic Tiles
- Mosaic Tiles
- Others (Decorative, Patterned, Handmade)
- By Application
- Floor
- Wall
- Roofing
- By End-User
- Residential
- Commercial
- Hospitality (Hotels, Resorts)
- Retail Spaces
- Offices & Institutions
- Healthcare
- Educational Facilities
- Transport Hubs (Airports, Metro, Bus Terminals)
- Other Commercial Users
- By Construction Type
- New Construction
- Renovation and Replacement
- By Distribution Channel
- Specialty Tile & Stone Stores
- Home Improvement & DIY Stores
- Online Retail
- Direct Sales to Contractors
- By Geography
- Java
- Sumatra
- Kalimantan
- Sulawesi
- Bali & Nusa Tenggara
- Papua & West Papua
- Maluku Islands
Data Sources, Market Sizing, and Validation
Desk Research
Desk work starts by mapping how tile demand moves with construction and renovation activity in Indonesia, and by building a fact base for imports, exports, and local production. We refer to public sources such as Statistics Indonesia (BPS) for construction and trade series, UN Comtrade for cross-border trade mirrors, and the World Bank for macro indicators like housing activity and inflation.
On the industry side, inputs are checked with sources such as releases from the Indonesian Ceramic Industry Association (ASAKI), customs and port statistics where available, and relevant technical or standards publications that clarify tile categories and product definitions. Company annual reports, investor presentations, and reputable news coverage are then used to understand capacity additions, pricing direction, and distribution shifts. For stitching together long financial histories and tracking patents where needed, we also use paid subscriptions for company financials and patent databases. These desk research sources are illustrative, and many other public and paid references were also used for data collection, validation, and clarification.
Primary Interviews and Surveys
Primary work is used to verify how pricing, mix, and volumes are behaving across main demand pockets, especially residential projects and renovation, and to sanity check the split between offline dealers and growing online channels. We speak with a mix of manufacturers, distributors and retailers, contractors, and large buyers so that assumptions from desk research can be corrected where the market behaves differently in practice.
Distribution of primary research fieldwork respondents
| Company type | Respondent position |
|---|---|
| Top tier: 37% | CXOs: 17% |
| Mid tier: 44% | Functional/Unit leaders: 38% |
| Smaller Players: 19% | Managers: 45% |
Market-Sizing & Forecasting
The core model uses top-down and bottom-up logic together, but it is not built as a full supplier roll-up. In practice, we reconstruct demand from construction and renovation activity, and then convert it into tile consumption using penetration, replacement intensity, and mix assumptions that are tested in interviews.
Key inputs that help shape the numbers include housing starts and completions, renovation and replacement cycles, building permits and construction spending signals, trade flows for ceramic tiles (imports and exports), and price movement for common tile categories, which affects value growth even when volumes are steady. Mix shifts, such as porcelain gaining share and the demand split between floor and wall tiles, are incorporated so the model does not overstate growth from one category into the full market. Where local volume data is patchy, gaps are handled with trade mirrors, capacity and utilization cues, and channel checks, and then the assumptions are re-tested with respondents.
For forecasting, scenario analysis is used around construction momentum, renovation demand, and pricing, and then the final curve is smoothed with simple time-series checks so the year-to-year changes stay realistic. We keep the forecast transparent by tying each driver back to a measurable indicator and a clear assumption that can be updated when conditions change.
Data Validation & Update Cycle
Validation is done by comparing model outputs with independent signals such as tile trade trends, construction activity indicators, and the direction of price changes shared by market participants. If an assumption creates an unexpected jump, it is rechecked, and follow-up calls are triggered to confirm whether it reflects a real market event or a modeling error.
Before sign-off, the build is reviewed in steps so definition, inputs, and calculations stay consistent across years, and so any large variances are explained in plain terms. Reports are refreshed annually, and interim updates are made when major events occur, such as sharp import shifts, policy changes affecting construction, or meaningful capacity moves. Right before delivery, a fresh analyst pass is completed so clients receive an updated and internally consistent view.
Mordor Intelligence's Indonesia Ceramic Tiles Market Estimate Compared With Other Published Estimates
Published market values for ceramic tiles in Indonesia can differ even when they appear to describe the same industry, and this usually comes from differences in product boundaries, year selection, and how pricing is handled. Timing also matters because construction activity and tile prices can change quickly, which then moves the value estimate.
Key gaps usually show up when one source mixes broader tile materials with ceramic tiles, or when the model assumes a faster price run-up without checking it against trade and channel signals. By tracking trade flows, construction activity, and product mix shifts, Mordor Intelligence keeps the Indonesia ceramic tiles total limited to ceramic and porcelain tiles counted at market value, which reduces inflation from adjacent tile materials and inconsistent base-year pricing.
Benchmark comparison
| Source | Market Size | Gaps in Research Methodology |
|---|---|---|
| Mordor Intelligence | USD 1.42 B (2026) | |
| Global Consultancy A | USD 2.30 B (2024) | Uses an earlier base year and a higher growth track, and its scope description is less explicit on how base-year pricing and mix are normalized, which can lift the value when price assumptions are aggressive. |
| Trade Journal B | USD 1.35 B (2025) | Covers a wider tiles basket that includes non-ceramic materials, and the translation from volumes to value is not clearly separated by ceramic-only pricing, which can shift totals depending on material mix. |
The spread in estimates mainly comes from scope boundaries and how price and mix are carried across years. Our approach stays repeatable because each step is tied to measurable signals like construction momentum, trade data, and tile category mix, and then it is rechecked with market participants before finalizing the totals.


Key Questions Answered in the Report
How large is the Indonesia ceramic tiles market in 2026?
The Indonesia ceramic tiles market size is USD 1.42 billion in 2026, with a forecast to reach USD 1.79 billion by 2031.
What is the growth rate of ceramic tile demand in Indonesia?
Demand is set to advance at a 4.63% CAGR between 2026 and 2031, buoyed by housing programs and import-protection policies.
Which product type leads sales volume?
Porcelain tiles remain the top seller with a 46.58% share thanks to durability and aesthetics suited to high-traffic spaces.
Why are logistics costs a problem for Indonesian tile makers?
Distributing heavy, breakable tiles across 17,000 islands raises freight expenses that can double delivered prices in eastern provinces.
How are safeguard duties affecting market competition?
Duties of 100–200% on Chinese imports shield domestic manufacturers, reduce price undercutting, and encourage local capacity use.
What channel is growing fastest for tile purchases?
Online retail shows a 6.92% CAGR as e-commerce platforms overcome geographic barriers and provide visualization tools to consumers.
Page last updated on:


 Your data is secure and never sold or shared.


