
Market Overview
| Study Period | 2021 - 2031 |
|---|---|
| Forecast Data Period | 2026 - 2031 |
| Base Year Market Size (2025) | USD 3.92 Billion |
| Market Size (2026) | USD 4.17 Billion |
| Market Size (2031) | USD 5.7 Billion |
| Growth Rate (2026 - 2031) | 6.43 % |
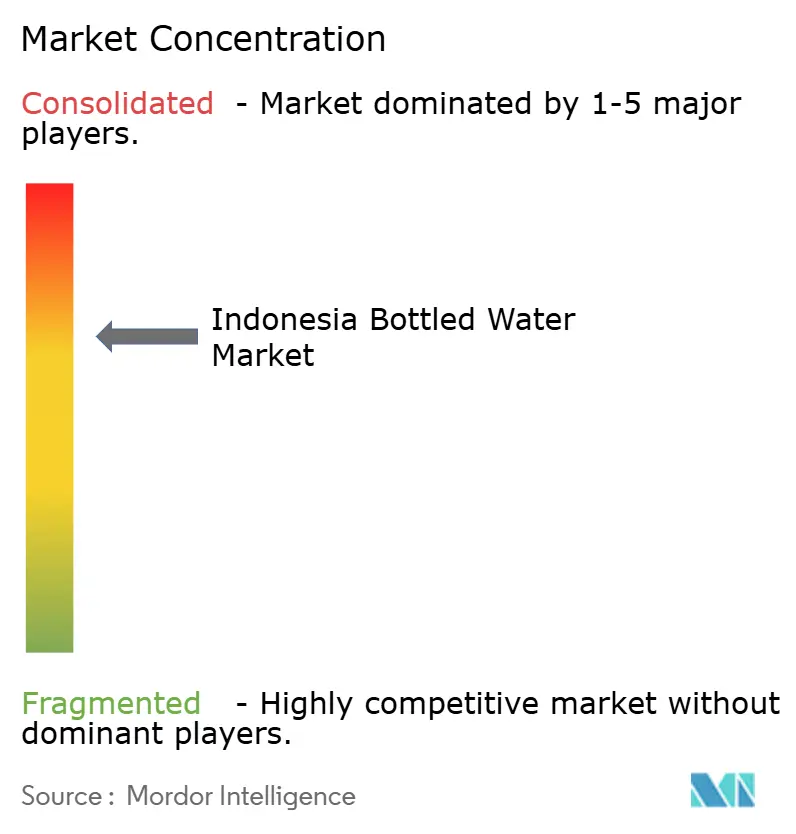
| Market Concentration | Medium |
Major Players *Disclaimer: Major Players sorted in no particular order Image © Mordor Intelligence. Reuse requires attribution under CC BY 4.0. | |
Indonesia Bottled Water Market Analysis by Mordor Intelligence
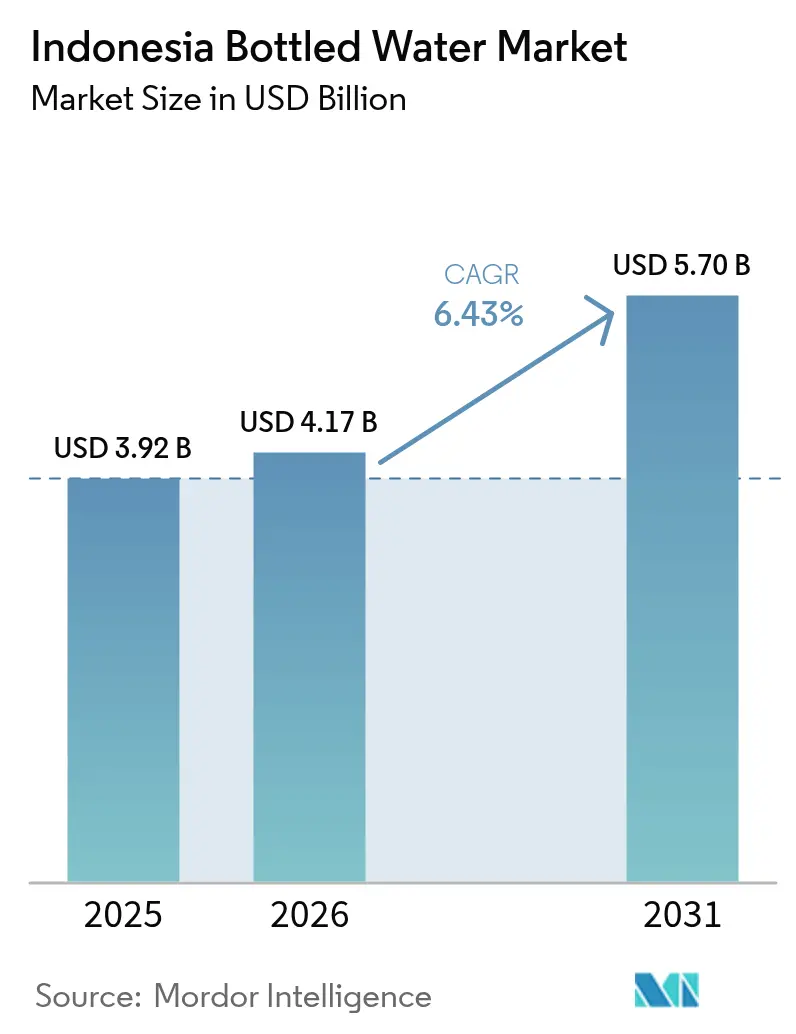
The Indonesian bottled water market size was valued at USD 3.92 billion in 2025 and estimated to grow from USD 4.17 billion in 2026 to reach USD 5.7 billion by 2031, at a CAGR of 6.43% during the forecast period (2026-2031). Today's demand showcases a significant pivot: most households now predominantly turn to branded or refillable drinking water, moving away from conventional sources. This shift is bolstered by rapid urbanization, heightened health consciousness, and enhanced distribution networks spanning the nation's 17,000 islands. While still water retains its dominance, there's a swift ascent in demand for functional and flavored variants, especially among health-conscious millennials. PET packaging leads the pack, but alternatives like recycled resin, label-free bottles, and glass formats are emerging, driven by growing sustainability concerns. To navigate the archipelago's diverse landscape, competitors are honing in on eco-design, establishing regional production hubs, and leveraging digital commerce to tap into both mass and premium market segments.
Key Report Takeaways
- By product type, still water led with an 88.15% revenue share in 2025; functional and flavored water together are projected to expand at an 8.32% CAGR through 2031.
- By packaging, PET commanded 88.68% of the Indonesian bottled water market share in 2025, while glass bottles recorded the fastest growth at an 8.05% CAGR.
- By pricing tier, the mass segment captured 90.74% of the Indonesian bottled water market size in 2025; premium and luxury are set to rise at a 7.79% CAGR to 2031.
- By distribution, off-trade outlets held 77.95% share in 2025, whereas on-trade is recovering at a 7.44% CAGR on the back of hospitality growth.
- By region, Java accounted for 61.88% of the value in 2025, while Kalimantan represents the fastest-growing geography at a 7.12% CAGR through 2031.
Note: Market size and forecast figures in this report are generated using Mordor Intelligence’s proprietary estimation framework, updated with the latest available data and insights as of 2026.
Indonesia Bottled Water Market Trends and Insights
Drivers Impact Analysis*
| Driver | (~) % Impact on CAGR Forecast | Geographic Relevance | Impact Timeline |
|---|---|---|---|
| Growth of premium and functional bottled water products | +1.2% | Java, Bali, urban centers nationwide | Medium term (2-4 years) |
| Innovative packaging solutions for convenience and environmental impact | +0.8% | National, with early adoption in Jakarta, Surabaya | Short term (≤ 2 years) |
| Rapid urbanisation boosting on-the-go hydration needs | +1.5% | Java, Sumatra, Kalimantan major cities | Long term (≥ 4 years) |
| Adoption of advanced purification and bottling technologies | +0.6% | National, concentrated in Java production hubs | Medium term (2-4 years) |
| Increasing health consciousness with shift from sugary drinks | +1.1% | Urban areas across all regions | Medium term (2-4 years) |
| Expansion of tourism and hospitality sector | +0.9% | Bali, Java, emerging destinations in Sulawesi | Short term (≤ 2 years) |
| Source: Mordor Intelligence | |||
Growth of premium and functional bottled water products
In Indonesia, the rise of premium and functional water segments is transforming traditional mass-market dynamics. Health-conscious consumers are increasingly gravitating towards alkaline and vitamin-enhanced products. A case in point is PT Sariguna Primatirta's foray into the high-pH market with its SuperO2 and Vio8+ offerings. Meanwhile, brands like Pristine 8.6+ are honing in on specific health benefits[1]. This segment's expansion is fueled by growing disposable incomes and marketing campaigns that tout functional water as a form of preventive healthcare. Niche brands, such as Kangen Water, are leveraging digital marketing, especially on platforms like Instagram and Facebook, to make inroads into urban markets. As a result of this premiumization trend, established players are discovering new revenue streams, while specialized brands find fertile ground among value-conscious consumers seeking more than just basic hydration.
Innovative packaging solutions for convenience and environmental impact
As environmental regulations tighten and consumers increasingly favor sustainability, packaging innovation has emerged as a key differentiator. MOUNTOYA has pioneered Indonesia's first label-free bottled water packaging, marking a significant step in curbing plastic waste without compromising product integrity or brand visibility. In a notable move, Coca-Cola, in collaboration with PT Amandina Bumi Nusantara, has rolled out bottles made entirely from recycled PET. This initiative underscores Coca-Cola's robust commitment to circular economy principles, with an ambitious target of achieving 50% rPET content across its entire portfolio by 2025[2]. Responding to the Indonesian government's new warning requirements on BPA leaching, innovators are pivoting towards BPA-free packaging materials, granting them a competitive edge. While premium brands champion sustainability messaging, driving an 8.16% CAGR growth in glass bottle segments, cost considerations pose challenges for broader market adoption.
Rapid urbanisation boosting on-the-go hydration needs
As commuting patterns and lifestyle changes shift consumption away from home, Indonesia's accelerating urbanization is driving a surge in demand for convenient, portable hydration solutions. With Indomaret and Alfamart boasting over 36,146 outlets nationwide, the expansion of convenience store networks is providing bottled water brands with an unprecedented distribution reach, as highlighted by Lloyds Bank Trade. In cities like Medan, where only 68% of fresh water needs are met, urban water infrastructure challenges are nudging consumers towards dependable bottled alternatives, according to the Journal of Economics and Behavioral Studies. E-commerce platforms are seizing this opportunity, with projections indicating significant growth in Indonesia's online retail market, thereby establishing new distribution channels for bottled water brands. Furthermore, a noticeable shift towards smaller packaging formats and multi-pack offerings underscores the evolving consumption patterns of urban professionals and students.
Adoption of advanced purification and bottling technologies
Bottled water producers are enhancing product quality and cutting operational costs through technology adoption. Dumai City Water Treatment Plant's use of NX Filtration's hollow-fibre nanofiltration technology exemplifies how advanced filtration can transform challenging sources, like peat water, into safe drinking water. PT Tirta Sukses Perkasa's ozone treatment system, paired with UV disinfection, highlights a multi-barrier approach. This method not only ensures consistent water quality but also optimizes monitoring intervals to every 4 hours, all while upholding safety standards, as noted by the Journal of Food Engineering. Thanks to these technological strides, producers are tapping into previously unusable water sources, all while adhering to stringent quality mandates. The adoption of ISO 22000:2005 certification is becoming the norm. PT Sariguna Primatirta has set a new industry benchmark as the first Indonesian bottled water company to secure this pivotal food safety certification.
Restraints Impact Analysis*
| Restraint | (~) % Impact on CAGR Forecast | Geographic Relevance | Impact Timeline |
|---|---|---|---|
| Microplastic and nanoplastic health concerns | -0.7% | National, particularly urban areas | Short term (≤ 2 years) |
| Water scarcity and sustainability issues | -1.1% | Bali, Java, drought-prone regions | Long term (≥ 4 years) |
| Price sensitivity and intense competition | -0.9% | Rural areas, price-conscious segments | Medium term (2-4 years) |
| Strict regulatory compliance and costs | -0.5% | National, affecting all producers | Short term (≤ 2 years) |
| Source: Mordor Intelligence | |||
Microplastic and nanoplastic health concerns
Research by Buletin Keslingmas highlights a concerning trend: sun-exposed PET bottles contain 175 microplastic particles per liter, outpacing the 132.25 particles found in their unexposed counterparts[3]. In Makassar, assessments by the Global Journal of Environmental Science and Management identified risk quotients exceeding 1 for PET microplastic exposure, indicating potential organ inflammation and shifts in the immune system[4]. These alarming findings are prompting consumers to opt for pricier glass packaging and more sophisticated filtration systems. Responding to this heightened awareness, the Indonesian government has mandated warnings for BPA leaching, underscoring the mounting regulatory focus on packaging safety. This move could hasten the shift to alternative materials. In tandem, companies are investing significant resources in research and development for safer packaging solutions, although the associated transition costs pose challenges, particularly for smaller entities, which may compromise their short-term profitability.
Water scarcity and sustainability issues
Water resource constraints are intensifying across Indonesia's key markets. In Bali, the tourism sector consumes 65% of available fresh water resources, creating conflicts between commercial and community needs, according to the Global Sustainable Tourism Council. Surabaya faces a projected water deficit of 3,062 liters per second by 2024, highlighting infrastructure limitations that could restrict bottled water production capacity, as reported by IOP Conference Series: Earth and Environmental Science. Climate change impacts are worsening seasonal water availability variations, compelling producers to diversify source locations and invest in water conservation technologies. The Indonesian government's Indonesia Emas 2045 vision prioritizes sustainable water management, which may result in stricter extraction regulations and higher compliance costs for bottled water companies, according to the Persatuan Perusahaan Air Minum Seluruh Indonesia. These sustainability requirements are driving innovation in water recycling and conservation technologies, though implementation costs may limit growth for resource-intensive operations.
*Our forecasts treat driver/restraint impacts as directional, not additive. The impact forecasts reflect baseline growth, mix effects, and variable interactions.
Segment Analysis
By Product Type: Still Water Dominance Amid Functional Innovation
In 2025, still water commands a dominant 88.15% market share, underscoring Indonesian consumers' preference for pure hydration. Yet, the functional and flavored water segments are surging, boasting an 8.32% CAGR through 2031. This growth is largely fueled by health-conscious millennials and Gen Z, who are on the lookout for added nutritional benefits. While sparkling water has traditionally occupied a niche, it's now gaining momentum, especially in urban locales and upscale dining, with expatriates leading the charge. The functional water realm, which includes alkaline, vitamin-enhanced, and oxygenated variants, sees brands like SuperO2 and Pristine 8.6+ making waves with targeted health claims.
Companies are redefining the functional water arena with premium positioning strategies, using scientific research as a tool to command higher prices and stand apart from standard still water. PT Sariguna Primatirta's foray into diverse functional variants is a testament to how industry stalwarts are capitalizing on the premiumization trend. Digital marketing, especially on social media, plays a pivotal role in this segment's growth, enlightening consumers about health benefits and resonating particularly with younger audiences. Meanwhile, BPOM's stringent food safety regulations bolster quality assurance across all water types, instilling consumer confidence and bolstering premium pricing for functional variants.


By Packaging Material: PET Dominance Challenged by Sustainability
In 2025, PET bottles dominate the market with an 88.68% share, thanks to their cost efficiency, lightweight nature, and well-established supply chains spread across Indonesia's diverse geography. Meanwhile, glass bottles are rapidly gaining traction, boasting the fastest growth rate at an 8.05% CAGR. Their rise is fueled by a premium market positioning, heightened sustainability concerns, and their ability to preserve taste, making them a favorite among discerning consumers. Although aluminum cans and bottles hold a smaller market share, they're witnessing growth, especially in the functional and sparkling water segments. Here, the metallic packaging not only boosts perceived quality but also enhances shelf appeal.
As environmental regulations tighten and awareness of plastic pollution rises, the packaging industry is witnessing a significant transformation. In a notable move towards circular economy principles, Coca-Cola, via PT Amandina Bumi Nusantara, has rolled out 100% recycled PET bottles. This initiative sees the company processing a substantial 3,000 tonnes of used PET bottles monthly, as highlighted by Starlinger. Further underscoring the industry's shift, AQUA has pledged to incorporate 50% recycled content by 2025, while MOUNTOYA is making waves with its label-free packaging innovation. These moves highlight how sustainability is evolving into a key competitive edge. Additionally, with the Indonesian government mandating warnings on BPA leaching, there's a swift pivot towards BPA-free materials. This shift not only underscores a commitment to health and safety but also opens doors for innovative packaging solutions that harmonize cost, convenience, and environmental stewardship.
By Pricing: Mass Market Stability with Premium Growth
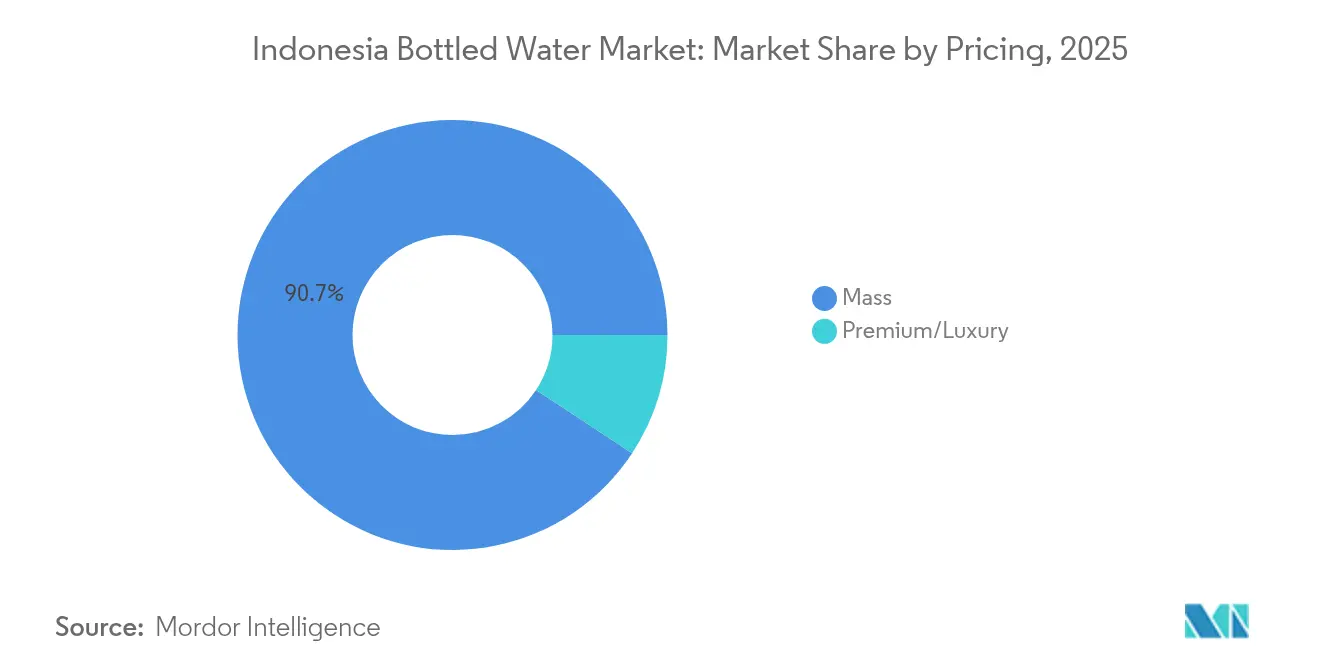
In 2025, mass market segments command a dominant 90.74% share, underscoring Indonesia's price-sensitive consumer landscape where affordability drives household purchases. Meanwhile, premium and luxury segments are on a growth trajectory, expanding at a 7.79% CAGR through 2031. This surge is buoyed by rising disposable incomes within Indonesia's burgeoning middle class, projected to swell to 135 million by 2030, as reported by Food Export. The pricing dynamics mirror the nation's economic stratification: urban consumers are increasingly inclined to pay a premium for perceived health benefits, enhanced taste, and eco-friendly packaging. Companies are honing their pricing strategies, adeptly segmenting portfolios to harness value across diverse income brackets.
PT Sariguna Primatirta exemplifies this nuanced approach with its multi-brand strategy. Cleo caters to the mass market, while SuperO2 and Vio8+ are tailored for health-conscious premium consumers, as highlighted by IDN Financials. The premium segment's ascent is bolstered by educational marketing, spotlighting quality differentiators, source purity, and cutting-edge processing technologies. E-commerce platforms are revolutionizing premium product distribution, slashing traditional retail markups and fostering direct-to-consumer ties that justify elevated price points. However, BPOM's halal certification mandates, as per PP No. 42 Tahun 2024, introduce added compliance costs. While these may squeeze margins in price-sensitive segments, they simultaneously bolster the premium stature of certified products.
By Distribution Channel: Off-Trade Dominance with On-Trade Recovery
In 2025, off-trade channels command a dominant 77.95% market share, led by convenience stores, supermarkets, and traditional retail outlets, ensuring widespread accessibility across Indonesia's varied landscape. Meanwhile, on-trade channels are witnessing a robust growth rate of 7.44% CAGR through 2031, fueled by a resurgence in the hospitality sector, a boom in tourism, and modernizing foodservice initiatives. Convenience giants, Indomaret and Alfamart, are pushing their boundaries beyond Java island, unlocking fresh distribution avenues for bottled water brands in regions previously deemed underserved.
The distribution scene is undergoing a seismic shift, with e-commerce platforms taking center stage. TikTok Shop, now a formidable e-commerce contender, finds a significant foothold in Indonesia, boasting nearly 70% of its regional user base, thus paving the way for novel digital distribution avenues for bottled water brands. While traditional markets still command a hefty 76% share of the food and beverage sector, they're gradually ceding territory to modern retail formats. These newer formats, as highlighted by the USDA, excel in inventory management and boast cold chain capabilities, both crucial for effective bottled water distribution. Looking ahead, the Indonesian retail sector anticipates a 5% growth in 2025, spurred by collaborations between modern retailers and traditional outlets. This partnership is forging integrated distribution networks, amplifying market reach for bottled water brands.
Geography Analysis
In 2025, Java island commands a dominant 61.88% market share, capitalizing on its dense population, advanced infrastructure, and well-established distribution networks for efficient market penetration. Kalimantan, with a robust 7.12% CAGR projected through 2031, is reaping rewards from its natural resource developments, infrastructure investments, and initiatives aimed at economic diversification, all of which are broadening its consumer base. Sumatra boasts a diverse economic landscape, spanning agriculture to manufacturing, while Sulawesi is poised for growth, driven by tourism and budding industrial hubs. As companies look to expand beyond the saturated markets of Java, regional growth strategies are becoming paramount. PT Sariguna Primatirta is making a bold move with a planned Rp 600 billion capital expenditure in 2025, setting up new facilities in Palu, Pontianak, and Pekanbaru, underscoring its commitment to geographic diversification and cutting logistics costs.
Indonesia's Proyek Strategis Nasional has not only generated a whopping Rp 1,993 trillion in economic output but also created 5.4 million jobs, enhancing market access in previously neglected areas, according to ERIA. As the tourism sector flourishes, emerging destinations are witnessing a surge in demand. Notably, Bali's tourism, which accounts for 65% of the island's fresh water consumption, underscores the sector's profound influence on bottled water trends. The "Rest of Indonesia" segment includes a myriad of smaller islands and budding markets. Here, infrastructure advancements and economic growth are paving the way for new bottled water distribution avenues. However, these regions present logistical hurdles and sparser populations, necessitating tailored market entry approaches.
Regulatory Landscape
Indonesia regulates packaged drinking water (AMDK) through a dual compliance layer led by BPOM for product registration and market surveillance, and by Kementerian Perindustrian for mandatory national standards. Under Permenperin No. 62 Tahun 2024, mandatory SNI for five AMDK categories is scheduled to take effect in October 2026, covering Air Mineral (SNI 3553:2023), Air Demineral (SNI 6241:2023), Air Mineral Alami (SNI 6242:2023), Air Minum Embun (SNI 7812:2021), and Air Minum pH Tinggi (SNI 8982:2021). The framework applies to producers, importers, and distributors, with certification administration routed via SIINas, tightening documentation and audit readiness as the effective date approaches.
BPOM continues risk-based pre-market and post-market controls across water source, processing, packaging, and labeling, including distribution permits (MD for domestic and ML for imported products). As of June 2026, BPOM cited 8,721 registered AMDK products, alongside increased scrutiny of industry compliance in 2025 monitoring, reinforcing that labeling and advertising discipline are becoming as material as production controls. In parallel, BPOM communications around reusable gallons emphasize that only products with official BPOM permits and SNI certification qualify as safe for use, keeping formal certification central to consumer-facing trust in the gallon segment.
Competitive Landscape
In the competitive landscape, Danone-AQUA, Le Minerale, and Cleo dominate with the largest volumes. Leveraging a legacy of half a century, AQUA boasts a distribution network that spans 97% of modern retail outlets and has committed to incorporating 50% recycled content by 2025. PT Mayora Indah capitalizes on snack-beverage synergies, promoting Le Minerale through strategic cross-promotions. Cleo sets itself apart with a low-TDS positioning and has unveiled an ambitious IDR 600 billion expansion plan, establishing plants in Palu, Pontianak, and Pekanbaru.
Sustainability has emerged as a pivotal focus. Coca-Cola's introduction of a 100% rPET bottle and MOUNTOYA's innovative label-free packaging have set new benchmarks for consumer expectations. Meanwhile, smaller regional players are weaving artisanal spring narratives and community initiatives into their branding to cultivate loyalty. While larger firms leverage technology, like real-time quality monitoring, to bolster their credibility, newcomers are finding success with compact modular lines, allowing them to align production with demand. Regulatory changes, such as BPA labeling and halal mandates, pose challenges. These shifts not only benefit well-capitalized incumbents but also highlight innovators whose compliance stories resonate with the millennial demographic in Indonesia's bottled water sector.
E-commerce is reshaping traditional retail dynamics, enabling direct-to-consumer brands to emerge swiftly through targeted advertising. TikTok's algorithm, with its emphasis on storytelling, is successfully converting trend-focused youth into product trialists. Bottlers are forging strategic partnerships with logistics-tech companies, ensuring the integrity of last-mile cold-chain deliveries. Industry associations are advocating for incentives on recycled content to mitigate associated cost premiums. Despite these developments, opportunities remain in functional water, rural market penetration, and package-free dispensers. Brands that can seamlessly blend environmental responsibility with affordability are poised to influence market share trends leading up to 2030.
Indonesia Bottled Water Industry Leaders
-
The Coca-Cola Company
-
Nestle SA
-
Danone SA
-
PT Mayora Indah Tbk
-
PT Sariguna Primatirta Tbk
- *Disclaimer: Major Players sorted in no particular order
Market Opportunities and Future Outlook
The October 2026 transition to mandatory SNI across five AMDK categories creates near-term demand for accredited testing, certification services, and factory upgrades that reduce non-compliance risk, particularly for smaller regional bottlers that must align documentation and audits through SIINas. Industry and association activity around readiness programs, including technical training and local certification support, points to pull for standardization enablers such as quality systems, traceability, and packaging and labeling controls that fit within BPOM oversight.
PET and PP cost volatility is also pushing manufacturers to examine circular packaging supply and efficiency levers, creating opportunities for local food-grade recycled resin integration and packaging-lighting formats where feasible. Sustainability-linked operational upgrades show continued investment pathways: Danone has implemented rooftop solar (PLTS Atap) across multiple AQUA plants (8.12 MWp) and added a new installation at its Prambanan factory (828 kWp) in 2026, offering a scalable template for energy-cost management in water bottling. At the same time, brand activity around advanced purification and health-positioned variants, including high-pH and nano-purification claims, supports differentiated functional offerings and safer single-use or controlled-use formats that address consumer concerns around container reuse and packaging safety.
Recent Industry Developments
- July 2026: Danone SN Indonesia inaugurated a rooftop solar power plant (PLTS Atap) at its Prambanan factory in Central Java. The project adds to Danone AQUA’s broader manufacturing decarbonization footprint in Indonesia and ties bottled water operations to energy-efficiency and cost-control initiatives at plant level.
- January 2025: PT Sariguna Primatirta Tbk (CLEO) announced a Rp 600 billion capital expenditure allocation for 2025 to expand production and distribution capacity, including new facilities in Palu, Pontianak, and Pekanbaru. The build-out supports geographic diversification beyond core Java demand centers and strengthens service levels across the archipelago by reducing logistics distance to eastern and outer-island markets.
- November 2024: Coca-Cola launched 100% recycled PET bottles in Indonesia through a partnership with PT Amandina Bumi Nusantara. The initiative underpins a circular packaging supply chain by scaling local rPET use and raises the competitive bar for sustainability claims in PET-dominated bottled water packaging.
Research Methodology Framework and Report Scope
Market Definition and Coverage
For this study, the market covers packaged drinking water sold in Indonesia through retail and on-trade routes, including still, sparkling, and functional bottled water across common pack sizes and materials.
Scope exclusions: This sizing does not count unpackaged or piped drinking water, home filtration equipment, or bulk tanker water supplied directly without branded packaging.
Segmentation Overview
- By Product Type
- Still Water
- Sparkling Water
- Functional Water
- Flavoured Water
- By Packaging Material
- PET Bottles
- Glass Bottles
- Aluminum Cans and Bottles
- Others
- By Pricing
- Mass
- Premium/Luxury
- By Distribution Channel
- On-trade
- Off-trade
- Supermarkets/Hypermarkets
- Convenience/Grocery Stores
- Home and Office Space
- Online Retail
- Other Off-trade channels
- By Region
- Java
- Sumatra
- Kalimantan
- Sulawesi
- Rest of Indonesia
Data Sources, Market Sizing, and Validation
Desk Research
Desk research was used to set the fact base for Indonesia consumption patterns and the packaged beverage context before any modeling was finalized. We referenced public sources such as Statistics Indonesia (BPS) releases, Bank Indonesia macro series, Indonesia Ministry of Industry updates, Indonesia Ministry of Trade publications, and UN Comtrade trade statistics to understand demand direction and price pressure.
To ground the market in real commercial behavior, we also reviewed company annual reports and investor presentations (where available), product labeling and regulatory notes shared on official portals, and reputable press coverage on capacity additions and distribution shifts. Select paid subscriptions for company financials and for shipment level import and export checks were used to cross-verify a few sensitive assumptions, including packaging input exposure and currency timing. The sources listed above are illustrative rather than exhaustive, and many other public materials were also reviewed to collect data, validate it, and clarify open questions.
Primary Interviews and Surveys
Primary work focused on validating what drives value growth in Indonesia bottled water, including pricing ladders by pack format, channel mix shifts, and how quickly functional variants are expanding in modern trade and online. We spoke with a mix of brand owners, distributors, packaging ecosystem participants, and trade experts across major islands to test desk assumptions and close gaps where public data is not granular.
Distribution of primary research fieldwork respondents
| Company type | Respondent position |
|---|---|
| Top tier: 27% | CXOs: 14% |
| Mid tier: 59% | Functional/Unit leaders: 39% |
| Smaller Players: 14% | Managers: 47% |
Market-Sizing & Forecasting
The market was sized using a top-down approach where beverage consumption signals, packaged water penetration, and the channel sales structure are reconstructed into a value pool for Indonesia, and then checked against selective bottom-up approximations. Those bottom-up checks relied on sampled brand and pack pricing, retailer and distributor feedback on volumes, and a sanity check on visible capacity and route-to-market coverage so totals could be adjusted if they drifted.
Key inputs in the model included population and urbanization direction, per capita packaged water consumption trends, still versus sparkling and functional mix, pack size shifts (single-serve versus multi-serve and gallon formats), and observed retail price movement by channel. Where direct splits were not consistently disclosed, gaps were handled using proxy ratios from interviews and by applying conservative ranges that were later narrowed through channel checks.
For forecasting, we used scenario analysis supported by trend fitting, with year-on-year changes tied to macro indicators, expected pricing progression, and channel expansion speed. Assumptions were revisited until the forecast path matched what industry participants described as practical, especially around premiumization and discounting cycles.
Data Validation & Update Cycle
Outputs were validated through triangulation across independent signals, including trade movement cues, public macro series, and channel level reality checks from interviews. Variances were flagged when growth or pricing implied outcomes that conflicted with demand constraints, distribution reach, or pack mix logic, and then the underlying drivers were reworked and re-tested.
A multi-step internal review is followed before sign-off, and any weak points trigger re-contact with sources to confirm the assumption rather than forcing the model to fit. The report is refreshed annually, and interim updates are done when material events occur, such as major tax changes, sharp currency moves, or large capacity additions. Before delivery, a final analyst pass is completed so clients receive the latest updated view.
Mordor Intelligence's Indonesia Bottled Water Market Market Size Measured Against Other Published Estimates
Published market sizes for Indonesia bottled water can look different even when they seem to talk about the same product, because the scope and the timing are rarely aligned. Differences usually come from what is counted as bottled water, which channels are included, and whether the estimate is anchored to measured consumption signals or to broader beverage spending.
A large spread also comes from how pack formats are treated, since some sources fold in refill gallons and dispensers more aggressively, while others keep the scope tighter around branded packaged water sold through defined retail and on-trade points. Currency conversion timing and how fast price per liter is assumed to rise also moves the value number, especially when inflation and promotions shift quickly. The figure is kept tied to a defined bottle-only demand pool by re-checking pack mix and channel pricing each refresh cycle, which is applied by Mordor Intelligence.
Benchmark comparison
| Source | Market Size | Gaps in Research Methodology |
|---|---|---|
| Mordor Intelligence | USD 3.92 B (2025) | |
| Industry Publisher A | USD 3.50 B (2025) | Uses a narrower value build that can understate modern trade pricing and functional water uplift, and the island level channel mix appears to be simplified. |
| Research Platform B | USD 3.80 B (2024) | Anchors the base year earlier and applies a faster growth and pricing curve, with broader inclusion of certain packaged water formats that may not align with a strict bottled-water-only scope. |
The table shows that the headline gap is not only about growth rates, it is also about what is counted and how prices are translated into value. When scope is clearly stated and tested through pack mix, channel pricing, and timing checks, the final market size becomes easier to reproduce and compare year to year.
Key Questions Answered in the Report
What is the current value of the Indonesia bottled water market?
The market is valued at USD 4.17 billion in 2026 and is forecast to reach USD 5.7 billion by 2031.
Which product type leads sales in Indonesia?
Still water dominates with an 88.15% share in 2025, though functional and flavored waters post the fastest growth.
How fast is the premium bottled water segment expanding?
Premium and luxury offerings are advancing at a 7.79% CAGR, driven by rising disposable incomes and health awareness.
Which region is the fastest-growing market inside Indonesia?
Kalimantan leads with a projected 7.12% CAGR through 2031, supported by infrastructure development and rising incomes.