
Market Overview
| Study Period | 2021 - 2031 |
|---|---|
| Forecast Data Period | 2026 - 2031 |
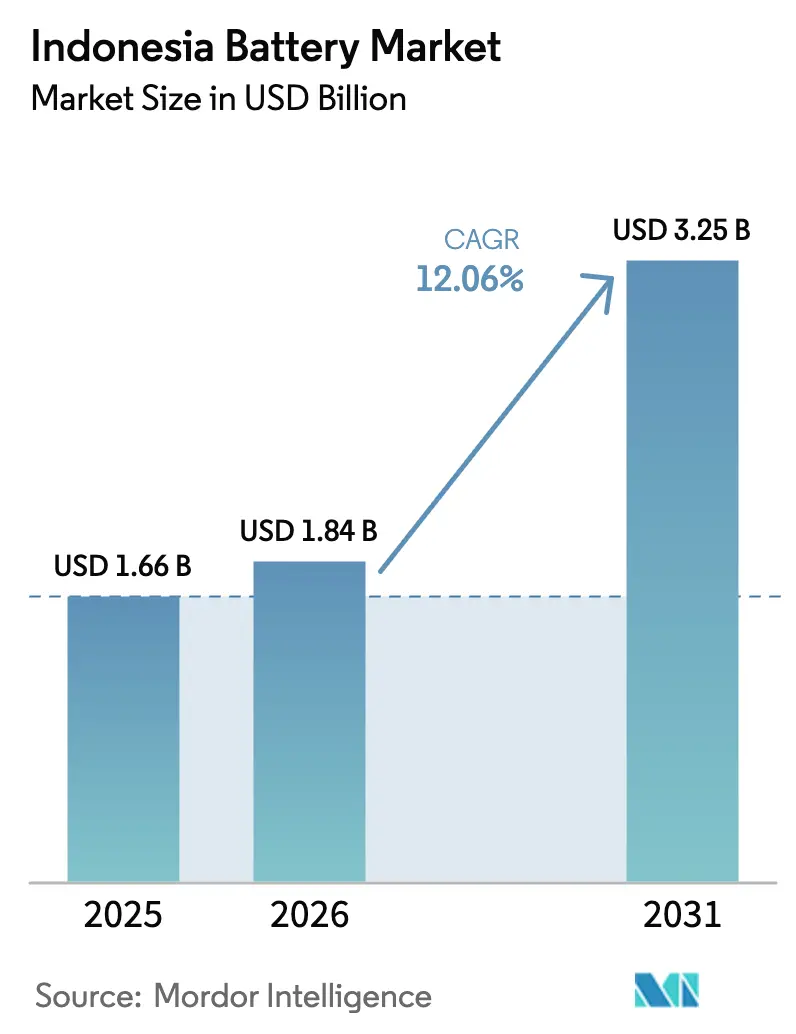
| Base Year Market Size (2025) | USD 1.66 Billion |
| Market Size (2026) | USD 1.84 Billion |
| Market Size (2031) | USD 3.25 Billion |
| Growth Rate (2026 - 2031) | 12.06 % |
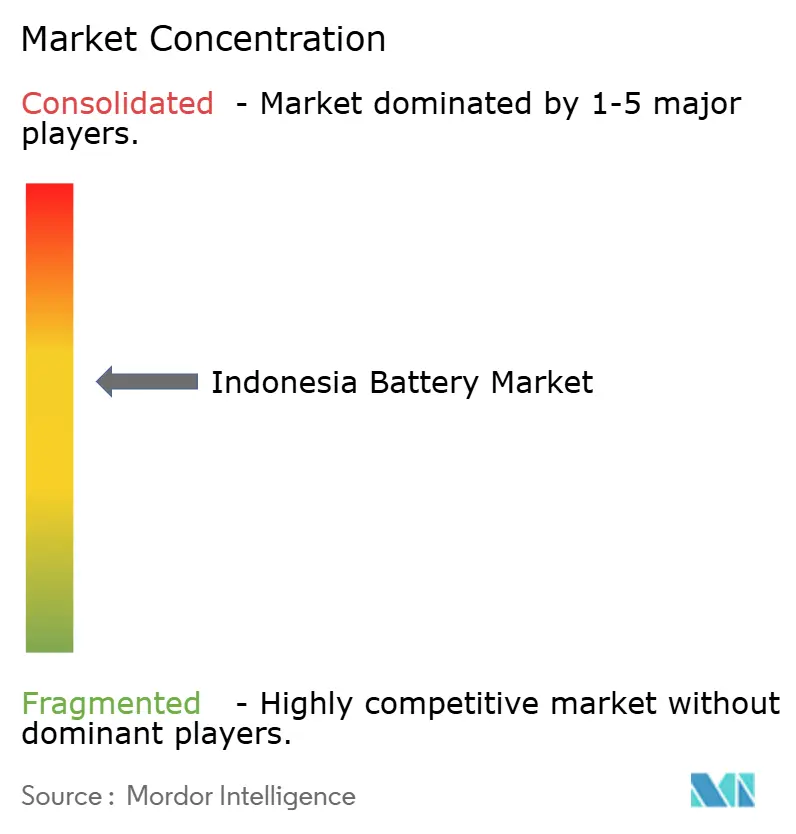
| Market Concentration | Medium |
Major Players *Disclaimer: Major Players sorted in no particular order Image © Mordor Intelligence. Reuse requires attribution under CC BY 4.0. | |
Indonesia Battery Market Analysis by Mordor Intelligence
The Indonesia Battery Market size was valued at USD 1.66 billion in 2025 and is estimated to grow from USD 1.84 billion in 2026 to reach USD 3.25 billion by 2031, at a CAGR of 12.06% during the forecast period (2026-2031).
The growth path reflects Jakarta’s move from raw-ore exporter toward integrated cell manufacturing, underpinned by 55 million t of nickel reserves, aggressive electric-vehicle (EV) targets, and steady utility-scale storage auctions.[1]U.S. Energy Information Administration, “International Energy Outlook 2025,” eia.gov Secondary batteries captured 91.3% value in 2025; lithium-ion technology led with 60.2%, while solid-state pilots signal the next step in energy-density gains. Automotive demand is scaling fastest as fiscal incentives reshape two-wheel and four-wheel assembly economics. Competitive intensity stays moderate: Chinese groups finance 61% of nickel refining and most gigafactory projects, whereas South Korean and Japanese peers recalibrate strategy after LG Energy Solution’s April 2025 exit.
Key Report Takeaways
- By battery type, secondary batteries held 91.3% of Indonesia's battery market share in 2025, and the segment will rise at a 13.1% CAGR to 2031.
- By technology, lithium-ion technology led with 60.2% share in 2025; while solid-state is forecast to post the fastest growth, advancing at a 20.9% CAGR from a small 2025 base.
- By application, automotive commanded a 37.6% value in 2025, and the same is set to deliver a 15.5% CAGR through 2031.
- North Maluku and Central Sulawesi host 59% of the country's mined nickel output, anchoring long-term downstream value capture.
Note: Market size and forecast figures in this report are generated using Mordor Intelligence’s proprietary estimation framework, updated with the latest available data and insights as of January 2026.
Indonesia Battery Market Trends and Insights
Drivers Impact Analysis*
| Driver | (~) % Impact on CAGR Forecast | Geographic Relevance | Impact Timeline |
|---|---|---|---|
| Abundant domestic nickel resources enabling downstreaming policy | +3.2% | North Maluku, Central & Southeast Sulawesi | Long term (≥ 4 years) |
| Surge in EV and e-motorcycle investments backed by fiscal incentives | +2.8% | Greater Jakarta, Bandung, Surabaya | Medium term (2-4 years) |
| Rapid uptake of consumer electronics and IoT devices | +1.5% | Java, Bali, major Sumatra cities | Short term (≤ 2 years) |
| Utility-scale energy-storage tenders to balance renewables | +2.1% | Priority PLN grid zones | Medium term (2-4 years) |
| Battery-as-a-Service swap-station roll-outs by ride-hailing firms | +1.3% | Java corridor, eight pilot cities | Short term (≤ 2 years) |
| Source: Mordor Intelligence | |||
Abundant Domestic Nickel Resources Enabling Downstreaming Policy
Indonesia produced 2.2 million t of nickel in 2024, equal to 59% of global output, while its 2020 ore-export ban forced in-country processing, expanding smelter count from 2 to 44 within eight years. The policy attracted USD 32 billion in pledged battery-chain capital but concentrated 61% of refining capacity with Chinese firms, creating dependency on foreign know-how. ESG pressure around HPAL’s 20–25 kg CO₂-equivalent profile now compels renewable power integration, increasing project capex.[2]Government of Indonesia, “Mineral Downstream Roadmap,” go.id CATL’s USD 6 billion Karawang complex illustrates the shift, linking nickel feed through closed-loop recycling to meet strict export-market traceability rules.
Surge in EV & e-Motorcycle Investments Backed by Fiscal Incentives
Jakarta allocated IDR 7 trillion subsidies, cut VAT from 11% to 1%, and waived import duties for qualifying models, lifting 2024 EV sales 73% year-over-year to 44,557 units. Yet total cost-of-ownership parity still needs 84 km daily mileage versus the current 34 km average, so up-front subsidies stay critical. TKDN thresholds jump to 60% in 2027 and 80% in 2030, pushing OEMs to localize packs and motors; Hyundai-LG’s 10 GWh line and BYD’s 150,000-unit plant are early movers. Ride-hailing fleets showcase battery-swap viability, with Grab and Gojek fielding 10,000+ two-wheel EVs across eight cities, supported by 1,200 swap stations.
Rapid Uptake of Consumer Electronics and IoT Devices
Indonesia’s smartphone and connected-device boom supports steady demand for small-format lithium-ion cells even as global share tilts to EVs. PT International Chemical Industry shifted from alkaline staples to lithium production under the ABC brand, mirroring wider retooling among legacy dry-cell makers. Domestic pack assembly benefits from supply-chain diversification out of North-East Asia, yet a lack of local lithium and cathode precursor production caps upstream gains.
Utility-Scale Energy-Storage Tenders to Balance Renewables
PLN’s 2025-2034 plan calls for 10.3 GW storage, with 3.5 GW to be online by 2030, spurring bids from CATL, Rept Battero, and CLOU Electronics. A 50 MW solar-plus-14.2 MWh BESS project in Nusantara proved cost savings of 30-40% on diesel peaking. Still, the absence of a capacity market forces merchant-risk models, delaying green-island deployments.
Restraints Impact Analysis*
| Restraint | (~) % Impact on CAGR Forecast | Geographic Relevance | Impact Timeline |
|---|---|---|---|
| Dependence on imported lithium salt & precursor chemicals | -1.8% | National, affecting all battery manufacturers | Long term (≥ 4 years) |
| Patchy charging / swap infrastructure outside Java corridor | -1.2% | Sumatra, Kalimantan, Sulawesi, Papua, Nusa Tenggara | Medium term (2-4 years) |
| ESG scrutiny of HPAL nickel processing raising financing risk | -1.5% | National, concentrated in North Maluku, Central Sulawesi smelting zones | Long term (≥ 4 years) |
| Commodity-price volatility eroding margin planning | -1.0% | National, with spillover effects on export-oriented manufacturers | Short term (≤ 2 years) |
| Source: Mordor Intelligence | |||
Dependence on Imported Lithium Salt & Precursor Chemicals
With no economic lithium reserves, manufacturers import carbonate and hydroxide mainly from China and, since August 2025, Australia, exposing cost bases to price swings that ranged USD 6,000–83,000 t between 2020 and 2024.[3]International Renewable Energy Agency, “Lithium-ion supply–demand update 2025,” irena.org CATL’s Karawang hub can process 30,000 t cathode annually but still needs imported feed, limiting margins. China’s graphite export controls add another layer of supply-chain fragility, prompting UNOPS to urge stockpiling and recycling mandates, none legislated yet.
Patchy Charging / Swap Infrastructure Outside Java Corridor
Indonesia had only 588 public chargers nationwide by end-2022, mostly in Jakarta, Bandung, and Surabaya, versus PLN’s 7,146-unit goal for 2030. A 2024 PwC survey showed 65% of consumers see limited infrastructure as the top EV barrier. Swap networks mitigate urban anxiety but require land, cooling, and battery inventory, making payback tough in low-density regions. Grid codes for third-party chargers remain unpublished, delaying private investment beyond Java.
*Our forecasts treat driver/restraint impacts as directional, not additive. The impact forecasts reflect baseline growth, mix effects, and variable interactions.
Segment Analysis
By Battery Type: Rechargeable Cells Dominate Value and Volume
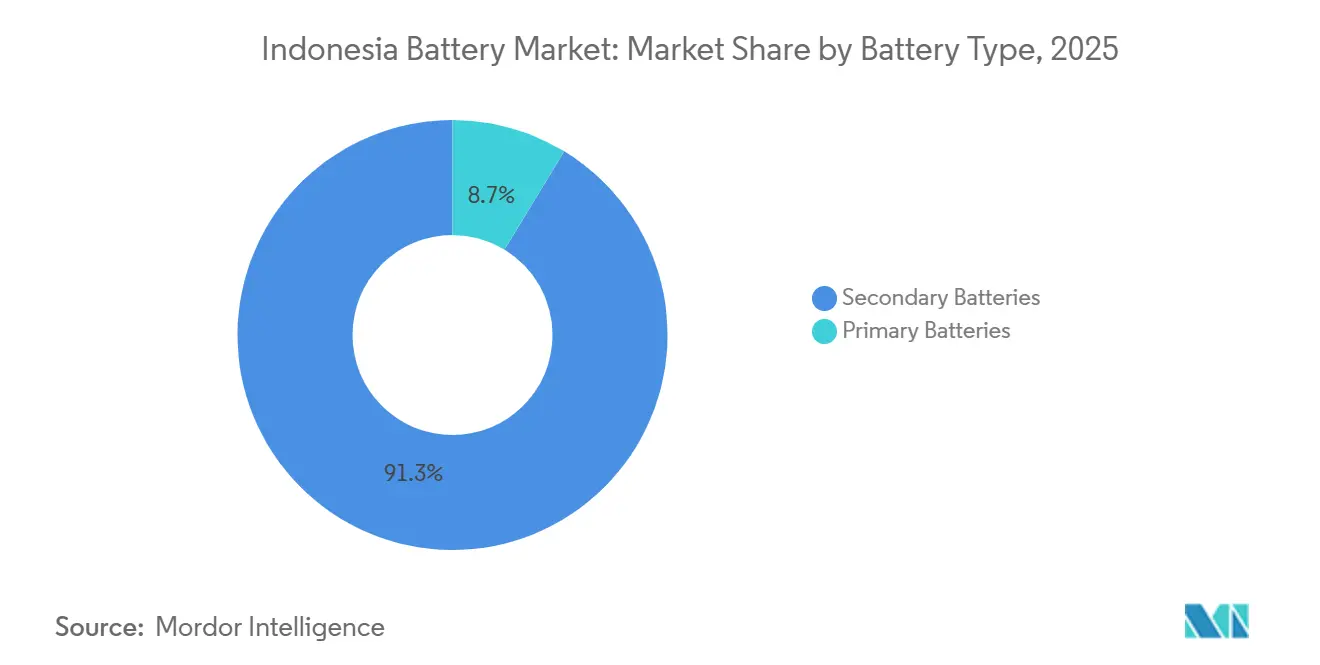
Rechargeable cells secured 91.3% of the Indonesian battery market share in 2025 and will expand at a 13.1% CAGR to 2031, lifted by EV mandates and renewable-balancing storage. Primary formats face structural decline as consumers migrate to USB-rechargeable devices. CATL, Hyundai-LG, and BYD installations bring Indonesia's battery market size for secondary cells toward the government's 140 GWh 2030 target, though lithium-import exposure endures. Regulation No. 69/2024 raises safety hurdles for primary cells, accelerating consolidation among low-cost importers.
Legacy dry-cell leader PT Intercallin hedged by adding lithium output, while niche primary use persists in remote controls and medical devices. Yet rechargeable uptake in off-grid solar lanterns and rural devices erodes even these pockets. Pressure on lead-acid starter-battery lines also rises as premium car segments adopt lithium-ion SLI replacements.


By Technology: Lithium-Ion Leads, Solid-State Emerges as Long-Term Disruptor
Lithium-ion held a 60.2% share in 2025 and anchors most near-term growth; Indonesia's battery market size for lithium-ion packs will expand as Karawang and Karawang-adjacent clusters ramp to 26.9 GWh by 2026. Lead-acid units retain dominance in aftermarket SLI but cede ground in motive and renewable storage due to lower energy density. Solid-state prototypes, though nascent, register a 20.9% CAGR on pilot shipments, hinting at 400–500 Wh/kg horizons by decade-end.
National Battery Research Institute prioritizes solid-state R&D, yet commercial tooling hurdles, high sintering temperatures, and dendrite management delay mass rollout. Sodium-ion has the potential to cut lithium dependence as soda ash is plentiful, but 95% of global capacity announcements sit in China, leaving Indonesian access uncertain. Flow batteries and sodium-sulfur remain niche for >4-hour grid use, adopted case-by-case in isolated diesel grids under donor funding.
By Application: Automotive Segment Outpaces Industrial and Portable
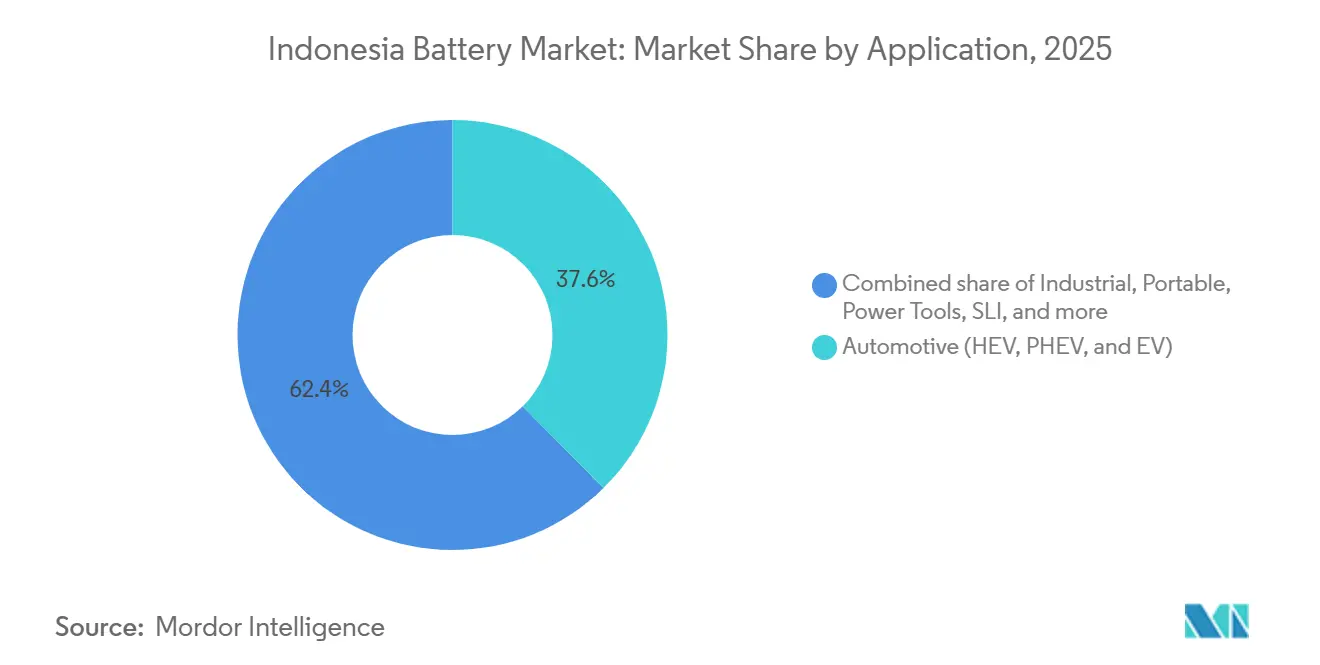
Automotive batteries captured 37.6% value in 2025 and are set for a 15.5% CAGR to 2031, the quickest across end uses. Indonesia's battery market share for EV packs will climb as Hyundai-LG, BYD, and Polytron escalate localized sourcing. The industrial (motive, telecom, UPS) segment sees mid-single digit growth, while portable devices gradually cede volume share as packs become non-replaceable.
Government targets of 600,000 electric cars and 13 million e-motorcycles by 2030 equate to 36.8 GWh annual pack demand, dwarfing the 10 GWh operational capacity in 2025. Polytron's battery-subscription SUVs illustrate how lower entry costs can unlock middle-class demand, though dependence on Chinese LFP cells limits deep local value capture. Power-tool battery growth hinges on industrial diversification, yet no Indonesian cell maker has announced dedicated high-drain cylindrical lines, keeping imports high.
Geography Analysis
Java dominates production, hosting CATL, Hyundai-LG, BYD, and Polytron facilities, thanks to ports, skilled labor, and proximity to auto OEMs. Upstream nickel lies 1,500 km east in North Maluku and Central Sulawesi, forcing inter-island logistics that inflate costs and carbon footprints. CATL’s dual-site model moves mixed hydroxide precipitate by sea to Karawang, balancing ore proximity with downstream clustering.
Sumatra and Kalimantan lag in both factories and chargers, yet they have high renewable potential suitable for microgrids. PLN’s 10.3 GW storage goal directs initial deployments to diesel-heavy outer islands, but tariff frameworks remain undefined, slowing build-out. Government swap-station targets imply eventual spread beyond the current eight-city footprint, but capital recovery remains uncertain in sparsely populated provinces.
Export-oriented growth depends on meeting EU battery passport and U.S. IRA rules. Heavy Chinese investment complicates North American market access, while EU carbon-footprint caps raise pressure for renewable-powered smelting. Indonesia Battery Corporation is courting non-Chinese partners to diversify offtake and mitigate tariff risk, though no deals were confirmed by end-2025.
Regulatory Landscape
Indonesia’s battery market is shaped by EV industrial policy and electricity-sector rules. Presidential Regulation No. 55/2019 anchors the national battery electric vehicle (BEV) program and supports domestic battery industry development, while the Ministry of Energy and Mineral Resources (MEMR) and its Directorate General of Electricity set technical and licensing requirements that affect charging, swapping, and grid-connected storage.
For charging and swapping infrastructure, MEMR Regulation No. 1/2023 governs EV charging stations (SPKLU) and battery swap stations (SPBKLU), standardizing permitting and technical provisions for nationwide rollout. On power-system integration, Government Regulation No. 25/2021 recognizes battery energy storage systems (BESS) as essential supporting services, and MEMR Regulation No. 5/2025 introduces deemed dispatch for renewable plants integrated with BESS, supporting project bankability for hybrid deployments that align with PLN’s RUPTL 2025-2034 storage buildout agenda.
Competitive Landscape
Chinese firms control 61% of nickel refining and most announced gigafactory capacity, positioning CATL, BYD, Huayou Cobalt, CNGR, and Rept Battero as dominant investors. South Korean and Japanese incumbents retain expertise but reassess exposure after LG Energy Solution’s USD 9.8 billion pull-out, replaced by Huayou Cobalt in April 2025. Domestic entrants leverage state incentives: Polytron’s SUV line and Indonesia Battery Corporation’s swap-station alliances seek share in value-sensitive segments, though each relies on foreign cell technology.
White-space opportunities include sodium-ion production, hard-carbon anodes from biomass, and digital battery-passport services. BTR New Materials' 80,000 t anode plant at Morowali sets a precedent for upstream materials localization, yet graphite export curbs add volatility. Certification complexity under IEC 62133 and differing national deviations still raises costs for mid-tier Indonesian exporters, incentivizing bundled testing services by TÜV Rheinland and SGS.[4]TÜV Rheinland Indonesia, “Battery Certification Pathways 2025,” tuv.com
Indonesia Battery Industry Leaders
GS Yuasa Corporation
PT Century Batteries Indonesia (Nipress)
CATL
PT Indonesia Battery Corporation (IBC)
PT Motobatt Indonesia
- *Disclaimer: Major Players sorted in no particular order

Market Opportunities and Future Outlook
Indonesia’s largest near-term whitespace is the conversion of downstreaming policy into bankable, end-to-end cell and pack production that links EV demand with PLN-led storage procurement. The integrated EV battery ecosystem designated as a National Strategic Project (PSN) connects upstream nickel processing in Halmahera with downstream manufacturing in Karawang through state-linked participants (ANTAM and Indonesia Battery Corporation, IBC) alongside a CATL-led consortium, and stakeholders have cited the flagship project at around USD 5.9-6 billion, which opens room for local suppliers in utilities, construction, industrial gases, waste handling, and plant operations and maintenance.
Stationary storage is a second, separate pull-through channel for cells and packs beyond automotive. PLN’s RUPTL 2025-2034 targets large-scale BESS deployment (6 GW by 2034 in the plan), and the Karawang roadmap referenced by project stakeholders includes ESS alongside EV batteries (with phase 1 cited at 6.9 GWh and expansion pathways discussed up to 15 GWh). Beyond cell and pack supply, opportunity also sits in compliance and enablement services, including TKDN localization requirements, evolving SPKLU/SPBKLU implementation under MEMR Regulation No. 1/2023, and export-market traceability demands. These requirements are increasing demand for testing, certification, and battery passport-ready data systems, especially for pack assemblers and integrators seeking access to export destinations.
Recent Industry Developments
- June 2026: Indonesia’s Ministry of Downstreaming and Investment highlighted a target of around USD 121 billion in investment opportunities tied to an integrated EV battery ecosystem and value-added processing across strategic minerals. The statement reinforced downstreaming as a key lever for attracting large-scale battery supply-chain capital and pointed to continued prioritization of battery-related industrial projects across multiple commodities.
- January 2026: IBC and PT Aneka Tambang Tbk (ANTM) signed a framework agreement with a HYD Investment Limited consortium (including Zhejiang Huayou Cobalt and EVE Energy) to accelerate the Titan integrated battery ecosystem and nickel downstreaming initiative. The plan is framed around a 20 GWh battery production capacity and a USD 5-6 billion project scale, extending the pipeline of large integrated projects alongside the Karawang buildout.
- June 2025: IBC and CATL broke ground on an integrated battery project in Karawang, West Java, reported at about USD 5.9 billion in total investment, with a first-phase battery plant cited at 6.9 GWh of annual capacity. This move supported Indonesia’s shift from raw materials toward domestic cell manufacturing and reinforced a Java-based manufacturing cluster linked to upstream nickel processing.


Research Methodology Framework and Report Scope
Market Definition and Coverage
For this report, the Indonesia battery market is defined as revenues earned from batteries sold for domestic use across major end uses, covering primary and secondary batteries used in transport, industrial power, and portable devices.
Scope exclusions: This sizing excludes upstream mining and refining of battery raw materials, as well as standalone charging hardware and other non-battery power electronics.
Segmentation Overview
- By Battery Type
- Primary Batteries
- Secondary Batteries
- By Technology
- Lead-acid
- Li-ion
- Nickel-metal hydride
- Nickel-cadmium
- Sodium-sulfur
- Solid-state
- Flow Battery
- Emerging chemistries
- By Application
- Automotive (HEV, PHEV, and EV)
- Industrial (Motive, Stationary (Telecom, UPS, ESS), etc.)
- Portable (Consumer Electronics, etc.)
- Power Tools
- SLI
- Other Applications
Data Sources, Market Sizing, and Validation
Desk Research
Desk work started with building a clean fact base on Indonesia demand drivers and manufacturing signals, then aligning terminology across sources so the model does not mix unlike product categories. We referenced public datasets and official publications such as Indonesia's statistics agency (BPS), the Ministry of Energy and Mineral Resources, the Ministry of Industry, and customs and trade statistics released by the government. These sources helped frame import dependence and the direction of local output.
To connect batteries to end-market pull, we also used sources such as the International Energy Agency and the World Bank, along with relevant transport and energy publications, then cross-checked those findings using company annual reports, investor presentations, and credible local press coverage. Patent databases and a shipment-level import-export subscription were used selectively to understand chemistry shifts and where volume is moving, especially for lithium-based products. These examples are not exhaustive, and additional sources were reviewed for data collection, validation, and research clarification.
Primary Interviews and Surveys
Primary work was used to pressure-test what we saw in published data, since batteries are sold through mixed channels and end uses can be reported differently by each stakeholder. We spoke with a balanced mix of manufacturers, distributors, project-focused industrial buyers, and downstream users, including mobility and backup power. Inputs from these conversations were used to validate pricing ranges, channel margins, and adoption timing across Indonesia's major demand pockets.
Distribution of primary research fieldwork respondents
| Company type | Respondent position |
|---|---|
| Top tier: 33% | CXOs: 19% |
| Mid tier: 48% | Functional/Unit leaders: 26% |
| Smaller Players: 19% | Managers: 55% |
Market-Sizing & Forecasting
The market was sized mainly using a top-down build that reconstructs demand from Indonesia end-use activity and technology penetration, then translates that demand into value using realistic average selling prices by chemistry and application. We anchored the demand pool using indicators such as vehicle parc and new registrations (for SLI and traction batteries), EV and hybrid adoption signals, telecom tower and data-center backup needs, industrial motive battery usage, and consumer electronics shipment trends as practical proxies.
Once the demand blocks were formed, we applied pricing logic that reflects chemistry mix changes, local versus imported supply shares, and typical replacement cycles. These outputs were then checked using interview-led price bands and channel markups. The totals were corroborated with selective bottom-up approximations, such as supplier and importer roll-ups for key battery categories and sampled ASP-time-volume checks, then adjusted where gaps appeared, for example where informal distribution makes volumes harder to observe. Forecasts were built using scenario analysis, varying adoption and price paths based on expert consensus on EV ramp-up, stationary storage additions, and expected cost curves for lithium-based systems.
Data Validation & Update Cycle
Outputs were validated through a set of sanity checks before final sign-off, including year-on-year variance tests, price-volume consistency checks, and comparisons against independent signals such as trade value trends and end-market growth rates. When numbers did not align, the assumptions were revisited, and relevant respondents were re-contacted to clarify whether the mismatch came from scope, timing, or price movement.
Before publication, the model and narrative go through multi-step analyst review so calculation logic, units, and currency treatment stay consistent across the report. Reports are refreshed annually, and interim updates are made when material events occur, such as major policy changes, commissioning delays, or meaningful shifts in battery chemistry demand. Right before delivery, we do a final pass to reflect the latest public updates and confirmed market signals.
Mordor Intelligence's Indonesia Battery Market Size Compared With Other Published Estimates
Published market values for Indonesia batteries can vary a lot, even when the topic sounds identical, because each publisher sets its own definition, base year, and pricing method. The table helps show how scope choices and the way revenues are counted can move the final number up or down.
The table points to a spread that is largely explained by what gets included as a battery sale and what gets treated as adjacent value, a difference that becomes more pronounced when fast-growing lithium-based applications are priced with different assumptions. In Mordor Intelligence's model, the sizing follows battery revenues across primary and secondary types and major applications, and it avoids adding upstream raw materials or non-battery power electronics into the same total, which some estimates appear to blend.
Benchmark comparison
| Source | Market Size | Gaps in Research Methodology |
|---|---|---|
| Mordor Intelligence | USD 1.66 B (2025) | |
| Industry Portal A | USD 0.45 B (2024) | Often reflects a narrower revenue pool that leans toward selected rechargeable categories and short-horizon forecasting, with limited visibility on industrial stationary demand and replacement-led volumes. |
| Industry Statistics Digest B | USD 3.50 B (2023) | Likely uses a broader definition that can fold in upstream materials value or double-count across the value chain, and may apply aggressive price levels without consistent chemistry-mix adjustment. |
Looking across the three figures, the smaller estimate appears to be driven by a tighter product and application scope, while the larger one looks influenced by wider value-chain inclusion and higher implied pricing. Our approach is meant to be traceable, since the demand blocks and price bands are tied back to observable end-use signals and then re-checked with channel and buyer feedback before the totals are finalized.


Key Questions Answered in the Report
How fast is battery demand growing in Indonesia?
Industry revenue is rising at a 12.06% CAGR from 2026 to 2031, reaching USD 3.25 billion by the end of 2031.
Which chemistry leads Indonesia's cell shipments today?
Lithium-ion batteries held 60.2% market share in 2025, driven by EV and utility-scale storage projects.
What hurdles slow EV adoption beyond Java?
Limited public chargers and swap stations outside major Java cities remain the primary bottleneck to wider EV uptake.
Why is solid-state technology important for Indonesia?
Solid-state prototypes show the fastest CAGR at 20.9%, promising higher energy density and improved safety over liquid-electrolyte cells.
How dependent are local plants on imported feedstock?
All domestic gigafactories still rely on imported lithium salt and anode materials, exposing them to global price volatility.
Who are the leading investors in Indonesia's gigafactory pipeline?
Chinese companies such as CATL, BYD, and Huayou Cobalt headline capacity announcements, while Hyundai-LG anchors South Korean participation.
Page last updated on:


 Your data is secure and never sold or shared.


