
Indium Tin Oxide Market Size and Share
Market Overview
| Study Period | 2020 - 2031 |
|---|---|
| Market Size (2026) | USD 1.92 Billion |
| Market Size (2031) | USD 2.36 Billion |
| Growth Rate (2026 - 2031) | 4.23 % |
| Fastest Growing Market | Asia Pacific |
| Largest Market | Asia Pacific |
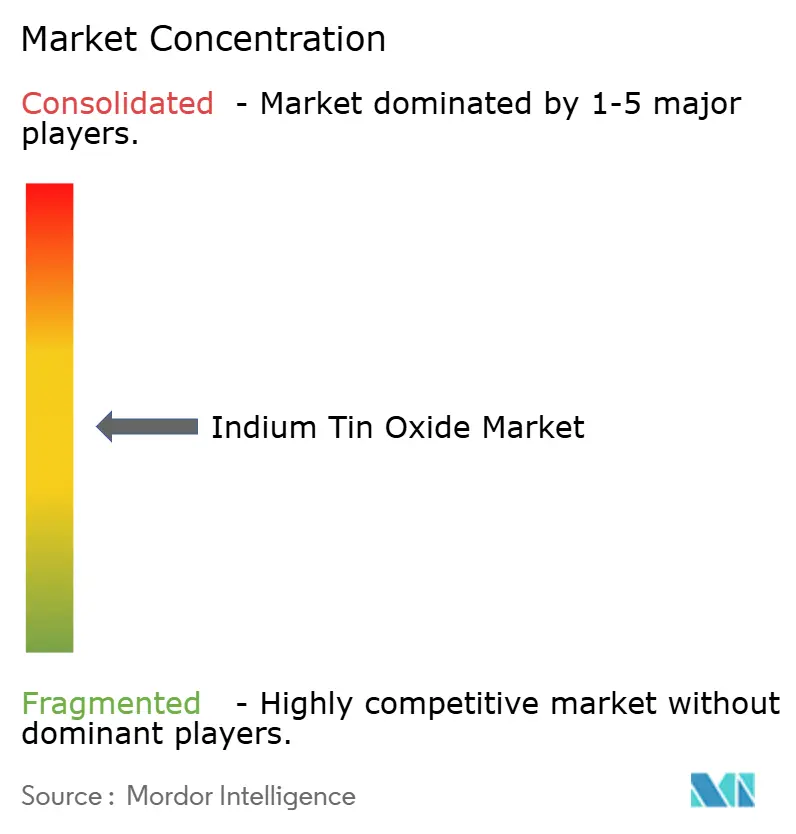
| Market Concentration | Medium |
Major Players *Disclaimer: Major Players sorted in no particular order Image © Mordor Intelligence. Reuse requires attribution under CC BY 4.0. | |
Indium Tin Oxide Market Analysis by Mordor Intelligence
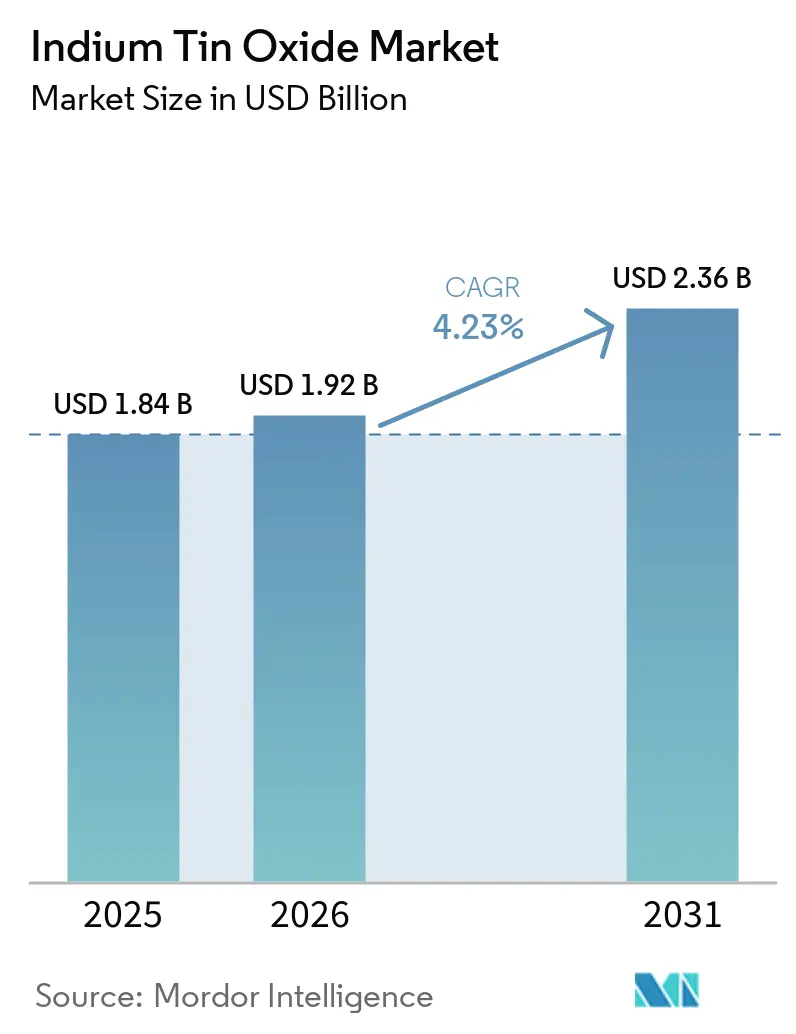
The Indium Tin Oxide Market size was valued at USD 1.84 billion in 2025 and estimated to grow from USD 1.92 billion in 2026 to reach USD 2.36 billion by 2031, at a CAGR of 4.23% during the forecast period (2026-2031). Display makers are scaling eighth-generation OLED fabs that require uniform, high-conductivity transparent electrodes, while thin-film photovoltaics and smart-glass projects are opening new end-use avenues. Automotive digital cockpits and battery thermal sensors are emerging, high-margin niches. On the supply side, indium export controls and recycling progress are redefining procurement strategies and pushing producers toward closed-loop recovery systems.
Key Report Takeaways
- By technique, sputtering deposition led with 74.62% of the indium tin oxide market share in 2025; spray pyrolysis and other approaches are projected to post a 5.12% CAGR through 2031.
- By application, optoelectronics commanded 47.12% revenue in 2025, while photovoltaic cells are forecast to grow at a 5.02% CAGR to 2031.
- By end-user industry, consumer electronics held 50.74% of the indium tin oxide market in 2025, and automotive applications are expected to advance at a 5.06% CAGR through 2031.
- By geography, Asia-Pacific contributed 55.68% of 2025 global revenue and is set for a 4.82% CAGR through 2031.
Note: Market size and forecast figures in this report are generated using Mordor Intelligence’s proprietary estimation framework, updated with the latest available data and insights as of 2026.
Market Trends and Insights
Drivers Impact Analysis of Indium Tin Oxide Market*
| Driver | (~) % Impact on CAGR Forecast | Geographic Relevance | Impact Timeline |
|---|---|---|---|
| Rising demand due to panel capacity additions | +1.2% | Asia-Pacific core, spill-over to global supply chains | Medium term (2-4 years) |
| Rising solar PV installations needing transparent electrodes | +0.9% | Global, with concentration in China, India, and EU markets | Long term (≥ 4 years) |
| Growth of smart-glass and touch-interface devices | +0.8% | North America & EU leading, Asia-Pacific manufacturing | Medium term (2-4 years) |
| EV battery tabs adopting ultra-thin ITO coatings for heat sensing | +0.6% | Global EV markets, early adoption in China and Europe | Long term (≥ 4 years) |
| Increase in demand from wearable and flexible electronics | +0.5% | Global consumer markets, manufacturing in Asia-Pacific | Medium term (2-4 years) |
| Source: Mordor Intelligence | |||
Rising Demand from New Panel Capacity
OLED fabs under construction across China, Korea, and Japan are lifting long-term offtake agreements for indium tin oxide targets. BOE Technology and TCL CSOT have announced eighth-generation lines designed for large substrates, driving specifications that favor high-uniformity sputtered films. Flexible smartphone displays are projected to exceed half of shipments by late-2024, and micro-OLED spending is accelerating for near-to-eye devices. Equipment providers report backlog growth, reinforcing multi-year visibility for ITO coating demand. Although inkjet-printed electrodes are improving, incumbent sputtering economics remain competitive for mainstream production[1].
Rising Solar PV Installations Needing Transparent Electrodes
Global photovoltaic additions topped 230 GW in 2024, and government auctions point to larger 2025 build-outs. Thin-film CIGS developers rely on indium tin oxide layers to balance transparency and sheet resistance, especially in tandem and perovskite-on-silicon designs. Module oversupply is pushing prices down, yet lower capex per watt is spurring adoption in distributed generation. Research groups have achieved 52% indium recovery from end-of-life CIGS modules via electrolytic methods, a step toward offsetting primary supply concentration. Over the long term, higher-efficiency perovskites will require durable, low-defect transparent conductors, supporting baseline ITO volumes.
Growth of Smart-Glass and Touch-Interface Devices
Electrochromic window retrofits in commercial real estate are scaling as building owners target 30-40% HVAC savings. These systems employ ITO-coated edges to distribute voltage uniformly across large glazing panes. Automotive sunroofs and privacy glass adopt similar structures, expanding the indium tin oxide market across mobility platforms. In consumer electronics, projected-capacitive touch screens have been the standard for more than a decade, and total sensor area is rising as foldable devices add secondary panels. Even with silver-nanowire pilots, mass producers continue to specify ITO for its stable supply chain and established reliability testing protocols.
EV Battery Tabs Using Ultra-Thin ITO Coatings
Pack designers place temperature-sensing ITO films on battery tabs to detect hotspots quickly, improving safety and extending life. LG Display’s 40-inch automotive cockpit integrates local-dimming technology that lowers heat buildup, highlighting cross-overs between display and thermal management know-how. Printed sensor suppliers forecast a USD 960 million addressable market by 2034 for transparent heaters applied to LiDAR domes and windshield areas. Although carbon-based heaters show promise, the crystalline nature of sputtered indium tin oxide delivers the low haze and high power density required for automotive homologation.
Restraints Impact Analysis of Indium Tin Oxide Market*
| Restraint | (~) % Impact on CAGR Forecast | Geographic Relevance | Impact Timeline |
|---|---|---|---|
| High indium price volatility and supply risk | -0.7% | Global, with particular impact on cost-sensitive applications | Short term (≤ 2 years) |
| Availability of low-cost substitutes | -0.5% | Global, accelerated adoption in flexible electronics markets | Medium term (2-4 years) |
| Increasing recycling mandates lowering virgin target demand | -0.3% | EU and North America leading, gradual global adoption | Long term (≥ 4 years) |
| Source: Mordor Intelligence | |||
High Indium Price Volatility and Supply Risk
Indium prices rose nearly 13% in early-2025 after China introduced export licensing on several indium compounds. Because 75-80% of primary indium is recovered as a zinc by-product, mines cannot quickly boost output when spot demand spikes, leaving refiners dependent on inventories. The United States started a Section 232 study to determine whether imports of refined indium threaten national security, signaling possible tariffs or stockpiling measures. Smelters in Korea and Canada are examining residue leaching to lift recoveries, while brand-owners negotiate long-term contracts to lock in allocation. These strategies cap, but do not eliminate, cost unpredictability for indium tin oxide industry participants[2].
Commercialization of Low-Cost Substitutes
Silver and copper nanowire films now match ITO sheet resistance at sub-60 Ω/□ with over 90% transmittance, and roll-to-roll coating lines have surpassed 100 m/min, reducing unit costs. Hybrid stacks combining nanowires with carbon nanotubes further lower material spend and enhance crease tolerance. Molybdenum-doped indium oxide shows double the conductivity of classical ITO using less indium, appealing to display fabs aiming to conserve critical metals. Polymer conductors such as PBDF synthesized in ambient air reach 1.0 × 10^4 S/cm, but long-term UV stability remains under evaluation. Broad commercialization of these options could divert demand away from traditional indium tin oxide market applications in flexible form-factors.
*Our forecasts treat driver/restraint impacts as directional, not additive. The impact forecasts reflect baseline growth, mix effects, and variable interactions.
Indium Tin Oxide Market Segment Analysis
By Technique:
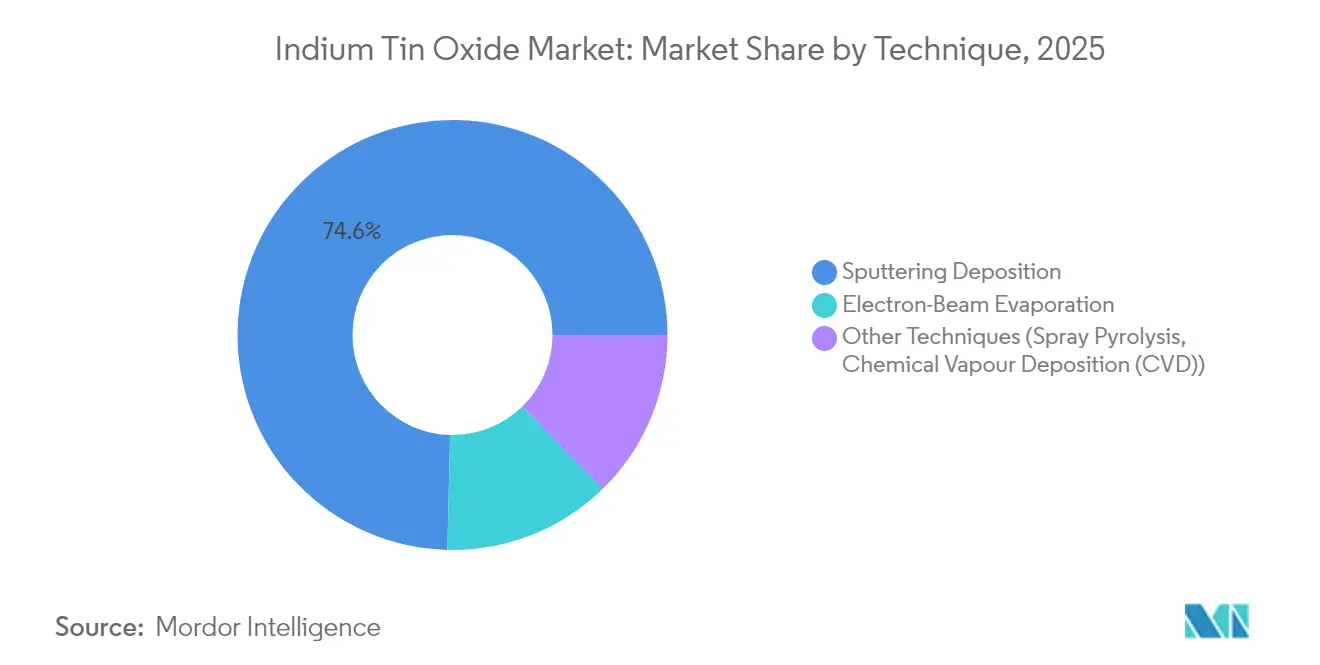
Sputtering Keeps the Lead While Alternatives ScaleSputtering dominated the indium tin oxide market in 2025 with a 74.62% revenue share, underpinned by process maturity and superior film homogeneity. Rotary cathode upgrades cut arcing events, enhancing target utilization and lowering cost per square meter. Some producers deploy bilayer sputtering—an oxygen-lean seed film for conductivity topped by an oxygen-rich cap for optical clarity—to balance performance and throughput. Other techniques, including spray pyrolysis and chemical vapor deposition, together are projected to clock a 5.12% CAGR to 2031 as flexible substrates demand lower-temperature processing. These routes appeal to start-ups manufacturing foldable displays where substrate heat budgets cannot exceed 200 °C.
Electron-beam evaporation keeps a foothold in niche optics requiring ultra-high vacuum purity. JX Advanced Metals’ Mesa, Arizona plant expansion illustrates OEM efforts to localize sputtering target supply chains amid geopolitical pressures. Research on in-situ plasma cleaning of polymer webs may further bridge efficiency gaps between sputtering and atmospheric spray methods, suggesting a gradual, not abrupt, diversification of deposition choices.

By Application:
Optoelectronics Holds Share as Photovoltaics AccelerateOptoelectronics retained 47.12% of 2025 revenue thanks to continuous smartphone, TV, and notebook production. The indium tin oxide market size for optoelectronics is forecast to expand at a steady 3.78% compound rate, supported by the shift to larger, higher-refresh OLED panels. In contrast, photovoltaic cells are positioned for a faster 5.02% CAGR as tandem architectures push transparent electrode quality requirements. Developers of perovskite-silicon stacks specify <15 Ω/□ sheet resistance alongside 92% visible transmittance, thresholds that established ITO sputtering lines already meet.
Wearables and augmented-reality optics form a smaller but fast-growing tranche, demanding durable coatings that can flex thousands of cycles. Battery inhibitor films and EMI shielding in high-frequency IC packaging represent emerging slivers where thin, low-stress ITO layers outperform thicker metallic meshes. Across segments, incremental substitution by conductive polymers is forecast to remain below 5% of revenue through 2031, keeping indium tin oxide market share intact in mainstream uses.
By End-User Industry:
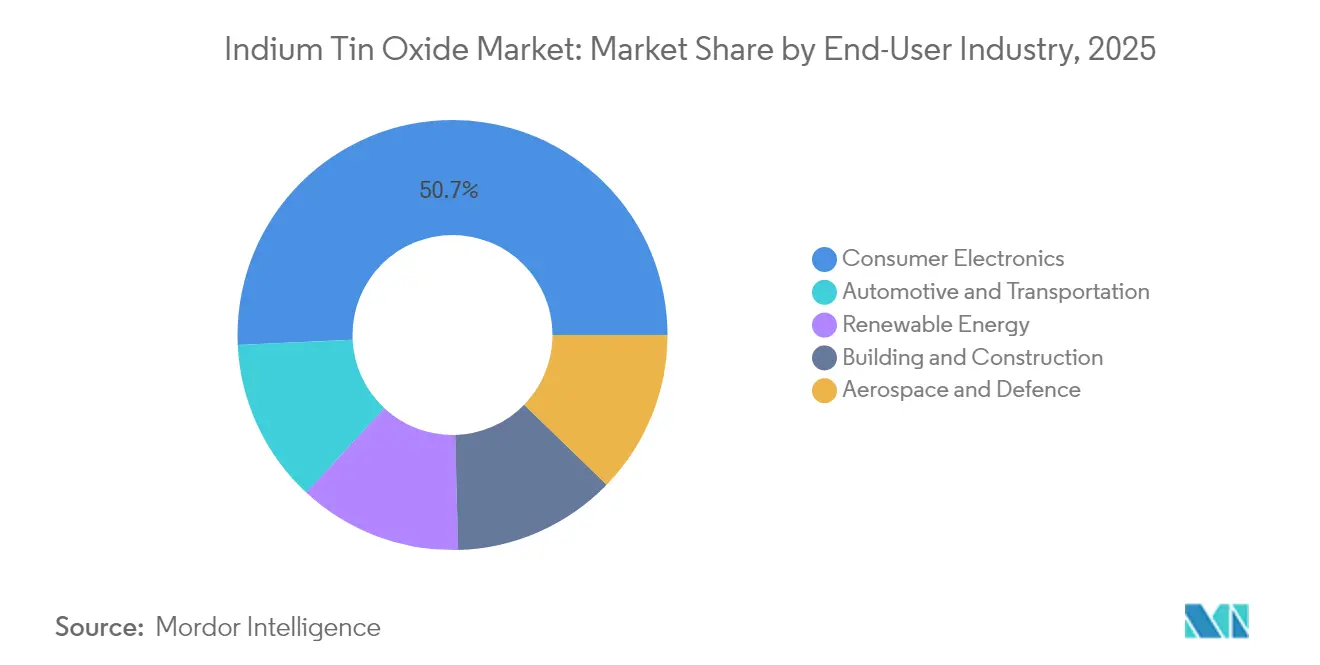
Automotive Demand Builds MomentumConsumer electronics generated 50.74% of overall 2025 consumption. Despite lengthening smartphone replacement cycles, average display area per device is increasing, stabilizing unit ITO usage. Automotive displays, instrument clusters, and head-up projections are now rolling off OEM lines at higher diagonals, propelling a 5.06% CAGR in the segment. The indium tin oxide market size for automotive screens could exceed USD 345.6 million by 2031 if current integration roadmaps hold.
Buildings adopt electrochromic façades to meet tightening energy codes, and several EU retrofit subsidies reimburse smart-glass costs. Renewable-energy developers use ITO in advanced thin-film modules and concentrator optics. Aerospace remains a specialized buyer, valuing radiation-hard coatings for cockpit avionics even at premium pricing. Across industries, sustainability initiatives encourage take-back of coated glass and photovoltaics, reinforcing closed-loop supply ambitions.
Geography Analysis
APAC Indium Tin Oxide Market
Asia-Pacific’s 55.68% revenue stake is anchored in its vertically integrated display and solar ecosystems. China alone is projected to control 76% of global OLED capacity by 2025, and producers such as BOE operate fabrication parks that co-locate glass melting, target bonding, and recycling units. Korea lags in volume but leads in process innovation, while Japan supplies high-purity sputtering targets and mask sets. Regional growth of 4.82% CAGR is forecast despite China’s 2025 export licensing, as domestic recycling and Southeast Asian back-end assembly mitigate outward flow risks.
North America and Europe Indium Tin Oxide Market
North America is balancing demand growth with critical-mineral security programs. New sputtering-target factories in Arizona and planned indium recycling hubs in Ontario aim to shorten supply lines for semiconductor and automotive customers. The U.S. Inflation Reduction Act’s EV incentives indirectly lift ITO usage via domestic car-maker display upgrades. Europe’s Critical Raw Materials Act targets 10% domestic sourcing of strategic metals by 2030, spurring feasibility studies for secondary indium extraction from zinc smelter residues in Belgium and Bulgaria. Smart-glass mandates in revised Energy Performance of Buildings Directive will further raise regional consumption.
South America and Middle East Indium Tin Oxide Market
Smaller yet promising markets in South America and the Middle East leverage abundant solar resources. Brazil’s distributed solar auctions stipulate local content requirements that favor regional ITO coating partners, while Saudi Arabia’s NEOM project specifies electrochromic façades across key zones. Limited local target manufacturing still necessitates Asia-Pacific imports, but joint ventures with Japanese and Korean producers are under negotiation to add sputtering capacity near end-users.

Value Chain Analysis
The value chain starts with indium supply that is largely recovered as a by-product of zinc processing, then proceeds through refining to high-purity indium metal and conversion into indium oxide (In2O3). ITO feedstock is produced by blending high-purity In2O3 with tin oxide (SnO2) (typically a ~90-95% to 5-10% ratio) and manufacturing ITO powder via wet-chemical precursor routes, calcination, and milling to control particle size and phase purity. Downstream, powder is consolidated into sputtering targets through sintering and/or hot isostatic pressing to achieve high density, then machined or bonded into planar or rotary cathodes for thin-film deposition at display, touch, and PV coating lines. Japan-linked target ecosystems (for example, Mitsui Mining & Smelting and JX Advanced Metals) sit at the high-purity end of this chain, while China and Korea remain central to both indium availability and large-volume electronics manufacturing pull-through.
Key bottlenecks and cost drivers cluster around indium availability, purity specifications, and yield losses during deposition. Indium is dissipated across mining and smelting steps, and again at the coating stage (spent targets, chamber residues, and etch wastes), which elevates the role of secondary recovery from ITO residues, coated glass, and end-of-life electronics. As buyers tighten supply assurance and carbon reporting, the chain is shifting toward closer integration or long-term partnerships between refiners, target manufacturers, and high-volume coaters, alongside closed-loop recycling programs that return indium-bearing scrap back into refining. Substitution pressure (silver nanowires, graphene, carbon nanotubes, and conductive polymers such as PEDOT variants) is most acute in flexible and wearable form factors, pushing ITO suppliers to differentiate via low-temperature processes, longer-life rotary targets, and improved utilization to reduce indium intensity per square meter coated.
Competitive Landscape
The indium tin oxide market remains moderately fragmented. The five largest suppliers control roughly 62% of target shipments, a level that confers pricing discipline yet leaves room for niche entrants. Leading companies integrate back to refining, ensuring raw-metal availability and offering customers stable contracts indexed to zinc smelter output. Continuous R&D funding focuses on longer-life rotary targets, oxygen-tailored bilayer stacks, and low-temperature deposition chemistries.
Alternative-material challengers raise competitive pressure in flexible electronics but have yet to secure equal long-term reliability data for large-area applications. Strategic cooperation between display makers and material startups accelerates pilot deployments; for instance, automotive OEMs are testing hybrid nanowire-ITO laminates to reduce reflection in curved dashboards. Environmental, social, and governance criteria influence procurement: recyclability certifications and carbon-intensity disclosures are becoming standard in supplier qualification. Geopolitical uncertainty around indium exports is pushing Western firms to dual-source targets from Korea and Canada while exploring secondary recovery from spent photovoltaic glass.
Innovation pipelines include nanoscale indium dispersions for antistatic coatings and selective-area chemical vapor deposition enabling patterned electrodes without photoresist waste. Companies that can provide turnkey sputtering lines, in-house recycling, and co-engineered electrode stack designs are best positioned to capture future growth, especially in automotive and building-integrated photovoltaics.
Indium Tin Oxide Industry Leaders
-
Indium Corporation
-
Umicore
-
MITSUI MINING & SMELTING Co.,LTD.
-
Nitto Denko Corporation.
-
ENAM Optoelectronic Material
- *Disclaimer: Major Players sorted in no particular order
Indium Tin Oxide Market Companies Covered in this Report
- American Elements
- Diamond Coatings Inc
- ENAM Optoelectronic Material
- Guangxi Crystal Union Photoelectric Materials Co., Ltd. (CUPM)
- Indium Corporation
- Knight Optical
- MITSUI MINING & SMELTING CO.,LTD.
- Nitto Denko Corporation.
- OPCO Laboratory, Inc.,
- Sumitomo Metal Mining Co., Ltd.
- Touch International, Inc.
- Umicore
- Vital Materials Co., Limited.
Market Opportunities and Future Outlook
Indium risk mitigation remains a near-term opportunity, focused on keeping ITO in qualified stacks while reducing virgin metal dependence. China introduced export licensing on indium-related materials in 2025, and indium prices rose in early-2025, which has increased the value of closed-loop recovery offerings, multi-year supply agreements, and localized refining and target supply for OEMs facing large-area sputtering demand. In parallel, the display and electronics pipeline highlighted in the report, including eighth-generation OLED capacity moves by panel makers such as BOE Technology and TCL CSOT, expands the addressable space for higher-uniformity sputtering targets and process recipes aimed at improving target utilization and reducing downtime on large substrates.
Technology whitespace is forming around flexible electronics and next-generation oxide stacks where ITO stays relevant within the transparent conductor ecosystem even as alternatives advance. 2026 publications on mass-production compatible flexible ITO thin-film transistors, along with research evaluating indium-free ZnSnO (ZTO) targets, point to two development tracks: extending ITO capability onto mechanically demanding substrates, and engineering pathways to conserve indium through new oxide formulations and deposition schemes. For suppliers, this creates room for differentiated products and services such as low-temperature ITO deposition chemistries, bilayer or graded electrode stacks, and co-development with device makers on reliability and bending endurance, while recycling and secondary recovery programs provide a practical lever to stabilize supply for both optoelectronics and thin-film PV customers.
Recent Industry Developments in Indium Tin Oxide Market
- April 2026: Indium Corporation announced a 10-year offtake framework agreement with Flash Metals USA Inc. covering critical metals recovered from electronic scrap, including indium. The move strengthens access to secondary indium feedstock and supports customer requests for supply assurance and recycled-content pathways in materials used across electronics coating value chains.
- February 2025: China's Ministry of Commerce and the General Administration of Customs implemented export controls on indium-related materials, including indium tin oxide, requiring exporters to obtain permissions from competent commercial departments. The policy action tightened procurement planning for ITO targets and increased the importance of diversified sourcing and recycling routes outside primary export channels.
- July 2024: Umicore published updated technical documentation for indium tin oxide materials used in thin-film applications (including evaporation-grade ITO). Refreshing product specifications and handling guidance supports process qualification work by coating lines, reinforcing Umicore's positioning in high-purity ITO materials for optoelectronics and related thin-film manufacturing.
Indium Tin Oxide Market Report Scope and Research Methodology
Market Definition and Coverage
This market covers the value of indium tin oxide (ITO) materials and coatings used to create transparent, electrically conductive layers for electronics, energy, and industrial uses. The sizing follows demand from end uses where ITO is applied as a functional film or as an input into a finished component.
Scope exclusions: This estimate does not include adjacent transparent conductive alternatives or non-ITO conductive coatings in the addressable market.
Segments Covered in This Report
- By Technique
- Sputtering Deposition
- Electron-Beam Evaporation
- Other Techniques (Spray Pyrolysis, Chemical Vapour Deposition (CVD))
- By Application
- Optoelectronics
- Photovoltaic Cells
- Battery Inhibitors
- Other Applications (Wearables and Flexible Electronics, etc.)
- By End-User Industry
- Consumer Electronics
- Renewable Energy
- Automotive and Transportation
- Building and Construction
- Aerospace and Defence
- By Geography
- Asia-Pacific
- China
- Japan
- India
- South Korea
- ASEAN Countries
- Rest of Asia-Pacific
- North America
- United States
- Canada
- Mexico
- Europe
- Germany
- United Kingdom
- France
- Italy
- Spain
- Russia
- NORDIC Countries
- Rest of Europe
- South America
- Brazil
- Argentina
- Rest of South America
- Middle East and Africa
- Saudi Arabia
- South Africa
- Rest of Middle East and Africa
- Asia-Pacific
Data Sources, Market Sizing, and Validation
Desk Research
Desk research starts by building the supply and demand context around indium, tin oxides, and thin-film deposition. We rely on public sources such as the USGS for indium supply and recycling notes, UN Comtrade for trade flows of related materials, and the International Energy Agency for photovoltaic demand direction where it helps benchmark plant activity.
To keep the assumptions grounded, we also refer to sources such as SEMI and display-industry publications for capacity and utilization themes, peer-reviewed journal articles for ITO film usage and deposition yields, and official customs or statistical portals in major producing and consuming regions. Company filings, investor decks, and credible press releases are used to cross-check capacity adds, product-mix shifts, and pricing commentary, and then company financials and an import or export shipment level database are used selectively to confirm activity signals. These examples are not exhaustive, and many other public and paid sources were also consulted for data collection, validation, and clarification.
Primary Interviews and Surveys
Primary work was used to pressure test the desk assumptions on ITO film demand, pricing movement, and the practical split between deposition techniques and end-use pull. We spoke with a mix of material suppliers, coating and deposition ecosystem participants, and downstream buyers across APAC, EMEA, and the Americas, so gaps in utilization, yield, and substitution risk could be reconciled before finalizing the model.
Distribution of primary research fieldwork respondents
| Company type | Respondent position | Region |
|---|---|---|
| Top tier: 25% | CXOs: 12% | APAC: 48% |
| Mid tier: 60% | Functional/Unit leaders: 40% | EMEA: 31% |
| Smaller Players: 15% | Managers: 48% | Americas: 21% |
Market-Sizing & Forecasting
Market sizing is built using a top-down approach, where end-use demand pools are reconstructed from display and optoelectronics output, photovoltaic installation activity, and adoption of ITO-based functional coatings. Those demand pools are then translated into ITO value using typical film usage intensity and realized pricing.
To keep the totals realistic, we also corroborate the result with selective bottom-up approximations, including sampled supplier revenue ranges, channel checks on coating volumes, and volume times ASP sanity checks for common applications.
The model uses market-specific inputs such as display panel capacity and utilization, the optoelectronics mix (including shifts toward OLED and related stacks), thin-film photovoltaic demand signals, indium availability and recycling rates, and observed ITO pricing trends tied to indium movements. Where data is thin, gaps are handled by applying conservative ranges for yield loss, regional utilization, and substitution impact, then narrowing those ranges based on what interviewees see in current procurement and production runs.
For forecasting, scenario analysis is used alongside a simple regression-style relationship between ITO demand and key drivers, including panel area output, PV additions, and average selling price progression. The final forecast path is chosen after checking that the implied intensity and price trajectory match what industry participants consider achievable over the next cycle.
Data Validation & Update Cycle
Validation is done through repeated triangulation between the model output and independent indicators, such as demand trends in consumer electronics and renewable energy, movements in indium supply and recycling commentary, and capacity announcements in key manufacturing regions. When a variance looks unusual, assumptions are revisited, outliers are rechecked, and follow-up calls are triggered so the logic stays consistent across applications and geographies.
Before sign-off, the numbers pass through multi-step analyst reviews that focus on unit consistency, price-year alignment, and regional roll-up integrity. The report is refreshed annually, and interim updates are made when material events occur, such as major capacity shifts, policy moves affecting indium supply, or sharp price swings, followed by a final pre-delivery review so clients receive the latest view.
Mordor Intelligence's Indium Tin Oxide Market Sizing Compared With Other Published Estimates
Published market sizes for indium tin oxide can look far apart because the scope line is not always drawn the same way, and the conversion from coatings activity into revenue depends heavily on the price-year and application mapping. Differences also show up when older capacity utilization assumptions are carried forward, or when currency timing and inflation handling are not made consistent across regions.
A common gap driver is whether the figure represents only ITO material revenue versus a broader transparent conductive film value that includes deposition services, coated substrates, or even adjacent alternatives. Another driver is how each source treats technique splits, especially sputtering versus evaporation routes, since usage intensity and scrap rates shift the implied volumes. The spread is also explained by whether forecasts assume steady ASP decline, a flat price path, or a rebound linked to indium tightness and recycling, which is handled through application-level checks in this study, using a modeling choice applied by Mordor Intelligence.
Benchmark comparison
| Source | Market Size | Gaps in Research Methodology |
|---|---|---|
| Mordor Intelligence | USD 1.84 B (2025) | |
| Global Consultancy A | USD 1.95 B (2025) | Uses a broader end-use mapping that appears to fold in some transparent conductive film value beyond ITO material, and it applies a 2025 base-year price snapshot without clearly normalizing for regional ASP differences. |
| Industry Data Portal B | USD 1.83 B (2024) | Relies on a stated 2024 value with limited visibility on price-year conversion and application weighting, which can understate the impact of display utilization swings and indium price movements when rolling into later years. |
Looking across the three figures, most of the difference comes from what is counted as ITO revenue versus a wider coating and substrate value chain, followed by how price timing is handled. By tying demand to end-use output signals and then cross-checking the implied volumes and ASP logic, our estimate stays traceable to a repeatable set of steps that can be rechecked as new capacity and pricing information emerges.
Key Questions Answered in the Report
What is the current Indium Tin Oxide Market size?
The indium tin oxide market size is valued at USD 1.92 billion in 2026.
How fast is the indium tin oxide market expected to grow?
It is projected to record a 4.23% CAGR between 2026 and 2031, reaching USD 2.36 billion.
Which end-use sector drives the highest ITO consumption today?
Consumer electronics holds the leading 50.74% share, anchored by smartphones, TVs, and tablets.
Why is Asia-Pacific so dominant in the ITO supply chain?
The region combines most of the world’s OLED panel capacity, solar module output, and sputtering-target manufacturing infrastructure.