
Market Overview
| Study Period | 2020 - 2031 |
|---|---|
| Forecast Data Period | 2026 - 2031 |
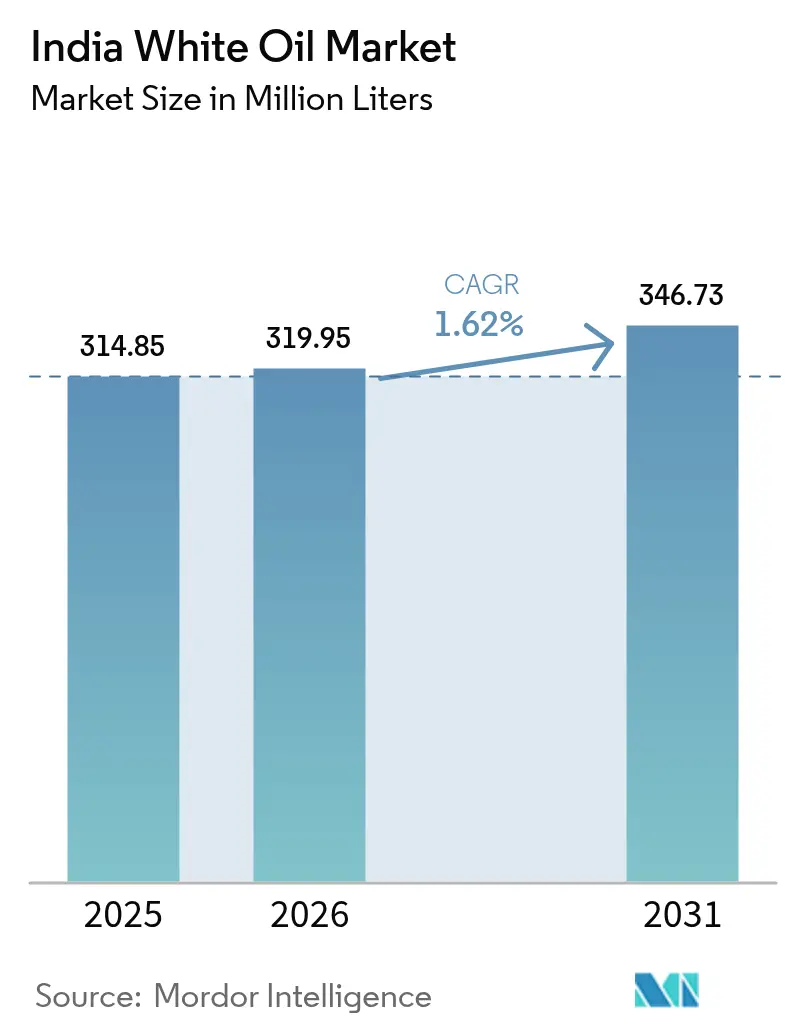
| Base Year Market Size (2025) | 314.85 Million liters |
| Market Volume (2026) | 319.95 Million liters |
| Market Volume (2031) | 346.73 Million liters |
| Growth Rate (2026 - 2031) | 1.62 % |
| Market Concentration | Medium |
Major Players *Disclaimer: Major Players sorted in no particular order Image © Mordor Intelligence. Reuse requires attribution under CC BY 4.0. | |
India White Oil Market Analysis by Mordor Intelligence
India White Oil Market size in 2026 is estimated at 319.95 million liters, growing from 2025 value of 314.85 million liters with 2031 projections showing 346.73 million liters, growing at 1.62% CAGR over 2026-2031. This measured expansion reflects a shift from sheer volume growth toward higher-purity, value-added requirements that align with India’s maturing industrial base. Utilization across the country’s refining system consistently exceeds 103%, enabling producers to satisfy specialized downstream needs without relying on imports. Demand concentrates in personal-care, pharmaceutical, and polymer-processing clusters that benefit from integrated feedstock access and port infrastructure. Infrastructure upgrades—such as Indian Oil Corporation’s USD 2.1 billion capacity increase at Gujarat—strengthen domestic supply while positioning refiners to tap rising global demand for specialty oils[1]. Headwinds stem from base-oil price swings and growing availability of synthetic substitutes, yet established suppliers mitigate risk through vertical integration, regulatory compliance, and diverse viscosity portfolios.
Key Report Takeaways
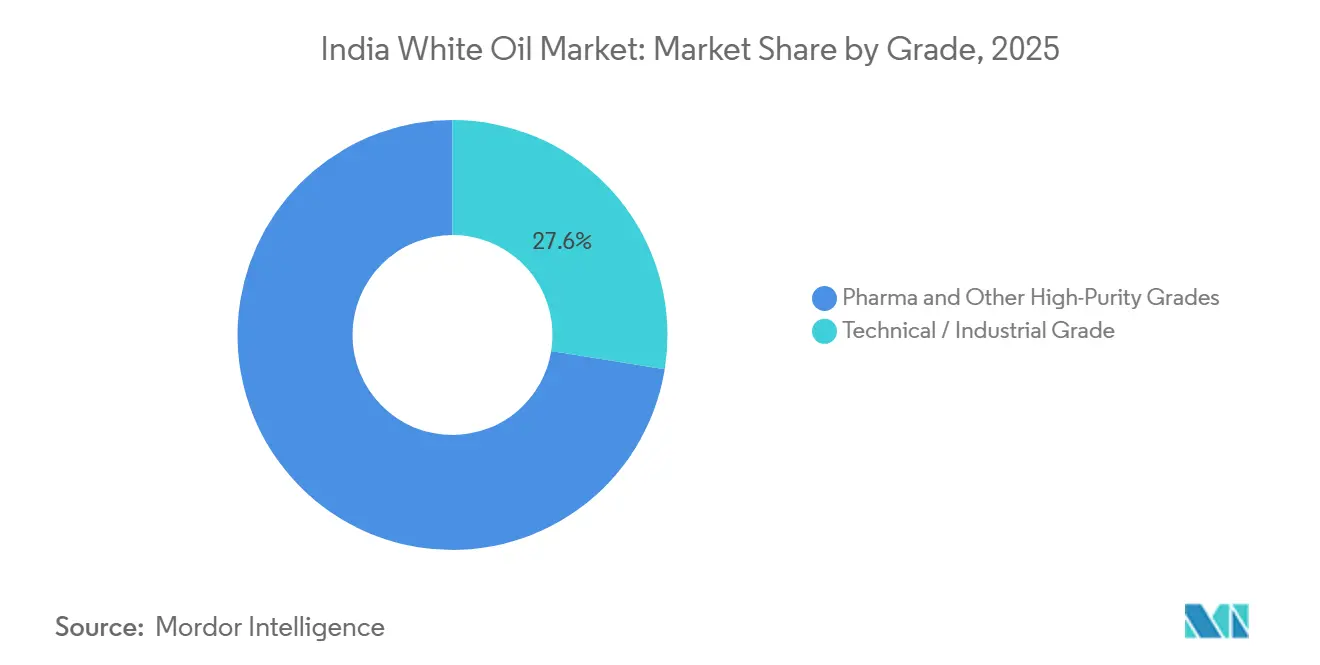
- By grade, pharma and other high-purity variants accounted for 72.45% of the India white oil market share in 2025, while the same group is forecast to grow at a 1.69% CAGR to 2031.
- By viscosity, low-viscosity products commanded 67.60% of the India white oil market size in 2025 and are advancing at a 1.63% CAGR through 2031.
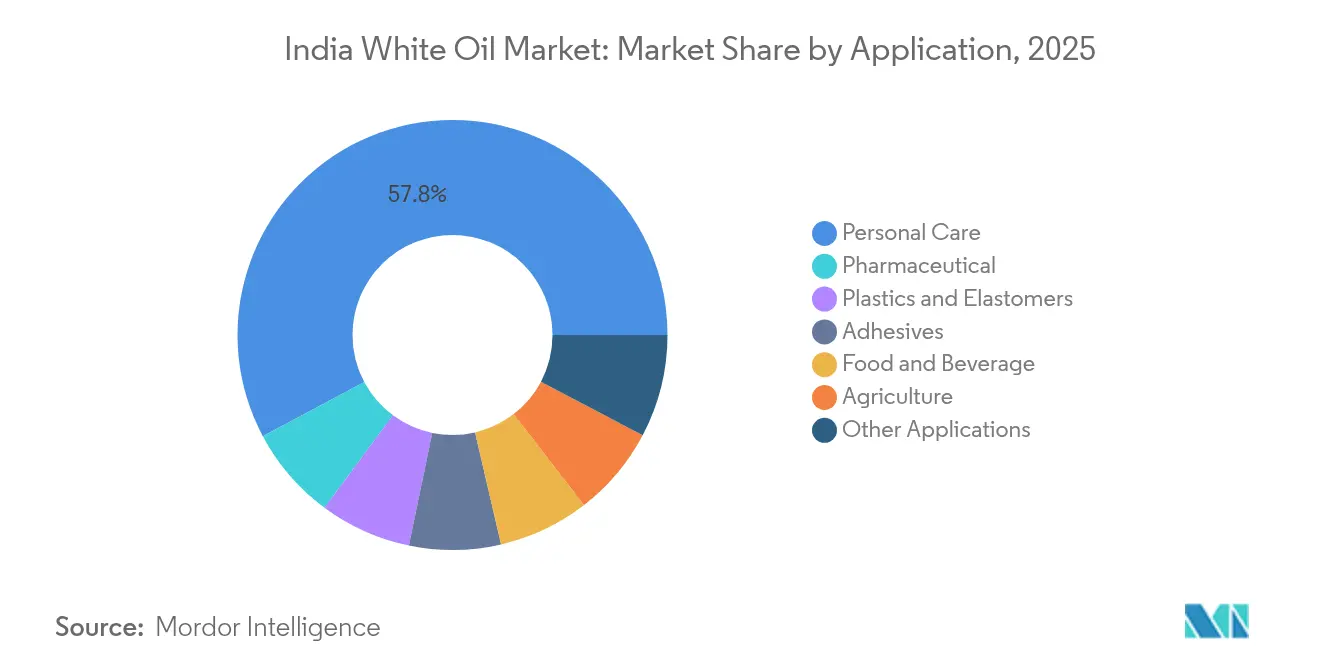
- By application, personal care led with a 57.80% share of the India white oil market in 2025; pharmaceutical uses are projected to expand at a 2.02% CAGR through 2031.
Note: Market size and forecast figures in this report are generated using Mordor Intelligence’s proprietary estimation framework, updated with the latest available data and insights as of 2026.
India White Oil Market Trends and Insights
Drivers Impact Analysis*
| Drivers | (~) % Impact on CAGR Forecast | Geographic Relevance | Impact Timeline |
|---|---|---|---|
| Booming cosmetics and personal-care manufacturing clusters | +0.6% | National, with concentration in Gujarat, Maharashtra, Tamil Nadu | Medium term (2-4 years) |
| Expanding domestic pharmaceutical formulations capacity | +0.4% | National, with hubs in Hyderabad, Ahmedabad, Mumbai | Long term (≥ 4 years) |
| Rising polymer-processing demand from plastic and elastomer plants | +0.3% | Gujarat, Maharashtra, Tamil Nadu petrochemical corridors | Medium term (2-4 years) |
| Stricter regulatory compliance driving high-purity white oil adoption | +0.2% | National, early adoption in export-oriented facilities | Short term (≤ 2 years) |
| Notable growth in the food and beverage sector | +0.2% | National, concentrated in processing hubs | Medium term (2-4 years) |
| Source: Mordor Intelligence | |||
Booming Cosmetics and Personal-Care Manufacturing Clusters
Robust growth in India’s cosmetics manufacturing hubs drives substantial uptake of high-purity white oils for emollient and carrier functions. Consumption remains well below levels in developed economies, providing a long runway for expansion. Major formulators such as Galaxy Surfactants require consistent white oil inputs to ensure product stability and texture across large-scale output lines. Integrated clusters in Gujarat, Maharashtra, and Tamil Nadu leverage feedstock proximity and consolidated logistics, lowering landed costs for processors. Brand owners targeting “clean beauty” formulations paradoxically depend on USP-grade mineral oils that deliver inertness and allergen-free properties, keeping demand resilient despite natural-ingredient marketing. These factors collectively strengthen the India white oil market as personal-care exports rise under free-trade pacts.
Expanding Domestic Pharmaceutical Formulations Capacity
India’s status as a global generics hub underpins sustained demand for USP-grade white oils in ointments, capsules, and processing equipment lubrication. Government incentives through Production Linked Incentive (PLI) schemes support Bulk Drug Parks, increasing active-pharmaceutical-ingredient self-sufficiency. U.S. FDA and EU regulatory regimes require strict batch traceability, favoring suppliers with documented quality systems. High-purity producers gain price premiums by offering certificates of analysis, stability data, and regulatory filing assistance. As production scales, consistent domestic supply reduces lead times for export consignments, reinforcing the India white oil market positioning in regulated pharma corridors.
Rising Polymer-Processing Demand from Plastic and Elastomer Plants
Technical-grade white oils remain indispensable as plasticizers, mold-release agents, and processing aids in the fast-growing polymer segment. India’s chemical economy is growing, indicating a strong feedstock pull for specialty oils. Gujarat’s integrated petrochemical complexes allow white-oil refiners to source base oils cost-effectively and supply processors within the same industrial zone, minimizing freight expenses. Consistency in viscosity and thermal stability provides manufacturability benefits over several synthetic alternatives. The high-volume, price-sensitive offtake stabilizes utilization rates for India's white oil market suppliers.
Stricter Regulatory Compliance Driving High-Purity Adoption
BIS standards, FSSAI rules, and FDA CFR 172.878 heighten purity thresholds, pushing users toward premium white oils that satisfy multiple certifications simultaneously[2]. Export-oriented manufacturers require dual documentation—think USFDA plus Japanese Pharmaceutical Excipients—to avoid shipment rejections, and they lean on suppliers capable of managing audit demands. Compliance differentiates products beyond viscosity alone, enabling higher margins per liter. Smaller, non-certified producers face entry barriers, consolidating volume with established refiners and strengthening the India white oil market’s formal segment.
Restraints Impact Analysis*
| Restraints | (~) % Impact on CAGR Forecast | Geographic Relevance | Impact Timeline |
|---|---|---|---|
| Availability of functional substitutes (silicone, synthetic ester oils) | -0.3% | National, concentrated in high-performance applications | Long term (≥ 4 years) |
| Base-oil price volatility linked to crude swings | -0.2% | National, affecting all market segments | Short term (≤ 2 years) |
| Domestic ultra-low-sulfur refining scale-up delays | -0.1% | Gujarat, Maharashtra refining centers | Medium term (2-4 years) |
| Source: Mordor Intelligence | |||
Availability of Functional Substitutes
Silicone fluids and synthetic esters capture applications demanding high thermal stability, low volatility, or biodegradable profiles, thereby capping mineral-oil penetration in premium segments. Aerospace, electronics cooling, and high-temperature food-processing lines increasingly specify synthetics whose lifecycle cost offsets their higher unit price. Manufacturers weighing formulation shifts must validate compatibility, redesign supply chains, and absorb material costs—factors that slow but do not halt substitution. Consequently, mineral grades maintain dominance in cost-sensitive and legacy formulations, moderating but not eliminating the India white oil market growth trajectory.
Base-Oil Price Volatility Linked to Crude Swings
Feedstock costs rise and fall with Brent crude, compressing processing margins for refiners unable to pass hikes downstream. India sources crude from the Middle East Gulf and Russia, making price curves susceptible to geopolitical disruptions. Smaller processors without hedging instruments or vertical integration feel margin squeezes first, occasionally leading to temporary production curtailments. End-users with strict cost ceilings shift purchases to spot volumes or delay orders, dampening near-term white-oil sales. Nonetheless, long-term supply contracts and rising in-country base-oil capacity provide stabilizing offsets within the India white oil market.
*Our forecasts treat driver/restraint impacts as directional, not additive. The impact forecasts reflect baseline growth, mix effects, and variable interactions.
Segment Analysis
By Grade: High-Purity Variants Capture Premium Pricing
Pharma and other high-purity grades held 72.45% India white oil market share in 2025 and are slated to expand at a 1.69% CAGR through 2031. Rising audits from foreign regulators and domestic authorities elevate purity expectations, prompting formulators to pay premiums for oils supplied with extensive documentation. USP, EP, and cosmetic-grade certifications enable access to lucrative export channels, boosting profitability despite modest volume growth. The India white oil market size realized from high-purity sales thus outperforms technical-grade revenues per liter.
Technical/industrial grades remain critical for polymer processing, lubricant blending, and general-purpose manufacturing, where cost sensitivity outweighs performance differentials. Integrated refiners capable of switching between grades without extensive downtime maximize plant utilization, blending base stocks to meet shifting demand patterns. Grade flexibility and in-house testing underpin customer confidence in batch consistency and strengthen long-term supply agreements.

By Viscosity: Low-Viscosity Oils Dominate for Processing Efficiency
Low-viscosity products captured 67.60% of the 2025 India white oil market size and are forecast to grow at a 1.63% CAGR through 2031. Their pumpability, blending ease, and filtration compatibility reduce production bottlenecks in automated plants, making them the default choice for cosmetics, pharmaceuticals, and plasticizers. Medium-viscosity grades service niche requirements—such as thicker skin-protection creams—while high-viscosity fractions address heavy-duty lubricity or moisture-barrier needs.
Key suppliers maintain broad viscosity slates, enabling formulators to fine-tune texture, spreadability, and processing parameters without switching vendors. Refiners with hydrotreating flexibility adjust cut points to optimize yields in response to market signals, preserving margin in the India white oil market even under feedstock volatility. Custom viscosity offerings, delivered with application engineering support, enhance stickiness of customer relationships and act as a barrier against low-price entrants.
By Application: Value-Added Uses Outpace Commodity Demand
Personal-care formulations accounted for 57.80% of the India white oil market in 2025, reflecting large-scale cosmetics manufacturing and rising consumer spending on skin and hair products. Although lower in volume, pharmaceutical applications represent the fastest growth at a 2.02% CAGR as drug makers scale excipient and topical formulations for domestic therapy and export markets. Over the forecast, pharmaceuticals capture share from technical-grade uses, increasing the India white oil market size tied to regulated sectors. Plastics, elastomers, adhesives, agriculture, and food-contact segments deliver stable baseline demand where technical-grade oils satisfy processing needs at lower cost, keeping utilization rates healthy for high-volume refiners.
Technical end-uses in plastics benefit from consistent viscosity, lubricity, and heat-transfer properties that mineral oils provide at competitive prices relative to synthetics. Food-and-beverage processors adhere to FSSAI and FDA purity mandates, favoring USP-grade white oils for incidental food contact, reinforcing demand for compliant suppliers. Niche uses in textiles, leather, and specialty coatings smooth cyclical swings in major segments. Market leaders such as Savita Oil Technologies leverage multi-grade portfolios and robust certification suites to serve all application groups, defending share in the India white oil market against both domestic and imported offerings.
Geography Analysis
Western India anchors production and consumption, with Gujarat hosting the Jamnagar refinery complex alongside Dahej’s integrated petrochemical zone, resulting in a concentrated supply of base and specialty oils. Majority of India’s dye and intermediates capacity resides in the state, creating dense downstream demand for technical- and high-purity white oils. Maharashtra ranks next, where Mumbai-Pune’s pharmaceutical, personal-care, and automotive clusters absorb significant low-viscosity grades. Tamil Nadu contributes through Chennai-Manali’s chemical corridor that serves both domestic users and export-oriented manufacturers.
Southern hubs benefit from seaport access that eases the import of select base oils and the export of finished formulations. Karnataka’s biotechnology and pharma nexus around Bangalore focuses on injectable and topical dosage forms, relying on USP-grade oils with tight batch-to-batch consistency, thereby augmenting the India white oil market demand for premium grades. Andhra Pradesh’s emerging chemical zones attract investment under state industrial policies, bringing incremental consumption into eastern coastal belts.
Northern regions participate primarily through agriculture and food-processing lines that use white oils in crop-protection emulsions and packaging machinery lubrication. Logistics challenges stemming from distance to western refineries encourage bulk shipments via rail and pipeline corridors, which recent infrastructure upgrades have eased. Meanwhile, export-oriented suppliers leverage India-GCC and ASEAN free-trade agreements, shipping white oil blends from western ports to over 75 countries, underscoring the geographic spread of the India white oil market.
Regulatory Landscape
In India, industrial white oil specifications are anchored by Bureau of Indian Standards requirements such as IS 1083:2022, which sets physical and chemical parameters (including viscosity and appearance) for consistent supply to industrial users. For regulated end uses, compliance extends to food-contact and pharmaceutical expectations, with companies aligning product documentation and batch traceability for customers operating under FSSAI oversight and international reference requirements (for example, US FDA 21 CFR 172.878 for white mineral oil used in specific food applications).
Broader chemical-sector compliance has also tightened reporting and transparency obligations, including mandatory data submission for chemical and petrochemical industries on the ChemIndia web portal, notified by the Ministry of Chemicals and Fertilizers on 27 February 2024. In parallel, petroleum product quality assurance practices are supported by Ministry of Petroleum and Natural Gas guidance, which raises the compliance threshold and tends to favor organized suppliers with established testing, certification, and audit readiness.
Value Chain Analysis
The value chain begins with crude-derived base oils and waxy feedstocks sourced from domestic refineries and, for certain higher-grade requirements, imports. Producers then apply intensive refining and purification (hydrotreating and related processes) to deliver technical and high-purity white oils with controlled color, odor, and aromatic content for personal care, pharmaceutical, food-processing, and polymer-processing customers. Participants commonly cited in this ecosystem include Gandhar Oil Refinery (India) Ltd, Savita Oil Technologies Ltd, Apar Industries Limited, and Columbia Petro Chem Pvt Ltd.
Downstream, white oils move through a mix of bulk and packaged logistics, often supplied in HDPE/MS drums, IBCs, and ISO tanks for inter-state distribution and exports. Differentiation tends to hinge on quality systems and certifications required by regulated customers (for example, ISO and FDA-aligned documentation, along with Kosher/Halal where relevant). Proximity to petrochemical and manufacturing clusters in Gujarat and Maharashtra also helps improve turnaround times and reduces landed costs for large personal-care, pharma, and polymer accounts.
Competitive Landscape
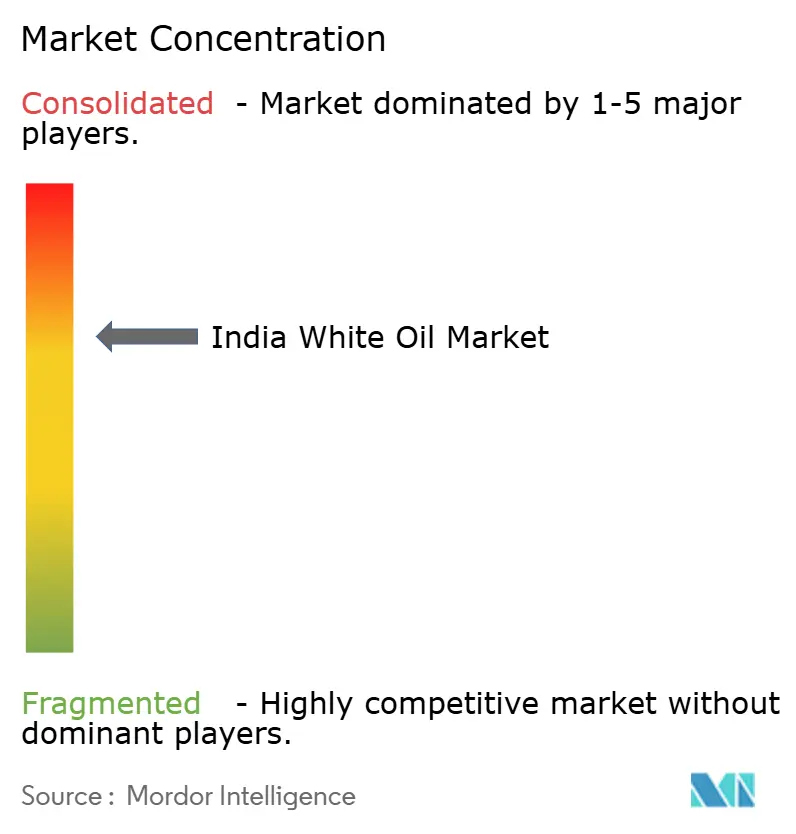
The India white oil industry is consolidated. Market players differentiate via breadth of viscosity ranges, certification coverage, and technical-service capabilities rather than price alone. Recent investments emphasize hydrotreating upgrades and in-line process analytics to guarantee color stability, odor neutrality, and ultra-low aromatic content essential for pharmaceutical and personal-care uses. Competition from synthetic substitutes triggers research and development collaboration between refiners and polymer labs to extend the operating windows of refined mineral oils. Firms co-develop blend packages combining white oils with antioxidants to enhance oxidative stability, defending mineral-oil positions in mid-temperature ranges. Long-term contracts with pharma majors and cosmetics global brands provide stable offtake and strengthen bargaining power when negotiating base-oil procurement, stabilizing the India white oil market despite volatile feedstock fundamentals.
India White Oil Industry Leaders
-
Gandhar Oil Refinery (India) Ltd
-
Savita Oil Technologies Ltd
-
Apar Industries
-
Indian Oil Corporation Ltd (IOCL)
-
ExxonMobil Corp
- *Disclaimer: Major Players sorted in no particular order
Market Opportunities and Future Outlook
A clear whitespace is scaling high-purity, documentation-heavy portfolios for export-oriented personal care and pharmaceutical manufacturers, where suppliers that can support pharmacopoeia-aligned specifications and audit packages gain preference beyond viscosity-based selection. The market also has room for faster conversion from technical to premium grades in clusters across Gujarat, Maharashtra, and southern corridors, where large formulators and contract manufacturers consolidate procurement and expect consistent batch-to-batch performance.
On the supply side, manufacturers are building capability and footprint to address both domestic and overseas demand centers, supported by overseas supply-chain moves such as Apar Industries Middle East Limited entering a long-term base oil supply arrangement with Saudi Aramco Base Oil Company (Luberef) for operations in the Yanbu LubeHUB value park (announced in 2026). On the domestic demand and throughput front, Gandhar Oil Refinery (India) Ltd disclosed higher specialty oils and lubricants sales volumes for FY 2026 (including white oils), pointing to suppliers with consumer and FMCG exposure pushing higher-value applications alongside industrial uses.
Recent Industry Developments
- June 2026: Apar Industries Middle East Limited signed a long-term base oil supply agreement with Saudi Aramco Base Oil Company (Luberef) for operations within the LubeHUB value park in Yanbu, Saudi Arabia. The arrangement strengthens feedstock assurance for Apar’s specialty oil system and supports regionalized supply into MENA, which can influence global base oil sourcing patterns used by Indian specialty oil producers.
- April 2025: Daewoo, in partnership with Mangali Industries Ltd (MIL), announced investments to build lubricant manufacturing and exports from India, including plans for a facility in Kandla, Gujarat to produce white oil. The program adds new domestic capacity intent near a major port-led petrochemical corridor and supports faster export fulfillment from western India.
- July 2024: Texol Lubritech FZC (a foreign subsidiary of Gandhar Oil Refinery (India) Ltd) secured a contract from ADNOC Distribution to supply 30 million liters annually of lubricants for 2024, 2025, and 2026. The multi-year offtake improves utilization planning across specialty oil and lubricant operations and reinforces the company’s export positioning from India-linked supply chains.
Research Methodology Framework and Report Scope
Market Definition and Coverage
For this methodology, the India white oil market covers domestically consumed white oils used as high-purity mineral oils across industrial and consumer applications, measured in value terms for the country and across the study period.
Scope exclusions: We exclude petroleum jelly, waxes, and finished consumer products (such as creams and lotions) where white oil is only an ingredient, and we also exclude export-only production not supplied into India.
Segmentation Overview
- By Grade
- Technical / Industrial Grade
- Pharma and Other High-Purity Grades
- By Viscosity
- Low
- Medium
- High
- By Application
- Plastics and Elastomers
- Adhesives
- Personal Care
- Agriculture
- Food and Beverage
- Pharmaceutical
- Other Applications
Data Sources, Market Sizing, and Validation
Desk Research
Desk research was used to map the demand pool and keep the model tied to public signals that can be rechecked. We reviewed India-facing production, trade, and end-use context from sources such as the Ministry of Petroleum and Natural Gas, the Petroleum Planning and Analysis Cell, and the Directorate General of Commercial Intelligence and Statistics for import export series, and BIS standards that are referenced by downstream users.
To avoid relying on a single lens, we also cross-checked usage cues from sources such as the Central Drugs Standard Control Organization, published pharmacopoeia-related notes in public documents, and openly available technical literature on white oil use in polymers and personal care. Company annual reports, investor presentations, and reputed press coverage were used to validate capacity additions, grade positioning, and channel moves, and then a paid subscription for company financials and a shipment-level import export database were selectively used to sanity check volumes and price bands. The sources listed above are illustrative and not exhaustive, and many other references were used to collect data, validate assumptions, and clarify the final analysis.
Primary Interviews and Surveys
Primary work focused on validating how white oil demand is formed in India, and where specification shifts are showing up across pharma, personal care, food processing, and polymer processing. We spoke with refiners and blenders, importers and distributors, and large end users to confirm grade mix, typical viscosity choices, and how buyers qualify suppliers. We then used these inputs to tighten assumptions that were hard to observe through desk sources alone.
Distribution of primary research fieldwork respondents
| Company type | Respondent position |
|---|---|
| Top tier: 39% | CXOs: 16% |
| Mid tier: 45% | Functional/Unit leaders: 25% |
| Smaller Players: 16% | Managers: 59% |
Market-Sizing & Forecasting
The core market model is built using a top-down approach where India demand is reconstructed from end-use consumption logic and supply availability, and then checked against trade and domestic supply signals. In practice, we start with demand drivers by application, translate them into white oil usage using input rates and observed substitution patterns, and convert the implied volume into value using India-relevant price ranges by grade and viscosity.
Several market-specific inputs were tracked to keep estimates realistic, including the share shift between technical and pharma grade demand, viscosity preference by application, domestic availability versus import reliance, and typical pricing gaps between higher purity oils and industrial grades. We also used indicators such as pharma and personal care output momentum, food processing expansion cues, and polymer processing activity to explain why demand moves differently across years. The forecast was run using scenario analysis, where base case assumptions on end-use growth, grade upgrades, and price progression were reviewed and adjusted through expert feedback.
To corroborate totals, selective bottom-up approximations were built from supplier and channel checks, where sampled volumes were multiplied by typical ASP ranges, and then gaps were bridged with conservative assumptions when a segment had limited public visibility. Where responses diverged by end-use or customer type, we favored assumptions that could be defended through repeatable logic and were supported by more than one independent signal.
Data Validation & Update Cycle
Outputs are validated through triangulation across independent signals, and exceptions are investigated before sign-off. We compare modeled demand with import trends, capacity related news, and observed grade mix shifts, then run variance checks to spot abrupt changes that do not match end-use behavior.
A second analyst review is used to stress test assumptions on usage rates and pricing, and follow-up calls are triggered when a key input moves outside the expected band. Reports are refreshed annually, with interim updates when major capacity additions, regulatory changes, or sharp feedstock price movements materially change pricing or supply. Before delivery, a final pass is done to confirm that the latest public updates have been reflected in the model.
Mordor Intelligence's India White Oil Market Estimate Compared With Other Published Estimates
Published size numbers for India white oil can look far apart because the market is not always defined the same way, and some studies mix value and volume narratives without aligning conversion steps. Differences also come from how purity grades are treated, whether imports are fully captured, and whether price assumptions reflect actual India transaction ranges.
The biggest gap drivers usually sit in scope and in the price build, where some estimates fold adjacent specialty oils into white oil, or they assume aggressive price escalation even when the grade mix stays stable. Another common issue is that some figures use global per-ton averages and apply them directly to India volumes, which can overstate value when local supply, duty timing, and channel margins differ. Keeping the scope to white oils sold into India and converting from demand-led volumes into value using grade and viscosity price bands that are rechecked with buyers is what explains the difference, as modeled by Mordor Intelligence.
Benchmark comparison
| Source | Market Size | Gaps in Research Methodology |
|---|---|---|
| Mordor Intelligence | USD 0.35 B (2026) | |
| Industry Newsletter A | USD 0.47 B (2023) | Uses a broader specialty oil framing where white oil is discussed alongside adjacent high-purity oils, and the value estimate appears to rely on generalized pricing without clearly separating pharma-grade versus technical-grade realizations. |
| Regional Consultancy B | USD 2.43 B (2024) | Likely includes a much wider product scope or downstream formulations, and the gap versus typical India volume signals suggests price conversion assumptions that are not anchored to grade-wise demand or local trade and supply checks. |
The table shows that the spread is mainly explained by what is counted as white oil and how volume is converted into value across grades. By keeping the inputs tied to observable demand cues and repeatable pricing steps, the final market size stays easier to trace back to clear variables that can be revalidated during updates.
Key Questions Answered in the Report
How large is the India white oil market in 2026?
Volume reaches 319.95 million liters, reflecting its current scale across personal-care, pharmaceutical, and polymer segments.
What drives demand growth through 2031?
Shifts toward high-purity grades for cosmetics and pharma, plus expanding polymer-processing clusters, push volume to 346.73 million liters at a 1.62% CAGR.
Which application segment grows fastest?
Pharmaceutical formulations expand at 2.02% CAGR as India scales exports and domestic healthcare access.
Why do low-viscosity grades dominate?
Their pumpability and blending ease suit automated plants, giving them 67.60% market share in 2025 and a 1.63% CAGR outlook.
What risks could restrain growth?
Base-oil price volatility and substitution by silicone or synthetic esters present the largest headwinds.
Which regions consume the most white oil?
Gujarat and Maharashtra lead due to integrated refining, petrochemical, and personal-care manufacturing hubs.