
Market Overview
| Study Period | 2021 - 2031 |
|---|---|
| Forecast Data Period | 2026 - 2031 |
| Base Year Market Size (2025) | USD 3 Billion |
| Market Size (2026) | USD 3.25 Billion |
| Market Size (2031) | USD 4.82 Billion |
| Growth Rate (2026 - 2031) | 8.22 % |
| Market Concentration | Medium |
Major Players *Disclaimer: Major Players sorted in no particular order Image © Mordor Intelligence. Reuse requires attribution under CC BY 4.0. | |
India Transformer Market Analysis by Mordor Intelligence
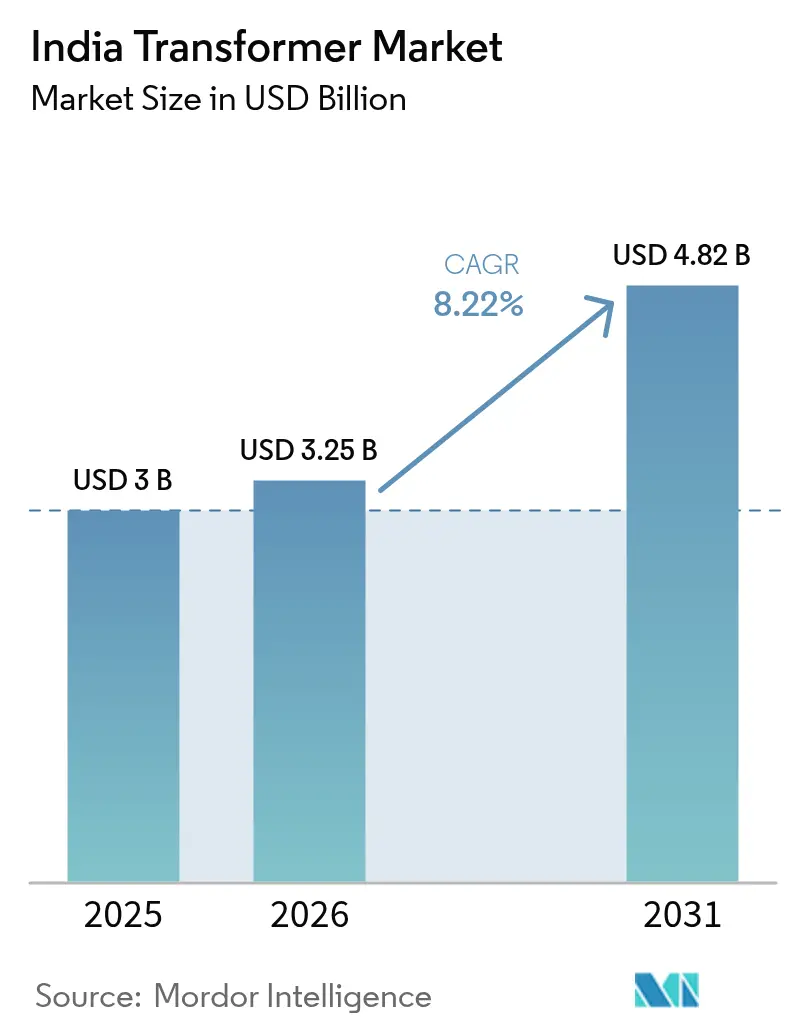
The India Transformer market size is expected to grow from USD 3 billion in 2025 to USD 3.25 billion in 2026 and is forecast to reach USD 4.82 billion by 2031 at 8.22% CAGR over 2026-2031.
Rapid grid modernization, peak demand growth, and government funding collectively drive this growth path. Investments worth INR 17 lakh crore over 2016-2024, and a similar quantum under construction, are scaling transmission corridors. Meanwhile, peak demand has jumped from 130 GW in 2014 to 243 GW in 2024 and is projected to exceed 400 GW by 2030.[1]Ministry of Power, “Annual Report 2025,” powermin.gov.in Distribution-side upgrades under RDSS, surging renewable integration, and the build-out of HVDC corridors are pushing utilities and commercial customers alike to place record transformer orders. Price volatility in CRGO steel and copper tempers margins but is partly offset by material-efficiency mandates and domestic manufacturing incentives.
Key Report Takeaways
- By power rating, medium-capacity units held 40.78% of the India transformer market share in 2025, while large transformers (above 100 MVA) are projected to register the fastest growth of 9.75% CAGR through 2031.
- By cooling type, oil-cooled models accounted for a 61.95% share in 2025; air-cooled variants are forecast to expand at an 8.86% CAGR through 2031.
- By phase, three-phase transformers dominated the market with a 72.05% share in 2025 and are also expected to log the highest CAGR of 8.64% over 2026-2031.
- By transformer type, distribution units captured 58.92% of the India transformer market size in 2025 and are set to grow at an 8.84% CAGR during the outlook period.
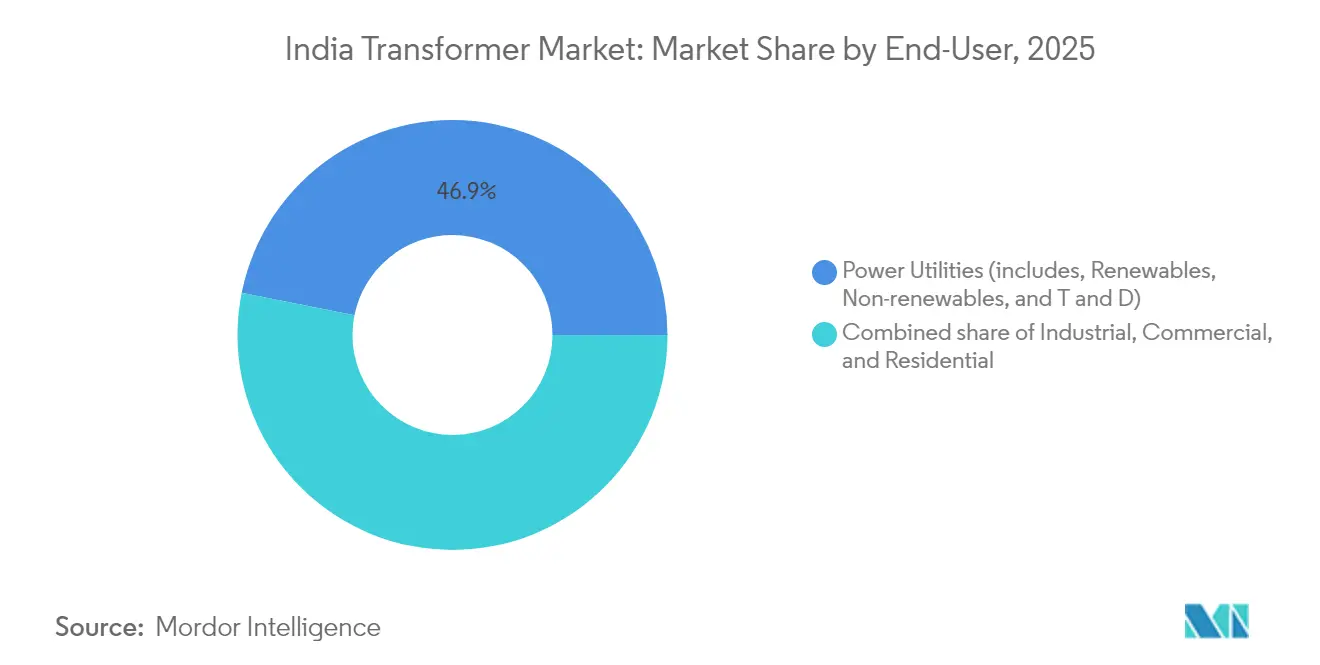
- By end-user, power utilities accounted for 46.85% revenue share in 2025, whereas the commercial segment is on track to record the strongest 10.98% CAGR to 2031.
Note: Market size and forecast figures in this report are generated using Mordor Intelligence’s proprietary estimation framework, updated with the latest available data and insights as of 2026.
India Transformer Market Trends and Insights
Drivers Impact Analysis*
| Driver | (~) % Impact on CAGR Forecast | Geographic Relevance | Impact Timeline |
|---|---|---|---|
| Modernisation & expansion of T&D infrastructure | +2.80% | National, concentrated in Gujarat, Maharashtra, Tamil Nadu | Medium term (2-4 years) |
| Surge in renewable-energy grid integration | +2.10% | Rajasthan, Gujarat, Karnataka, Andhra Pradesh | Long term (≥ 4 years) |
| Government funding under RDSS, IPDS, Saubhagya | +1.90% | National, priority to rural and underserved areas | Short term (≤ 2 years) |
| Growing industrial & commercial power demand | +1.20% | Industrial corridors: Delhi-Mumbai, Chennai-Bangalore | Medium term (2-4 years) |
| Digital substations & IoT-enabled smart transformers | +0.80% | Urban centers and critical transmission nodes | Long term (≥ 4 years) |
| Eco-friendly ester-filled transformers gaining traction | +0.50% | Environmentally sensitive areas, urban installations | Long term (≥ 4 years) |
| Source: Mordor Intelligence | |||
Modernisation & expansion of T&D infrastructure
The India transformer market benefits most strongly from large-scale grid build-outs authorized in the National Electricity Plan, which envisages 123,577 circuit km of new lines between 2022-2027. More than 193,000 circuit kilometers were already completed between 2014 and 2024, and 3,000 new substations were commissioned, creating consistent demand for power and auto-transformers across 220 kV to 800 kV classes. Power Grid Corporation’s Pan-India HVDC corridors, such as the Raigarh–Pugalur link, rely on specialized converter transformers, cementing domestic capability upgrades. The Green Energy Corridor-II, set to evacuate 33 GW of renewables, further tilts specifications toward 765 kV equipment, stimulating high-margin orders for extra-large units. Manufacturers with test bays above 800 kV are thus favored in utility tenders.
Surge in renewable-energy grid integration
Installed renewable capacity increased from 76.37 GW in 2014 to 226.79 GW by June 2025, with an additional 176.70 GW under construction.[2]Press Information Bureau, “Year-End Review 2024: Renewable Energy,” pib.gov.in Solar additions alone soared to 110.9 GW, necessitating step-up transformers at solar parks, while wind farms totaling 51.3 GW require units capable of managing variable reactive loads. The Central Electricity Authority also calls for 236.22 GWh of battery storage, implying the upcoming demand for converter transformers suited to bidirectional power flow. Hybrid wind-solar plants, which outpaced standalone solar bids in 2024, need transformers that integrate power electronics, creating new product niches. States with high renewable targets are therefore fast-tracking grid-connected transformer procurements.
Government funding under RDSS, IPDS, Saubhagya
A record INR 12,585 crore allocation under RDSS in FY 2024-25 equals 61% of the Ministry of Power budget, directly earmarked for distribution transformer upgrades. The program aims to reduce AT&C loss to 12-15%, mandating the use of low-loss amorphous-core or CRGO-grade replacements across feeders. Only 0.83 lakh of 52.7 lakh sanctioned distribution-transformer meters were installed by 2025, underscoring latent demand for new smart DTs. Rural water supply expansion under the Jal Jeevan Mission and one-crore rooftop installations under PM Surya Ghar both increase low-voltage transformer requirements. Procurement cycles are therefore front-loaded into the next two fiscal years.
Growing industrial & commercial power demand
Cargo-handling capacity almost doubled to 1,630 Mtpa in 2024, and 35 multimodal logistics parks worth INR 46,000 crore are underway, each needing dedicated substation assets. The length of the metro rail network grew fourfold to 993 km across 23 cities, driving sustained orders for traction transformers and 25 kV feeder systems. Rail electrification reached 93.83% of the broad-gauge network, but corridors in Assam and northeastern states still require autotransformers, keeping tender pipelines active.[3]Indian Railways, “Status of Electrification 2025,” indianrailways.gov.in Data center, airport, and commercial real estate investments cluster around the Delhi-Mumbai and Chennai-Bangalore industrial corridors, reinforcing demand for medium-power transformers. These capital projects translate into a predictable offtake over the medium term.
Restraints Impact Analysis*
| Restraint | (~) % Impact on CAGR Forecast | Geographic Relevance | Impact Timeline |
|---|---|---|---|
| Volatile prices of CRGO steel & copper | -1.80% | National manufacturing hubs | Short term (≤ 2 years) |
| Utility cap-ex delays & bid-price pressures | -1.20% | States with weak DISCOM finances | Medium term (2-4 years) |
| Skilled workforce shortage in design & testing | -0.70% | Manufacturing centers lacking technical institutes | Medium term (2-4 years) |
| Rising compliance cost for end-of-life oil disposal | -0.40% | Urban and industrial areas | Long term (≥ 4 years) |
| Source: Mordor Intelligence | |||
Volatile prices of CRGO steel & copper
CRGO steel and copper account for up to 70% of production costs, exposing manufacturers to annual price swings of 25-30% on global exchanges. Limited global CRGO suppliers heighten import risk during trade frictions, prompting makers to hedge or seek long-term contracts. The Ministry of Steel’s PLI scheme encourages domestic CRGO production, but capacity additions remain at least two years away. In the meantime, OEMs use price-variation clauses in tenders, although state utilities often cap pass-throughs, thereby squeezing margins. Some vendors substitute amorphous alloys; however, the higher initial costs limit their use to select distribution transformers.
Utility cap-ex delays & bid-price pressures
DISCOM debts constrain ordering cycles, leading to postponed tenders and aggressive L1 pricing norms. Between 2020 and 2024, 38.3 GW of renewable tenders were cancelled, resulting in shifts in transformer delivery schedules. States with healthier books, such as Gujarat, keep steady procurement, but others award contracts in spikes, complicating factory capacity planning. Vendors counter by diversifying into commercial and export markets, but thin margins persist when base-metal costs rise.
*Our forecasts treat driver/restraint impacts as directional, not additive. The impact forecasts reflect baseline growth, mix effects, and variable interactions.
Segment Analysis
By Power Rating: Larger units accelerate grid modernization
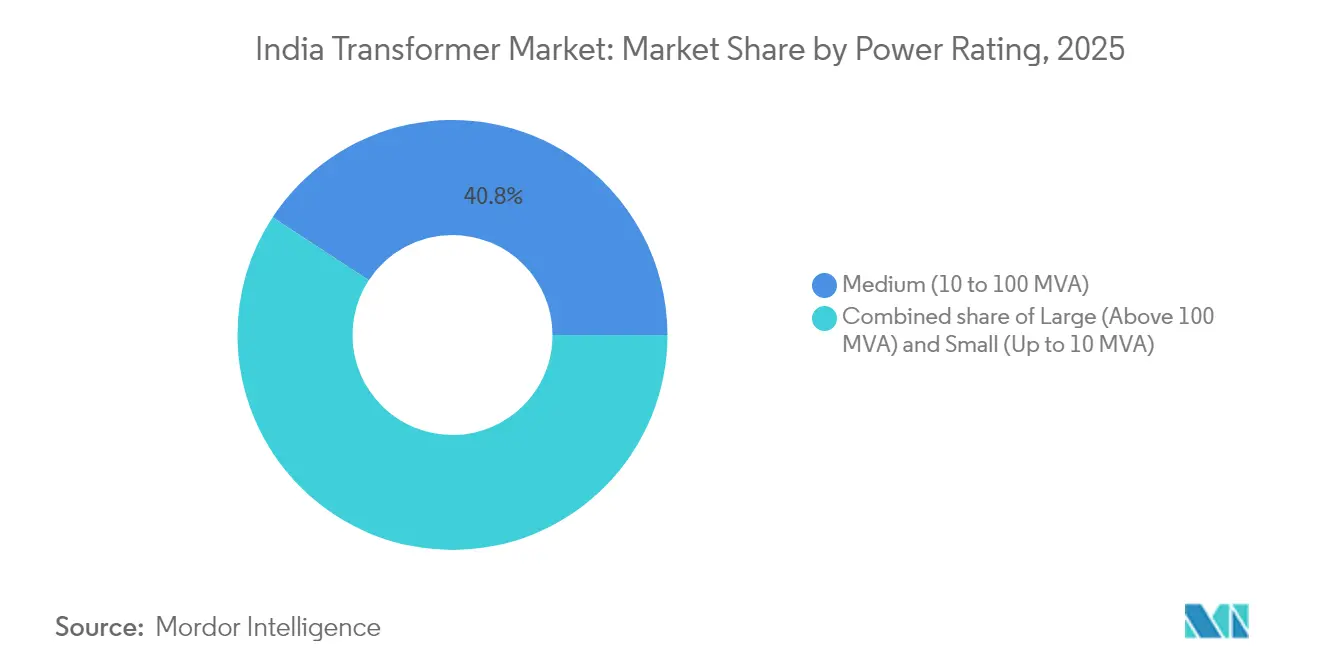
In 2025, medium-rating transformers (10-100 MVA) held the largest 40.78% slice of the India transformer market. They underpin sub-transmission grids that feed rapidly growing industrial zones and metropolitan areas. Utilities favor these sizes for 220 kV substations that bridge generation clusters to urban loads. The India transformer market size for large units above 100 MVA is poised to climb 9.75% CAGR, thanks to HVDC corridor roll-outs and renewable evacuation mandates. Each 800 kV-rated link displaces multiple 400 kV circuits, resulting in fewer but higher-value contracts that lift average selling prices. Vendors are expected to ensure that the India transformer market continues to shift, with a 600-ton test bay capacity enjoying a competitive edge in this premium tier.
Demand for smaller units, below 10 MVA, remains steady in rural feeders and for rooftop solar interconnections. Programs such as PM KUSUM create pockets of growth by subsidizing agricultural pump electrification, but thinner margins offset volume gains. Overall, rising voltage levels and corridor lengths ensure the India transformer market continues shifting toward higher-capacity products over the forecast period.


By Cooling Type: Environmental rules shape adoption
Oil-cooled transformers held a dominant 61.95% share in 2025, reflecting their cost efficiency at high power levels. They remain indispensable for 220 kV and above, where thermal loads are extensive. However, air-cooled units are expanding at an 8.86% CAGR, aided by urban fire safety norms and lower maintenance cycles. City metros and data centers are increasingly specifying dry-type or cast-resin designs to mitigate the risk of oil leaks. Ester-based fluids further diversify demand, particularly where environmental clearances dictate biodegradable coolants. Given growing policy emphasis, vendors are redesigning tank geometries and insulation systems to accommodate multiple cooling media within the same production line, maximizing flexibility in the India transformer industry.
By Phase: Three-phase systems remain the backbone
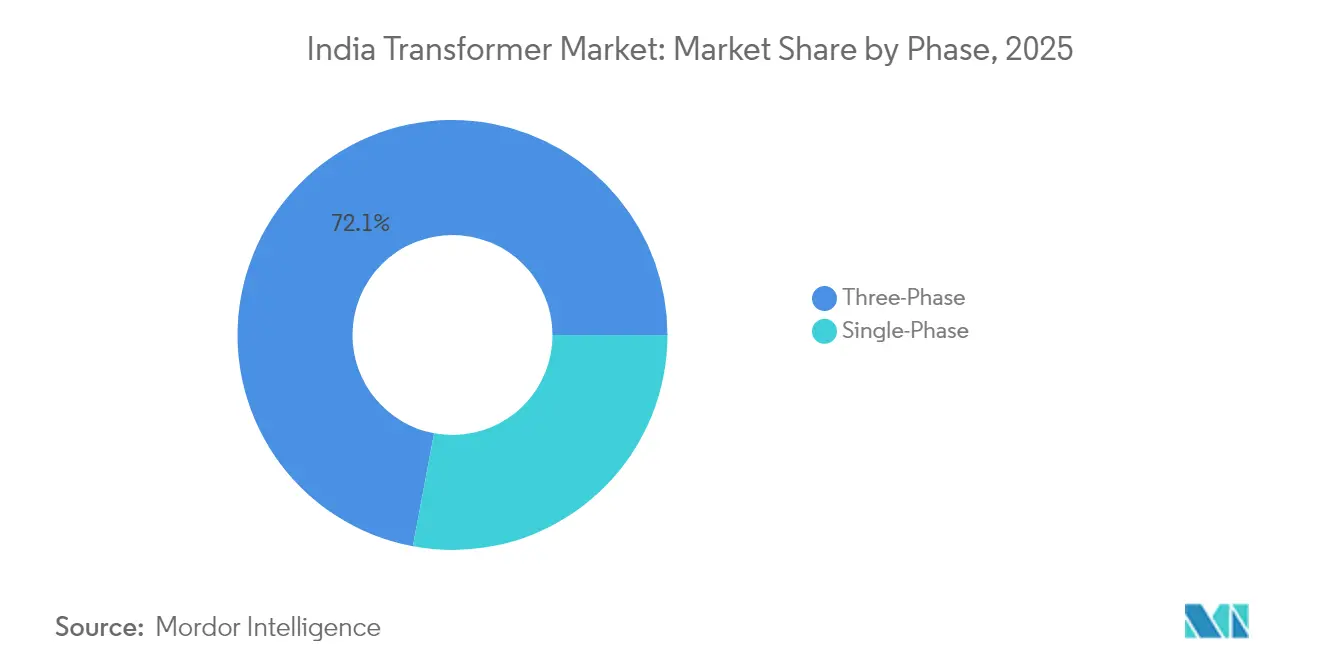
Three-phase products commanded 72.05% of shipments in 2025 and are projected to outpace single-phase units at an 8.64% CAGR. Their efficiency and load-balancing capability align with India’s three-phase AC grid. Single-phase equipment will continue serving last-mile rural connections, but ongoing household electrification saturation limits incremental volumes. Smart-grid pilots increasingly require three-phase monitoring for harmonic analysis, tilting future tenders in their favor.
By Transformer Type: Distribution units stay pivotal
Distribution transformers captured 58.92% of the market value and are also expected to grow at the fastest rate of 8.84% CAGR, as RDSS targets curbs in AT&C losses. Only 2% of sanctioned DT meters have been installed, guaranteeing retrofits across the installed base. Power-transformer orders parallel transmission projects, such as the 123,577 circuit km plan, but their growth pace trails that driven by DT. Digital monitoring and amorphous cores are becoming standard bid specifications, lifting the average selling price within the India transformer market.
By End-User: Commercial demand leads growth
Utilities still accounted for 46.85% of revenues in 2025, supported by central funding mechanisms. Yet, commercial segment revenues will log an 10.98% CAGR, buoyed by data centers, logistics hubs, metropolitan areas, and airports. Cargo port expansion and multi-modal parks demand compact, high-capacity substations, which draw premium pricing. Industrial offtake remains steady as automotive and steel plants expand, while residential additions stabilize after saturation with Saubhagya.
Geography Analysis
Highly industrialized western and southern states—Maharashtra, Gujarat, Tamil Nadu, and Karnataka—generate roughly 60% of India's transformer market annual demand. Maharashtra's automotive belts and metro expansions sustain both medium and distribution class orders, whereas Gujarat's solar parks and petrochemical complexes tilt demand toward step-up and specialty units. Tamil Nadu integrates wind-farm evacuation with port electrification projects, creating a balanced mix of cooling types.
Northern states such as Uttar Pradesh and Haryana contribute significant volumes through agricultural feeders and industrial corridor substations. Rajasthan's 18 GW solar base requires collector-station transformers and 765 kV inter-state links to transport power to load centers. Eastern hubs—West Bengal, Odisha, and Jharkhand—leverage mining electrification and steel capacity additions, but face DISCOM-driven capital expenditure delays that hinder procurement.
Northeastern states remain under-penetrated yet strategic. Hydro potential and incomplete rail electrification create future tender opportunities for ruggedized designs on tough terrain. Export activity clusters around manufacturing bases in Tamil Nadu, Gujarat, and Karnataka, where the Production Linked Incentive scheme encourages outbound shipments of power equipment, positioning India as an emerging hub for transformer exports.
Regulatory Landscape
India transformer specifications and procurement are increasingly shaped by standardized technical and efficiency requirements led by the Central Electricity Authority (CEA), the Ministry of Power (MoP), the Bureau of Indian Standards (BIS), and the Bureau of Energy Efficiency (BEE). In January 2026, CEA directed power utilities to comply with standardized transformer and reactor specifications for 66 kV and above equipment, aligning with CEA guidelines and enforceable under CEA Regulations 2022. This narrows the room for non-standard designs in public tenders.
For distribution transformers, MoP amended energy conservation standards in December 2025, linking compliance to IS 2026 (Part 1): 2011 performance requirements (including parameters such as short-circuit and impedance) and tightening tender acceptance around loss limits. Across segments, BIS certification and BEE labeling act as core market-entry requirements, and utilities use IS 1180 (Part I) loss limits with zero positive tolerance in many procurement programs. In May 2026, CEA, working with the All India Discoms Association (AIDA), released Standard Technical Specifications for CRGO core distribution transformers to harmonize DISCOM procurement and quality benchmarks nationally.
Competitive Landscape
The India transformer market is moderately concentrated in terms of competition. BHEL, Hitachi Energy India, Siemens, ABB, and CG Power collectively command a sizable share through in-house manufacturing, government relationships, and extensive voltage portfolios. BHEL leads in central-utility awards, while Hitachi-Energy focuses on HVDC converter units. Siemens increased its stake to 69% in 2024 to deepen local integration and enhance digital offerings. ABB logged record revenues on the back of automation-edge synergies that bundle transformers with SCADA and drives.[4]ABB India, “Q4 2024 Financial Results,” abb.com
Strategically, incumbents expand factory footprints and test bays to qualify for 800 kV class bids. They also embed IoT sensors and digital twin platforms to launch service-oriented revenue streams. Emerging players, such as Voltamp and Indo Tech, compete on cost in the distribution and mid-range power segments, capitalizing on regional proximity to utilities. White-space opportunities remain in offshore wind and battery storage interfaces, where very few domestic lines yet exist.
Material cost swings and BIS certification timelines serve as entry barriers, favoring cash-rich incumbents. Nonetheless, PLI incentives for CRGO manufacturing and export of electrical equipment could attract new joint ventures, slightly reducing long-term concentration.
India Transformer Industry Leaders
Bharat Heavy Electricals Ltd (BHEL)
Hitachi Energy India Ltd
Siemens Ltd (India)
CG Power & Industrial Solutions Ltd
GE T&D India Ltd
- *Disclaimer: Major Players sorted in no particular order


Market Opportunities and Future Outlook
Grid standardization and program-led procurement are creating clearer whitespace for manufacturers that can scale compliant, standardized portfolios across distribution and EHV classes. CEA mandates for standardized 66 kV and above ratings, together with MoP energy conservation updates tied to IS 2026 and stricter loss acceptance practices under IS 1180 (Part I), favor suppliers with strong BIS/BEE compliance capabilities, in-house testing, and repeatable designs that align with national templates rather than project-by-project customization.
On the supply side, capacity additions by major OEMs point to a renewed focus on large power transformer and EHV readiness, which supports opportunities in localization, component supply, and high-voltage test infrastructure. In June 2026, Hitachi Energy India announced an approximately INR 2,000 crore investment for a new large power transformer factory at Karjan, Vadodara, with completion scheduled for FY2028. Siemens Energy approved an approximately INR 2,060 crore investment (February 2026) for a new power transformer factory adding around 30,000 MVA of capacity, and CG Power indicated (July 2026) a capacity expansion plan toward 110,000 MVA with phased additions from September 2026. Demand pull is reinforced by transmission build-out planning under the National Electricity Plan, which envisages 1,274 GVA of transformation capacity additions (220 kV and above) and 33.2 GVA of HVDC transformation capacity by 2031-32, sustaining tender pipelines for EHV, HVDC-associated transformer packages, and digital-monitoring-ready designs.
Recent Industry Developments
- June 2026: Hitachi Energy India announced an approximately INR 2,000 crore investment to build a new large power transformer factory in Karjan, Vadodara, Gujarat, with completion scheduled for FY2028. The expansion increases domestic availability for EHV-class transformers used in transmission expansion and renewable evacuation. It also raises competitive pressure for high-value utility tenders as local capacity and delivery assurance improve.
- February 2026: Siemens Energy India approved an investment of INR 2,060 crore to set up a new power transformer factory, adding about 30,000 MVA of manufacturing capacity. The planned greenfield capacity supports larger, standardized transformer programs aligned with national transmission planning and utility procurement templates. It also signals longer-term supplier positioning for EHV/HVDC-adjacent demand and higher testing and quality benchmarks.
- December 2025: BHEL received a Power Grid Corporation of India Limited (PGCIL) contract worth Rs 3,618 million for 17 units of 765/400 kV, 500 MVA single-phase transformers. The award highlights continued utility spending on EHV transformation capacity, supporting high-margin, high-complexity manufacturing lines. It also strengthens the incumbent vendor base for large-rating tenders where qualification, testing capability, and delivery performance are key selection factors.


Research Methodology Framework and Report Scope
Market Definition and Coverage
For this report, the market covers revenue earned in India from new transformers supplied to utilities and end-users, including power and distribution units sold across common cooling types, phases, and MVA ratings.
Scope exclusions: We exclude installation labor as a separate service line, routine repair work, and used or refurbished transformer resale values.
Segmentation Overview
- By Power Rating
- Large (Above 100 MVA)
- Medium (10 to 100 MVA)
- Small (Up to 10 MVA)
- By Cooling Type
- Air-cooled
- Oil-cooled
- By Phase
- Single-Phase
- Three-Phase
- By Transformer Type
- Power
- Distribution
- By End-User
- Power Utilities (includes, Renewables, Non-renewables, and T&D)
- Industrial
- Commercial
- Residential
Data Sources, Market Sizing, and Validation
Desk Research
Desk research set the starting structure for the model and helped us place India demand in context. We referenced public energy and grid planning statistics, such as Central Electricity Authority (CEA) reports, Ministry of Power updates, and policy documents that indicate capacity additions and network strengthening needs.
To convert these signals into a practical revenue model, we also reviewed standards and technical references that indicate typical transformer design shifts over time, such as BIS and IEC publications. We combined this with trade data from the Directorate General of Commercial Intelligence and Statistics (DGCI&S) and Customs-linked releases to cross-check import and export movement. Company annual reports, investor presentations, and audited financial statements were used to understand product mix and timing of large orders, supported by patent databases and a news and financials subscription for tracking tender wins and plant expansions. These examples are illustrative and not exhaustive, and many other sources were also checked to collect, validate, and clarify the final assumptions.
Primary Interviews and Surveys
Primary work focused on validating the demand drivers behind transformer buying cycles in India and tightening pricing and mix assumptions across ratings and end-user groups. We spoke with participants across manufacturers, component suppliers, utilities, EPC-linked buyers, and large industrial users. The feedback was balanced across India regions to avoid a single-state or single-program bias, and inputs helped refine which utility procurement programs translated into new transformer orders versus parts of the replacement cycle that may not show up in time-series shipment data.
Distribution of primary research fieldwork respondents
| Company type | Respondent position |
|---|---|
| Top tier: 35% | CXOs: 17% |
| Mid tier: 46% | Functional/Unit leaders: 27% |
| Smaller Players: 19% | Managers: 56% |
Market-Sizing & Forecasting
Sizing started with a top-down build that reconstructs annual transformer demand from India grid expansion and replacement activity, and then translates that demand into revenue using rating mix and price bands. Once the demand pool was set, it was reconciled with selective bottom-up checks using sampled manufacturer sales disclosures, tender award values, and an ASP multiplied by volume sanity check for key rating buckets.
A few practical inputs were tracked because they move the market in a visible way, including planned transmission and distribution additions, procurement intensity from utilities, the shift in demand between small, medium, and large MVA ranges, the split between oil-cooled and air-cooled units, and the changing share of three-phase equipment in distribution-heavy programs. Where granular volumes were not directly observable, gaps were handled through conservative mix assumptions that were reviewed in interviews, followed by adjustments to keep totals aligned with public spending signals.
For forecasting, we relied on scenario analysis anchored to announced grid projects and expected replacement cycles, then tuned the yearly path using expert consensus on lead times, tender execution, and price movement. In periods where steel and copper costs were expected to swing, ASP progression was modeled with a cautious step-up pattern rather than a straight-line trend.
Data Validation & Update Cycle
Outputs were checked against independent indicators, including utility capex direction, tender activity patterns, and the consistency of implied transformer pricing across MVA ranges. If a segment showed an unexpected jump, the underlying inputs were rechecked, and follow-up calls were triggered to confirm whether the shift was real or caused by timing or currency conversion.
Before sign-off, the model goes through multiple analyst reviews so assumptions, math, and year-to-year movements stay consistent with the supporting signals. Reports are refreshed annually, and interim updates are done when a material event changes demand visibility, such as a major policy revision or a sharp commodity-driven pricing change. Right before delivery, a final pass is completed to ensure the latest public updates are reflected.
Mordor Intelligence's India Transformer Market Size Compared Against Other Published Estimates
Published market numbers for India transformers can vary because each publisher uses its own timing, currency conversion practice, and level of checking on price and mix assumptions. Differences also come from whether the count is anchored to shipments, order intake, or only utility procurement, which can shift totals in years with lumpy tenders.
The spread is often explained by how frequently pricing is refreshed and how carefully ASP changes are tied to rating mix, copper and steel trends, and realized tender prices, instead of using one average price for all units. The 2025 value here is kept aligned to the same-year exchange rate window and is rechecked against tender signals and mix shifts before lock-in. This is where Mordor Intelligence tends to differ from one-time conversions or infrequent price updates.
Benchmark comparison
| Source | Market Size | Gaps in Research Methodology |
|---|---|---|
| Mordor Intelligence | USD 3.00 B (2025) | |
| Trade Journal A | USD 5.10 B (2024) | Uses an earlier year and appears to reflect a wider equipment basket alongside transformers, with limited clarity on rating mix and USD conversion timing. |
| Industry Magazine B | USD 3.00 B (2025) | Matches the base-year value but does not explain how ASPs are stepped forward by rating bucket, so forecast totals can drift when commodity pass-through and tender execution timing change. |
The comparison shows that the biggest differences usually come from what is counted around transformers and how pricing is translated into USD for a specific year. When scope is kept to transformer sales in India and the price-mix logic is refreshed against current procurement signals, the result is easier to trace and replicate across years.


Key Questions Answered in the Report
How large is the India transformer market in 2026?
The market is valued at USD 3.25 billion in 2026 and is tracking toward USD 4.82 billion by 2031, indicating healthy interim growth.
What CAGR is expected for transformers above 100 MVA?
Large transformers are projected to expand at a 9.75% CAGR over 2026-2031, outpacing medium and small categories.
Which cooling technology is gaining traction in urban areas?
Air-cooled and ester-filled transformers are rapidly adopted in cities due to fire-safety and environmental benefits.
Why are distribution transformers replacing existing units?
RDSS mandates loss reduction, so utilities are swapping older models for low-loss amorphous-core units and adding smart meters.
Which states contribute most to transformer demand?
Maharashtra, Gujarat, Tamil Nadu, and Karnataka together account for about 60% of national demand thanks to industrialization and renewable build-outs.
Page last updated on:


 Your data is secure and never sold or shared.


