Market Overview
| Study Period | 2019 - 2030 |
|---|---|
| Base Year For Estimation | 2024 |
| Forecast Data Period | 2025 - 2030 |
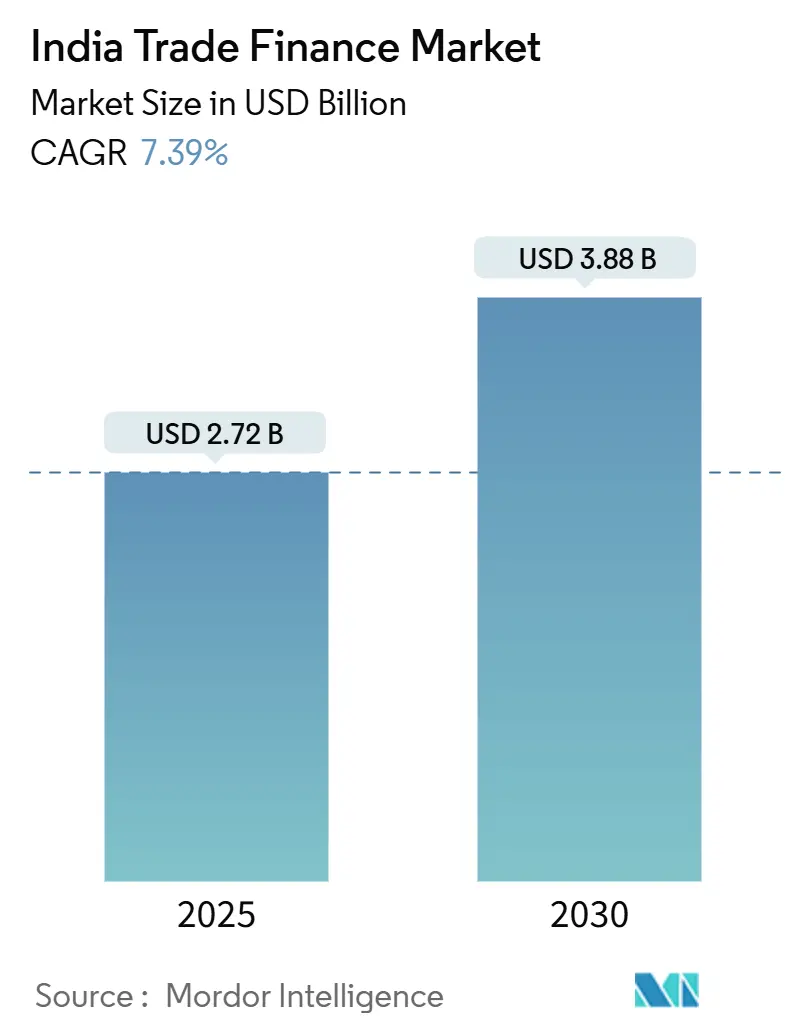
| Market Size (2025) | USD 2.72 Billion |
| Market Size (2030) | USD 3.88 Billion |
| Growth Rate (2025 - 2030) | 7.39% CAGR |
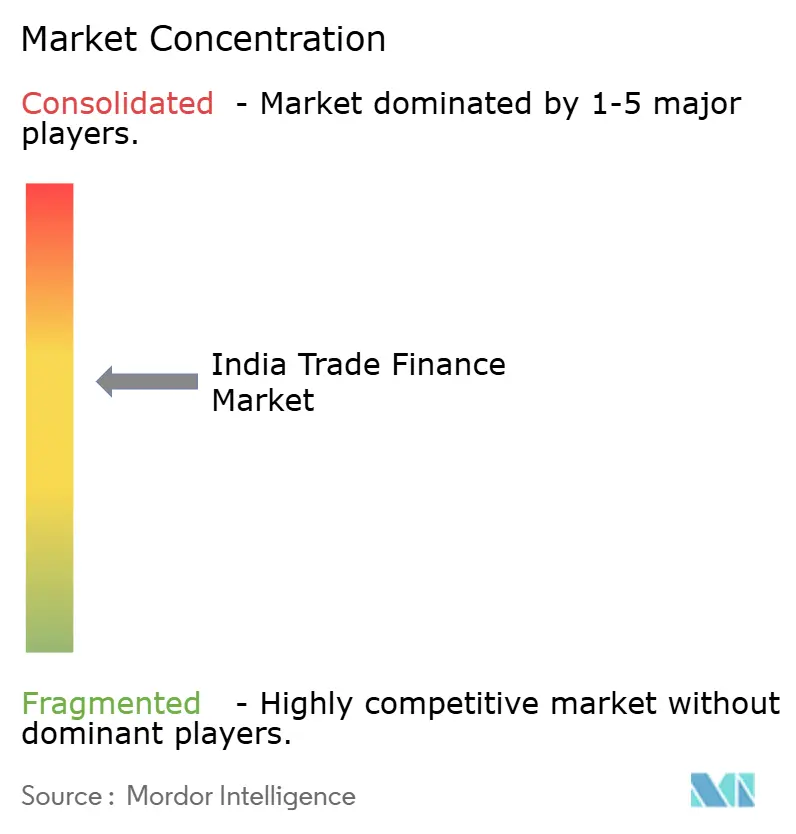
| Market Concentration | Medium |
Major Players
*Disclaimer: Major Players sorted in no particular order Image © Mordor Intelligence. Reuse requires attribution under CC BY 4.0. |
|
India Trade Finance Market Analysis by Mordor Intelligence
The India trade finance market is valued at USD 2.72 billion in 2025 and is forecasted to reach USD 3.88 billion by 2030, advancing at a 7.39% CAGR. Government export-push schemes, a maturing digital‐payments backbone, and widening credit access for micro, small, and medium enterprises (MSMEs) continue to accelerate growth. Revised Foreign Exchange Management Act rules now let overseas branches of Indian banks open INR accounts for non-residents, enabling direct rupee settlement and lowering reliance on costly correspondent banking networks. Production-linked incentive (PLI) programs and new free-trade agreements (FTAs) are concentrating pre-export financing demand in select clusters, while mandatory e-invoicing and the Trade Receivables Discounting System (TReDS) compress cash-conversion cycles for domestic supply chains. A widening MSME working-capital gap, liberalization at Gujarat International Finance Tec-City (GIFT City), and the rise of ESG-linked lending create additional revenue pools for incumbents and fintech newcomers. Although rising non-performing assets (NPAs) and multi-layer compliance burdens temper near-term momentum, technology-driven risk tools and specialized insurance covers mitigate downside pressures.
Key Report Takeaways
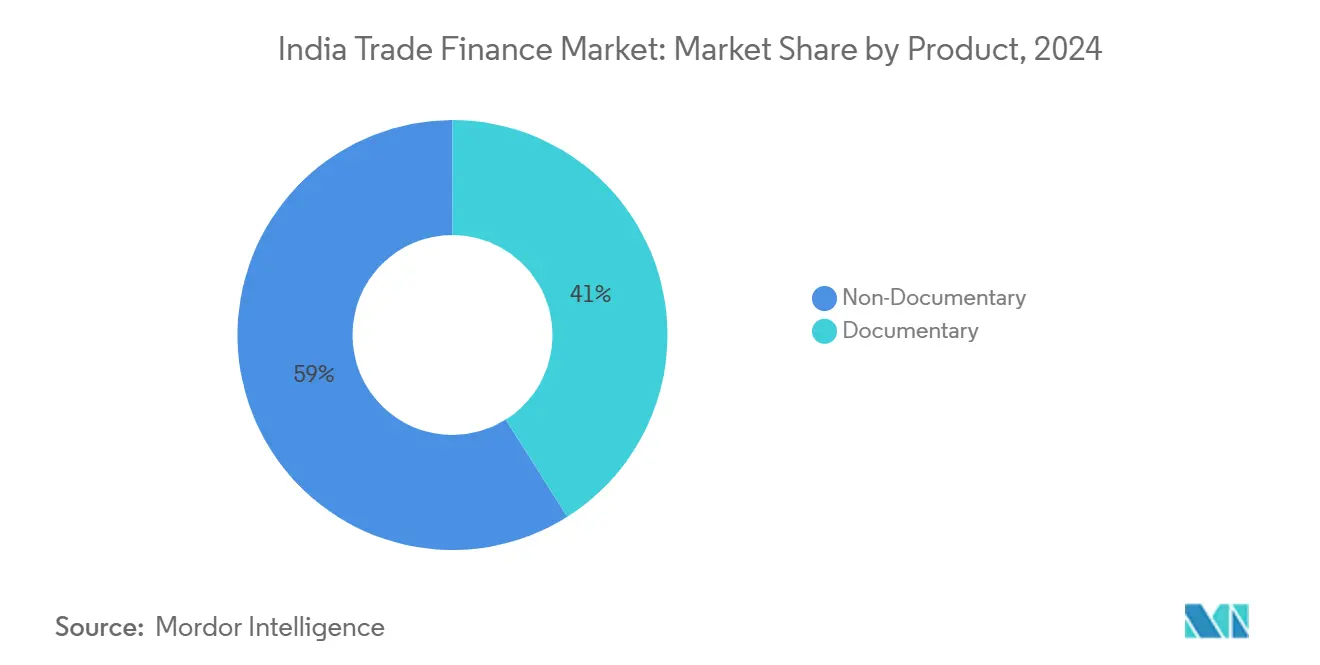
- By product category, the non-documentary segment led with 58.96% share of the India trade finance market in 2024; the segment is projected to expand at an 8.67% CAGR through 2030.
- By service provider, banks held 76.59% of the India trade finance market share in 2024, whereas other service providers are set to grow at a 10.62% CAGR to 2030.
- By application, international business accounted for 56.87% of the India trade finance market size in 2024; the domestic segment is expected to advance at an 8.35% CAGR through 2030.
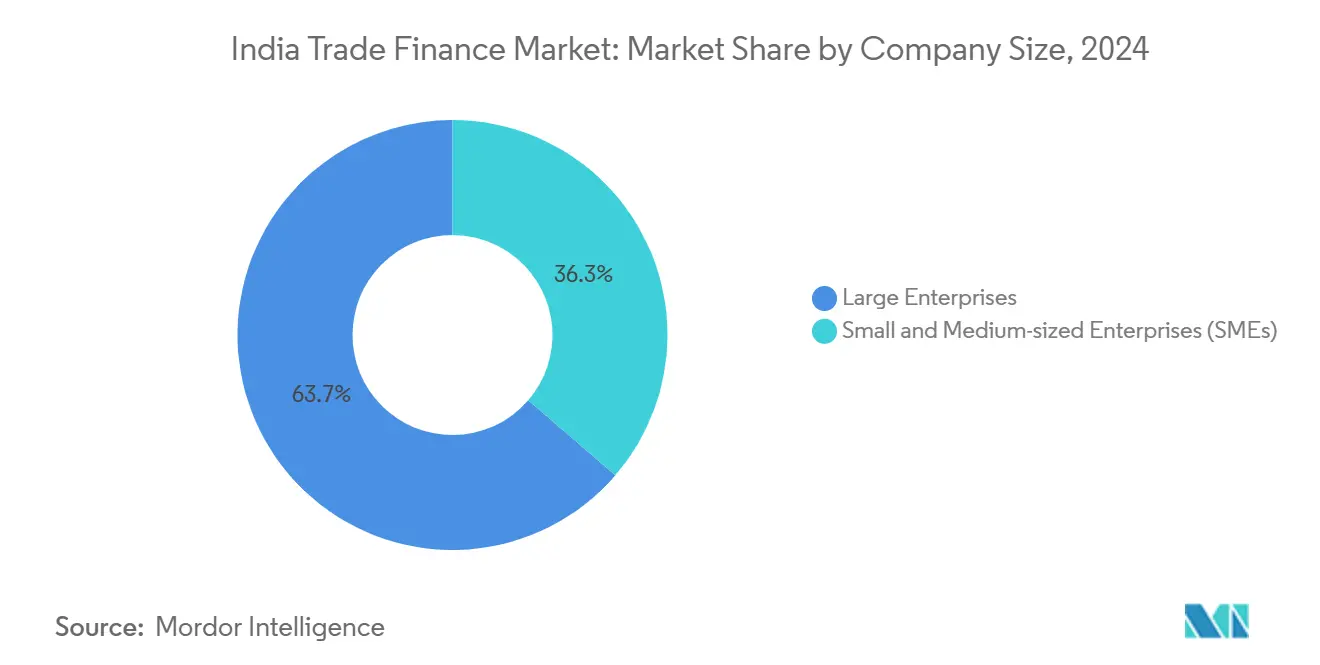
- By company size, large enterprises controlled 63.68% of the India trade finance market value in 2024, but SMEs represent the fastest expansion at a 12.06% CAGR through 2030.
- By financing structure, the non-structured segment captured 60.88% of the India trade finance market size in 2024, while structured products are expected to progress at a 9.16% CAGR to 2030.
India Trade Finance Market Trends and Insights
Drivers Impact Analysis
| Driver | (~) % Impact on CAGR Forecast | Geographic Relevance | Impact Timeline |
|---|---|---|---|
| Government export-push programmes (PLI, FTAs) | +1.8% | National; early gains in manufacturing hubs | Medium term (2–4 years) |
| Rapid e-Invoicing & TReDS adoption | +1.2% | National; fastest pickup in urban centers | Short term (≤ 2 years) |
| MSME working-capital gap widens | +1.5% | National; strongest in tier-2 and tier-3 cities | Long term (≥ 4 years) |
| GIFT City liberalization | +0.9% | Western India; network effects in financial corridors | Medium term (2–4 years) |
| Fintech platforms attracting offshore capital | +0.8% | Mumbai–Delhi–Bengaluru corridors | Short term (≤ 2 years) |
| ESG-linked trade-finance mandates | +0.6% | Export-oriented regions | Long term (≥ 4 years) |
| Source: Mordor Intelligence | |||
Government Export-Push Programs Create Sector-Specific Credit Concentration
PLI outlays—in electronics (INR 41,000 crore), pharmaceuticals (INR 15,000 crore), and automotive components (INR 25,938 crore)—tie working-capital disbursements to export milestones, letting banks price facilities on compliance metrics rather than standalone balance-sheet ratios. FTAs such as the India-UAE pact that lifted bilateral trade to USD 65 billion in 2023 and aims at USD 100 billion by 2030 amplify sudden pre-export funding spikes. Lenders have formed PLI-only desks and built dashboards that track order fulfilment against drawdowns, improving risk visibility and reducing per-transaction costs.
Rapid E-Invoicing and TReDS Adoption Transform Working-Capital Access
Businesses with turnover above INR 5 crore must now issue electronic invoices, creating a standardized data lake for real-time credit scoring[1]GST Network, “E-Invoicing Mandate,” gst.gov.in. TReDS platforms—RXIL, M1xchange, and A.TREDS—have financed invoices worth more than INR 270 billion, shrinking cash-conversion cycles from 45 days to under a week on average[2]Reserve Bank of India, “Trade Receivables Discounting System Data,” rbi.org.in. Dynamic pricing based on buyer credit quality replaces legacy models that priced against seller financials, giving smaller vendors cheaper funding and freeing large buyers to extend payment terms without hurting suppliers’ liquidity.
MSME Working-Capital Gap Creates Sustainable Growth Opportunity
India’s formal MSME credit gap sits near INR 103 trillion, even though the sector contributes 29% to GDP. Alternative data—utility bills, GST filings, and bank-statement analytics—now feed machine-learning engines that translate thin-file histories into predictive risk scores. The Open Credit Enablement Network (OCEN) uses standardized APIs so lenders can grab consented data in seconds, dropping customer-acquisition costs by 60% and enabling “pay-as-you-grow” credit lines. Specialized NBFCs report 16-18% annual loan-book growth from 2024-2026, outpacing public-sector banks.
GIFT City Liberalization Attracts International Trade-Finance Flows
Eased capital rules and a 10-year tax holiday lure offshore banks into the International Financial Services Centre, allowing them to book dollar and rupee deals under a single regulator. HSBC’s January 2025 expansion created the hub’s first full-service wealth and corporate-finance desk for non-resident Indians. Stamp duty exemptions have lifted Ahmedabad’s share of national equities turnover to 25.3% on BSE and 16.9% on NSE, spawning adjacent demand for settlement credit and guarantees.
Restraints Impact Analysis
| Restraint | (~) % Impact on CAGR Forecast | Geographic Relevance | Impact Timeline |
|---|---|---|---|
| Rising NPA / counter-party-risk concerns | -1.4% | National; industrial lending centres | Short term (≤ 2 years) |
| Complex multi-layer compliance (KYC/AML) | -0.8% | National; cross-border corridors | Medium term (2–4 years) |
| USD liquidity & forex-swap volatility | -0.6% | Import-dependent hubs | Short term (≤ 2 years) |
| Low SME awareness of factoring/TReDS | -0.5% | Rural, tier-2/3 cities | Long term (≥ 4 years) |
| Source: Mordor Intelligence | |||
Rising NPA Concerns Constrain Bank Credit Expansion
Unsecured consumer credit now makes up 51.9% of new NPAs, leading regulators to hike risk weights on unsecured portfolios. Although trade-finance defaults remain lower, supply-chain contagion risk elevates caution. Banks require higher collateral margins and shorter tenors, nudging borrowers toward NBFCs that price risk more aggressively but at higher spreads.
Complex Multi-Layer Compliance Creates Operational Bottlenecks
RBI’s 2025 KYC circular mandates real-time screening, adverse-media checks, and rule-based transaction monitoring for every cross-border payment. Smaller institutions lacking scale in compliance tech face processing delays that stretch a letter-of-credit issuance to 48 hours instead of the targeted same-day turnaround. Fintechs lobby for video-KYC thresholds allowing merchants with sub-INR 50,000 monthly flows to self-onboard, but adoption awaits regulator approval.
Segment Analysis
By Product: Non-Documentary Offerings Underpin Digital Momentum
At 58.96% share in 2024, non-documentary receivables finance anchors the India trade finance market and is racing ahead at an 8.67% CAGR. Factoring, forfaiting, and supply-chain finance thrive because standardized e-invoice data shorten risk assessment from days to minutes. Documentary letters of credit retain relevance for bulk commodities, but their growth lags as corporates embrace lower-cost open-account solutions. Payables finance gains traction among large buyers targeting double-digit improvements in cash flow, while guarantees and insurance remain crucial in sectors such as defense, infrastructure, and agro-commodities. Blockchain pilots now embed smart contracts that release funds on verified delivery, trimming fraud risk and supporting higher funding limits.
Get Detailed Market Forecasts at the Most Granular Levels
Download PDF
By Service Provider: Banks Remain Anchors as FinTech Scale Niches
Banks captured 76.59% of the India trade finance market in 2024 through universal licences that package FX, cash management, and trade credit. Yet alternative platforms are expected to grow at a 10.62% CAGR by serving tickets under USD 25,000, where traditional cost structures are prohibitive. TReDS operators earn auction fees instead of spread, improving economics for thin-margin invoices. Trade-credit insurers like ECGC cover up to 90% of export losses, lengthening credit tenors to 180–360 days. Fintechs plug balance-sheet limits through co-lending; for instance, Axis Bank funds 80% of an approved line, while a partner NBFC carries first-loss risk.
By Application: Cross-Border Dominance, Domestic Acceleration
International deals captured a 56.87% share of the India trade finance market in 2024, reflecting higher values and multi-currency complexity. The India trade finance market size for domestic receivables is set to expand at an 8.35% CAGR over the forecast period as e-invoicing normalizes data quality and UPI’s offshore corridors slash remittance costs. Rupee-settlement mechanisms via Special Vostro Accounts reduce FX charges by 20-30 basis points, making local-currency letters of credit viable for trade with Russia and parts of Africa.
By Company Size: Large-Corporate Scale vs. SME Growth Outperformance
Large enterprises accounted for 63.68% share of the India trade finance market in 2024, thanks to sizable order books and bespoke structured needs. However, SME-focused volume is set to jump at a 12.06% CAGR; lenders gain comfort from GST trail data and Udyam registrations that validate turnover and compliance histories. The India trade finance market for SME invoice finance is anticipated to witness significant growth by 2030, driven by automated credit lines pooled through OCEN pipes.
Get Detailed Market Forecasts at the Most Granular Levels
Download PDF
By Financing Structure: Standardized Products Retain Majority Share
Non-structured facilities command a 60.88% share of the India trade finance market in 2024, benefitting from template documents and rapid straight-through processing. Structured assets, projected to grow 9.16% annually, stitch together cross-currency swaps, escrow, and performance guarantees, particularly in capital-goods exports. GIFT City’s sandbox produces novel structures such as participatory notes on receivables pools and dual-currency supply-chain programs that settle in INR but hedge in USD onshore.
Geography Analysis
Mumbai, housing the Reserve Bank of India and most head-office trade desks, processes a considerable share of all funded exposures, cementing its hub status. Its adjacency to GIFT City allows banks to toggle between onshore and offshore books, trimming capital costs. Delhi channels large public-sector engineering, defense, and infrastructure exports due to its proximity to federal ministries, contributing significantly to national throughput.
Chennai supports southern automotive and pharma exports, playing a significant role in national volumes, while Kolkata contributes through tea, jute, and mineral flows into ASEAN markets. The India trade finance market extends into clusters such as Surat (textiles), Visakhapatnam (metals), and Coimbatore (machinery), aided by cloud-based onboarding that erases distance barriers.
Fintech penetration lifts funding in tier-2 locales by 26% year-on-year, with invoice-discounting ticket sizes averaging INR 12 lakh, 40% smaller than metro averages. State governments in Uttar Pradesh and Tamil Nadu now subsidize TReDS fees for first-time MSME users, elevating rural uptake. This geographic democratization dovetails with federal manufacturing policy that targets a 25% GDP contribution from the sector by 2030, creating parallel demand for open-account trade credit.
Competitive Landscape
The India trade finance market remains moderately concentrated, with major banks such as State Bank of India, HDFC Bank, ICICI Bank, Axis Bank, and Bank of Baroda holding a significant share of funded trade assets. Public-sector incumbents lean on branch density and sovereign relationships, while private peers offset smaller footprints with faster digital turnaround. HDFC Bank’s July 2024 migration to a cloud-engineered core trimmed processing latency by 35%[3]HDFC Bank, “HDFC Bank Completes Core Migration,” hdfcbank.com. ICICI Bank exposes 250+ trade APIs to corporates, shrinking average issuance time for a standby letter of credit from 10 minutes to fewer than 60 seconds.
Fintech entrants exploit a speed-of-execution play. Credlix fulfills drawdowns within two hours for 10,000+ active exporters, underwriting via AI models trained on six million invoices. TReDS platforms monetize auction spreads of 15–35 basis points and have onboarded 25,000+ MSMEs.
Global banks leverage GIFT City units to originate India-linked trade without full domestic balance-sheet exposure. HSBC’s new office expects to double cross-border supply-chain limits to USD 4 billion by 2026. Meanwhile, International Finance Corporation’s USD 500 million climate loan to Axis Bank embeds blue-bond covenants that fund sustainable trade lines. Such blended-finance deals push incumbents toward ESG scoring and traceability tools.
India Trade Finance Industry Leaders
-
State Bank of India
-
HDFC Bank
-
ICICI Bank
-
Axis Bank
-
Kotak Mahindra Bank
- *Disclaimer: Major Players sorted in no particular order
Need More Details on Market Players and Competitors?
Download PDF
Recent Industry Developments
- January 2025: HSBC expanded at GIFT City, opening a full-service desk for non-resident Indians and corporates.
- January 2025: Amazon acquired BNPL provider Axio for more than USD 150 million to deepen embedded finance on seller portals.
- January 2025: Finastra partnered with CredAble to integrate AI-led supply-chain finance modules into global banks’ back-bones.
- November 2024: State Bank of India set a USD 1.5 billion disbursement goal for its global trade-finance book by Mar 2025.
Research Methodology Framework and Report Scope
Market Definitions and Key Coverage
Our study defines India's trade finance market as the fee and interest revenue earned inside the country from instruments that facilitate or secure merchandise trade, including letters of credit, collections, guarantees, supply-chain finance, receivables discounting, and insured open-account loans. Values are expressed in constant 2024 U.S. dollars and capture income retained by banks, specialist financiers, and insurers after inter-bank settlement.
We exclude export-credit-agency lines, generic working-capital loans, and peer-funded invoice finance not tied directly to physical goods.
Segmentation Overview
- By Product
- Documentary
- Letter of Credit
- Other Documentary Collections
- Non-Documentary
- Receivables Finance (Factoring, Forfaiting, Invoice Discounting)
- Payables/Supply Chain Finance (Reverse Factoring, Dynamic Discounting)
- Direct Lending/Open Account-Based Finance (Trade Loans, Buyer's/Seller's Credit)
- Guarantees (Performance, Bid, Financial Guarantees)
- Insurance Products (Trade Credit Insurance, PRI, ECA Cover)
- Documentary
- By Service Provider
- Banks
- Trade Finance Companies
- Insurance Companies
- Other Service Providers
- By Application
- Domestic
- International
- By Company Size
- Large Enterprises
- Small and Medium-sized Enterprises (SMEs)
- By Financing Structure
- Structured Trade Finance
- Non-Structured Trade Finance
Detailed Research Methodology and Data Validation
Primary Research
Our analysts interviewed trade-finance heads at banks, treasury managers in exporting manufacturers, and founders of TReDS platforms across four regions. These conversations yielded live data on fee corridors, tenor shifts, and seasonal patterns, closing gaps left by secondary sources.
Desk Research
We pulled baseline volumes from the Reserve Bank of India's export-credit series, DGFT shipment statistics, GSTN e-invoice counts, and UN COMTRADE trade values, then overlaid payment-intensity clues from SWIFT-gpi traffic. Bank filings accessed via D&B Hoovers and news in Dow Jones Factiva revealed spreads and product mix, while ICC Banking Commission and FIEO papers clarified regulatory inflection points. Public RBI stability reports supplied non-performing-asset ratios used to adjust risk premiums. These sources are illustrative; many additional open and subscription repositories informed interim checks.
Market-Sizing & Forecasting
Our blended top-down and bottom-up model converts RBI credit balances into annual revenue through cycle-time factors and corroborates totals with sampled spread × volume roll-ups from major banks. Core variables tracked include LC issuance counts, TReDS throughput, average LC tenor, rupee-dollar basis margins, and SME export share. Multivariate regression, vetted by interviewees, projects each driver through 2030.
Data Validation & Update Cycle
Outputs face variance checks against RBI and UN aggregates; anomalies trigger senior review before sign-off. We refresh models every year and push mid-cycle updates whenever policy or credit shocks shift fundamentals.
Why Mordor's India Trade Finance Baseline Commands Reliability
We observe that published numbers vary because firms adopt different scopes, spread curves, and update cadences, and some convert gross disbursement rather than fee income.
Key Gap Drivers: several publishers cover only documentary instruments, extrapolate historic growth, or ignore PLI-driven export spurts and e-invoice adoption. Mordor's scope spans documentary and non-documentary segments, prices rest on fresh interviews, and assumptions are revisited annually.
Benchmark comparison
| Market Size | Anonymized source | Primary gap driver |
|---|---|---|
| USD 2.72 B (2025) | Mordor Intelligence | |
| USD 1.21 B (2024) | Global Consultancy A | Excludes supply-chain finance; measures transaction value not revenue |
| USD 1.77 B (2024) | Industry Association B | Applies flat 25 bps spread; omits SME nuance |
| USD 1.98 B (2024) | Regional Consultancy C | Draws from limited bank sample; updates biennially |
The comparison shows that our disciplined scope, live primary inputs, and frequent refresh give decision-makers a clear, reproducible baseline that mirrors India's fast-evolving trade-finance landscape.
Need A Different Region or Segment?
Customize Now
Key Questions Answered in the Report
What is the projected value of the India trade finance market by 2030?
It is forecasted to touch USD 3.88 billion by 2030, reflecting a 7.39% CAGR.
Which product leads the India trade finance market?
Non-documentary segment dominated with a 58.96% market share in 2024, propelled by e-invoicing and TReDS adoption.
How quickly is SME trade finance expanding?
SME-oriented volumes are on track for a 12.06% CAGR between 2025 and 2030 due to alternative-data underwriting and OCEN pipes.
Why does GIFT City matter for trade finance?
It offers regulatory and tax incentives that let foreign and domestic banks book multi-currency deals efficiently, boosting cross-border flows.
What are the main challenges restraining market growth?
Key headwinds are rising NPAs, stringent KYC/AML compliance layers, USD-liquidity swings, and low SME awareness of formal factoring.
How are fintech platforms affecting processing times?
API-first fintechs now complete invoice-discounting draws in seconds, compared with 10–15 minutes for traditional digital portals.
Page last updated on:


