
Market Overview
| Study Period | 2020 - 2031 |
|---|---|
| Forecast Data Period | 2026 - 2031 |
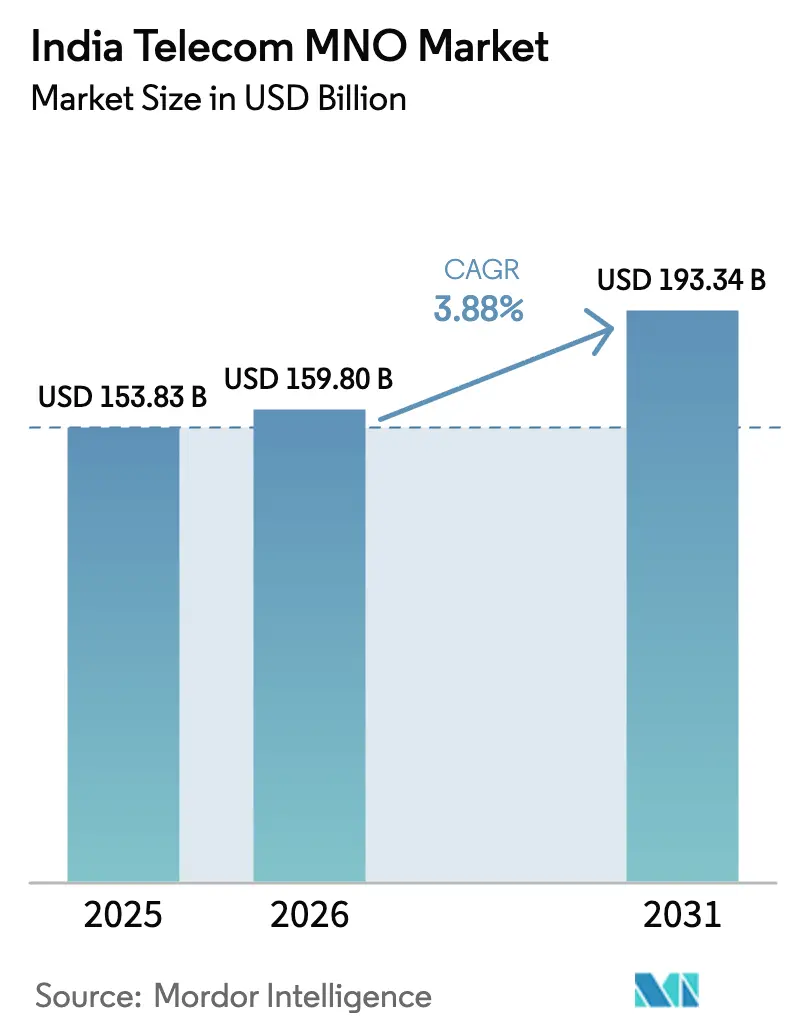
| Base Year Market Size (2025) | USD 153.83 Billion |
| Market Size (2026) | USD 159.8 Billion |
| Market Size (2031) | USD 193.34 Billion |
| Growth Rate (2026 - 2031) | 3.88 % |
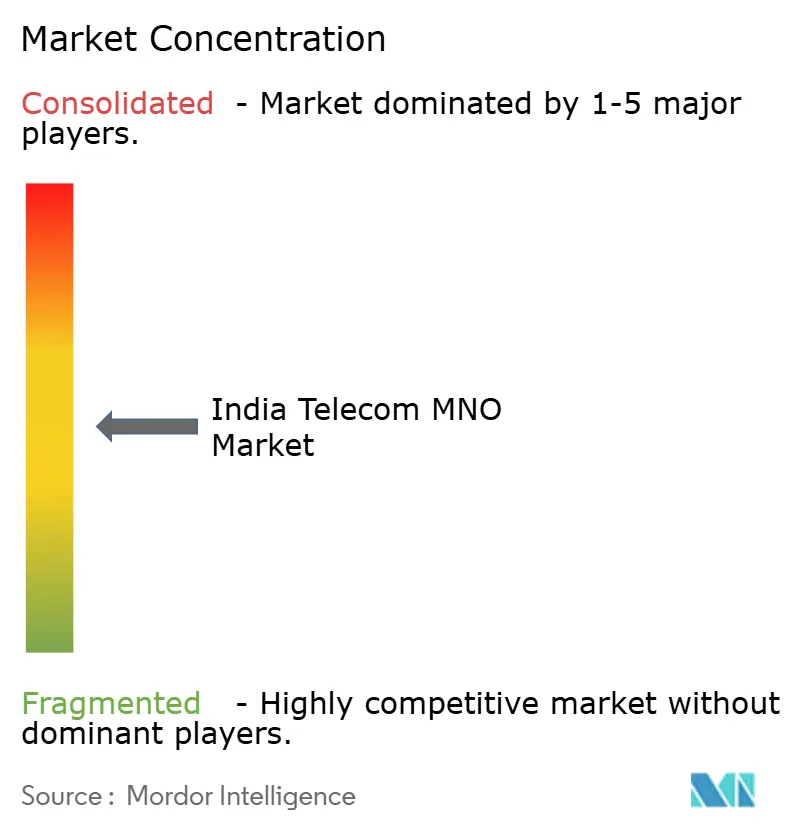
| Market Concentration | Medium |
Major Players *Disclaimer: Major Players sorted in no particular order Image © Mordor Intelligence. Reuse requires attribution under CC BY 4.0. | |
India Telecom MNO Market Analysis by Mordor Intelligence
The India Telecom MNO market size is expected to grow from USD 153.83 billion in 2025 to USD 159.8 billion in 2026 and is forecast to reach USD 193.34 billion by 2031 at 3.88% CAGR over 2026-2031.
This advance is paced by sustained mobile-data consumption, enterprise digital-transformation demand, and the ongoing shift from volume growth to value-focused service innovation. Data and Internet Services already account for 60.11% of revenue, propelled by per-subscriber usage that averages 30 GB each month across 490 million active connections. Voice Services still generate 16.98% of revenue as 2G/3G sunsets accelerate VoLTE adoption, while bundled OTT content and cloud add-ons lift average revenue per user across urban cohorts. Enterprise customers are emerging as the fastest-growing buyer group, with private 5G, edge connectivity, and managed cloud services underpinning a 4.29% CAGR in B2B revenue. Competitive intensity remains high because three operators command more than 90% share, yet differentiation has shifted toward network quality, ecosystem depth, and AI-driven service portfolios.
Key Report Takeaways
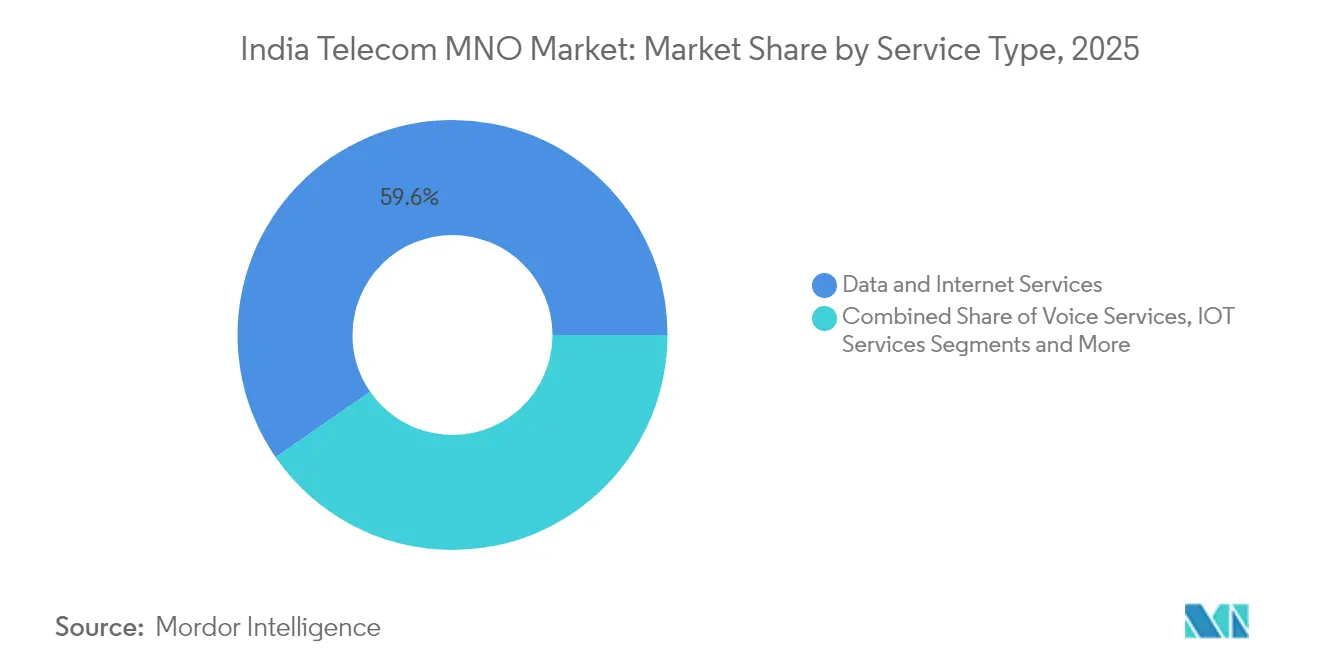
- By service type, Data and Internet Services led with 59.62% of India telecom MNO market share in 2025.
- By end user, the Enterprise segment is projected to expand at a 4.12% CAGR through 2031.
Note: Market size and forecast figures in this report are generated using Mordor Intelligence’s proprietary estimation framework, updated with the latest available data and insights as of 2026.
India Telecom MNO Market Trends and Insights
Drivers Impact Analysis*
| Driver | (~) % Impact on CAGR Forecast | Geographic Relevance | Impact Timeline |
|---|---|---|---|
| Surging mobile-data traffic fueled by low-cost 4G/5G plans | +1.2% | National; strongest in Tier-2 and Tier-3 cities | Medium term (2-4 years) |
| Digital India and BharatNet programs widening broadband reach | +0.8% | Rural and semi-urban districts | Long term (≥ 4 years) |
| Falling smartphone ASPs expanding addressable base | +0.6% | Nationwide, low-income cohorts | Short term (≤ 2 years) |
| Enterprise appetite for private 5G and edge connectivity | +0.9% | Metro clusters and industrial corridors | Medium term (2-4 years) |
| eSIM and multi-IMSI uptake in IoT devices | +0.3% | Smart-city and industrial IoT zones | Long term (≥ 4 years) |
| Bundled OTT content driving ARPU uplift | +0.4% | Urban and semi-urban circles | Short term (≤ 2 years) |
| Source: Mordor Intelligence | |||
Surging mobile-data traffic fueled by low-cost 4G/5G plans
Average monthly consumption has hit 30 GB per user, and Jio alone carries 8% of global mobile traffic, validating India’s data-centric trajectory. Scale economics now let operators monetize incremental gigabytes through cloud, gaming, and AI-enhanced services while sustaining network reinvestment. Fixed-wireless access (FWA) subscriptions are set to surpass 10 million by end-2025, creating an alternative broadband path in underserved zones. The combination of affordable pricing and dense 5G roll-outs positions the India telecom MNO market to pioneer data-intensive consumer and industrial applications.[1]ET Telecom, “Bharti Airtel's arm launches sovereign cloud for enterprises,” telecom.economictimes.indiatimes.com
Digital India and BharatNet programs widening broadband reach
Public-sector fiber backbones lower the marginal cost of rural roll-outs, letting private carriers extend 4G/5G to villages that were previously uneconomical. BSNL’s state-funded 4G build—targeting 100,000 sites by March 2025—illustrates how government stimulus de-risks private capital while anchoring demand from e-health, agri-tech, and e-learning initiatives. Compliance with India-resident data rules adds parallel demand for locally hosted cloud and connectivity, pulling the India telecom MNO market into new revenue pools.[2]ET Telecom, “Jio Platforms teams up with AMD, Cisco, Nokia,” telecom.economictimes.indiatimes.com
Enterprise appetite for private 5G and edge connectivity
Factory automation pilots show 40–60% efficiency gains, prompting full-scale deployments in automotive, logistics, and healthcare facilities. Operators now package spectrum, MEC, and managed security as turnkey offerings, lifting B2B ARPUs well above consumer levels. BSNL’s network-as-a-service model and Airtel’s sovereign-cloud launch exemplify the pivot toward margin-rich enterprise portfolios that elevate the overall India telecom MNO market.
Bundled OTT content driving ARPU uplift
Operator-content alliances have created sticky bundles that defend market share and justify tariff premiums. The OTT and PayTV category already contributes 6.91% of revenue, and integrated billing plus exclusive sports rights are lifting churn-adjusted ARPU in metro circles. Deeper user-behavior data further supports ad monetization strategies, reinforcing the flywheel effect within the India telecom MNO market.
Restraints Impact Analysis*
| Restraint | (~) % Impact on CAGR Forecast | Geographic Relevance | Impact Timeline |
|---|---|---|---|
| Elevated debt loads limiting operator capex | -0.7% | Nationwide; acute for Vi | Medium term (2-4 years) |
| High spectrum costs and sector-specific levies | -0.5% | National | Long term (≥ 4 years) |
| Municipal right-of-way delays for fiber | -0.3% | Urban civic bodies | Short term (≤ 2 years) |
| Rising data-localization compliance costs | -0.2% | Enterprise hubs | Medium term (2-4 years) |
| Source: Mordor Intelligence | |||
Elevated debt loads limiting operator capex
Vodafone Idea’s USD 27 billion debt and stalled fund-raise underscore a financing overhang that defers 5G roll-outs and erodes competitiveness. High leverage tightens cash flows, prioritizes short-term ARPU over long-range innovation, and lets better-capitalized peers win premium subscribers—constraining the broader India telecom MNO market.[3]ET Telecom, “Centre, Trai dismiss telecom companies’ revenue fears on satcom,” telecom.economictimes.indiatimes.com
High spectrum costs and sector-specific levies
Licensing fees and auction premiums absorb double-digit shares of operator revenue, curbing reinvestment capacity, particularly for rural 5G coverage where payback periods are longer. While treasury receipts rise, the drag on network modernization shaves potential CAGR points off the India telecom MNO market.
*Our forecasts treat driver/restraint impacts as directional, not additive. The impact forecasts reflect baseline growth, mix effects, and variable interactions.
Segment Analysis
By Service Type: Data Lead Solidifies Digital Dominance
Data and Internet Services delivered 59.62% of 2025 revenue, confirming their primacy in the India telecom MNO market. The segment is tracking a 3.82% CAGR as urban saturation balances rural onboarding. 5G FWA uptake underpins outsized momentum, while robust fiber backhaul accelerates gigabit-class offerings. Voice still holds 16.74% revenue; yet VoLTE lowers cost-per-minute, preserving cash flow. IoT and M2M Services, though only 5.06% of revenue, post a 3.93% CAGR and benefit from 32% YoY cellular-module shipment growth. OTT and PayTV contribute 6.85% with a 3.84% CAGR, boosted by exclusive sports content.
Operators leverage data analytics to curate prepaid bundles, microtarget rural cohorts, and upsell cloud storage. Competitive differentiation pivots on latency, consistent throughput, and platform openness for third-party apps. Regulatory clarity on satellite backhaul encourages hybrid connectivity, expanding addressable households. Altogether, these shifts keep the India telecom MNO market on a steady value-accretion path despite moderating subscriber additions.


By End User: Enterprise Growth Outpaces Consumer Saturation
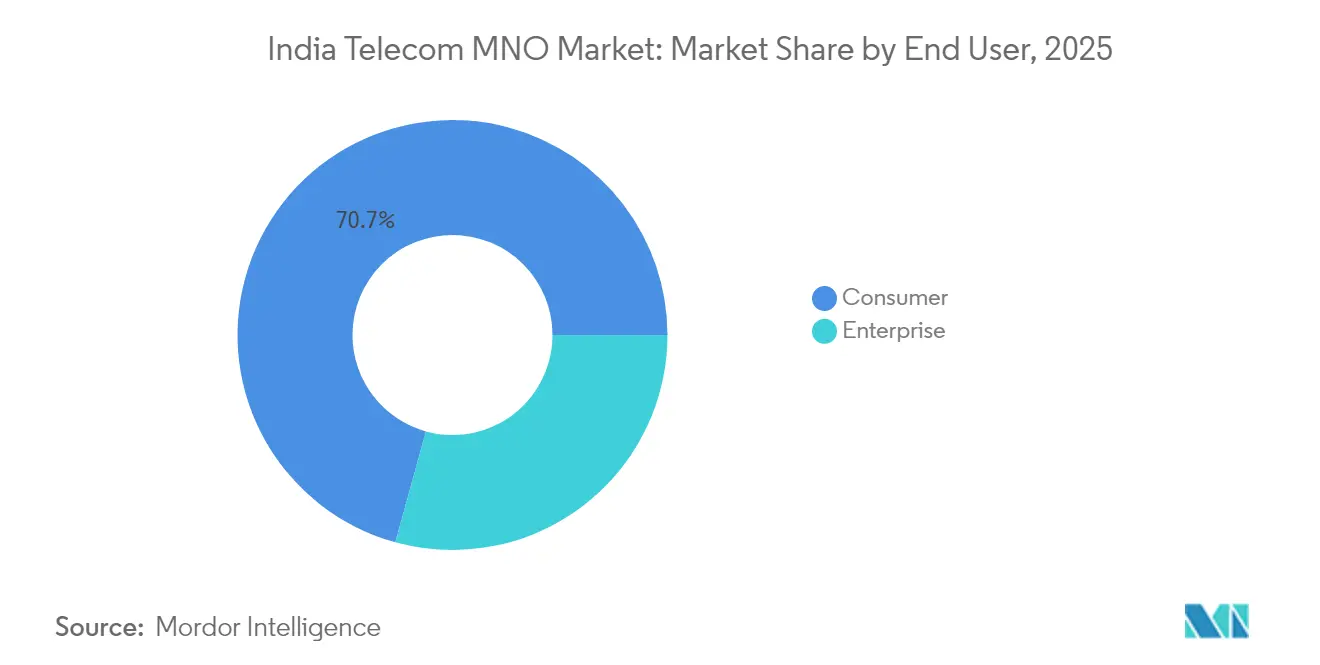
Enterprises generated 29.28% of 2025 revenue and are on a 4.12% CAGR trajectory, reflecting appetite for private 5G, MEC, and cybersecurity bundles. Telecom APIs for billing, identity, and messaging open incremental monetization lanes, and WhatsApp Business price cuts spur CPaaS adoption. BSNL pursues a 15% enterprise revenue jump next year via network-as-a-service.
The consumer base, still 70.72% of revenue, grows at 3.67% CAGR. Urban users demand seamless content plus cloud backups, while rural cohorts join via low-cost smartphones and BharatNet extensions. Convergence of work-from-anywhere lifestyles blurs segment lines, letting operators remix tariffs, loyalty schemes, and fintech add-ons. That evolution keeps the India telecom MNO market resilient even as net-additions slow.
Geography Analysis
Metro circles contribute the bulk of value, yet incremental growth tilts toward Tier-2 and Tier-3 cities where smartphone adoption curves remain steeper. Northern and Western regions, led by Delhi, Mumbai, and Gujarat, account for more than one-third of India telecom MNO market size. Southern circles post the highest data ARPU because of earlier 5G roll-out and affluent subscriber profiles.
Rural villages gain coverage through shared infrastructure and USOF subsidies. Fiber kilometers per capita rose notably after BharatNet Phase II, enabling small-cell densification that cuts backhaul costs. The east, historically underserved, is catching up as operators bundle FWA with content in Bengali and Odia languages. Jammu & Kashmir and Northeast show limited but strategic deployments that support defense and tourism.
Regulatory incentives such as reduced license fees for remote areas encourage build-outs, while satellite backhaul experiments promise leapfrog gains for islands and high-altitude zones. These moves collectively expand geographic inclusivity, ensuring the India telecom MNO market remains a nationwide growth story rather than an urban-centric opportunity.
Regulatory Landscape
India telecom regulation is anchored by the Department of Telecommunications (DoT) as licensor and spectrum authority, with the Telecom Regulatory Authority of India (TRAI) primarily issuing recommendations and conducting consultations. The Telecommunications Act, 2023 replaced the Indian Telegraph Act, 1885, and was followed by subordinate rules that reshape operator compliance and licensing mechanics.
In June 2026, the Centre notified the Telecommunications (Authorisation for Provision of Principal Telecommunication Services) Rules, 2026. The rules introduce an authorisation framework that allows operators such as Bharti Airtel, Reliance Jio, and Vodafone Idea to transition from legacy licenses via the DoT Telecom eServices Portal. Alongside licensing modernization, enforcement emphasis has tightened on cyber-security, including requirements around unsolicited commercial communications (UCC) controls and lawful interception and monitoring arrangements. As a result, compliance workloads for MNOs have increased, and this is shaping how enterprises procure managed connectivity and cloud-adjacent services.
Competitive Landscape
Reliance Jio, Bharti Airtel, and Vodafone Idea hold more than 90% combined share, giving the India telecom MNO market a high-concentration profile. Jio leverages scale economics to price aggressively and cross-sell digital apps, while Airtel pursues premium positioning via network quality and B2B cloud depth. Vodafone Idea struggles with capital constraints yet preserves pockets of loyalty through differentiated content bundles.
BSNL’s state-funded 4G and planned 5G roll-out inject a public-sector dynamic; 50,000 indigenous 4G sites were active by late 2024 and a further 50,000 are on track for mid-2025 completion. Strategic partnerships—Jio with AMD/Cisco/Nokia on a Telecom-AI stack, Airtel with Singtel and Google Cloud on sovereign services—underscore technology as a battlefield. Satellite tie-ups with SpaceX position carriers to diversify backhaul and address untapped households.
M&A speculation lingers around fiber holdings and tower portfolios as operators monetize assets to fund 5G densification. Device financing, fintech, and ad-tech spin-offs deepen ecosystem moats. Together, these vectors elevate competition from pure connectivity into integrated digital-platform rivalry, shaping long-term trajectories for the India telecom MNO market.
India Telecom MNO Industry Leaders
Reliance Jio Infocomm
Bharti Airtel
Vodafone Idea Limited
Bharat Sanchar Nigam Limited (BSNL)
Mahanagar Telephone Nigam Ltd. (MTNL)
- *Disclaimer: Major Players sorted in no particular order

Market Opportunities and Future Outlook
Monetization headroom is centered on scaling 5G-led home broadband through fixed wireless access (FWA) and bundling value-added services alongside rising data usage (30 GB per subscriber per month across 490 million active connections). TRAI subscriber data for May 2026 shows 5G FWA subscriptions at 12.73 million, led by Reliance Jio (8.97 million) and Bharti Airtel (3.76 million). The mix points to an active conversion path from mobile-only households to multi-service accounts, where MNOs can package content, cloud storage, security, and payments.
A second opportunity track is enterprise-grade connectivity supported by sovereign and compliant digital infrastructure, with operators moving beyond access into managed cloud and edge portfolios. Capital-market and funding developments also create near-term catalysts and visible whitespace: Reliance Jio Platforms filed a DRHP in June 2026 for a planned listing, while Vodafone Idea has been seeking fresh funding (INR 35,000 crore referenced) for 5G rollout, with lenders awaiting promoter guarantees. On the supply side, government programs aimed at telecom equipment localization, including focus areas such as advanced packaging, GaN semiconductors, and silicon photonics for 5G infrastructure, provide room for operators and OEM partners to shorten lead times and diversify sourcing for radios, transport, and edge hardware used in urban densification and BharatNet-linked expansion.
Recent Industry Developments
- July 2026: Reliance Jio IN-SPACe nod to deploy approximately 1,600 LEO satellites. The development frames space-based connectivity as a backhaul option, extending India\'s network reach beyond terrestrial limits. It also supports space-based broadband and core network infrastructure expansion in India.
- June 2026: Reliance Jio AGM commitments to migrate all subscribers to 5G by 2030 and expand JioAirFiber. The plan targets faster 5G adoption and broader broadband penetration across the country. It reinforces the company\'s 5G-led growth trajectory and associated ecosystem verticals.
- May 2026: TRAI subscriber data: May 2026 wireless subscribers added across operators. The data point indicates sustained market momentum in wireless connectivity. It also provides a near-term read on the pace of subscriber growth alongside 5G FWA expansion.


Research Methodology Framework and Report Scope
Market Definition and Coverage
For this methodology, the India telecom market is measured as the total value of services delivered by mobile network operators in India. This is captured through customer and enterprise spending on connectivity and related operator-led services.
Scope exclusions: We exclude handset and device sales, pure telecom equipment manufacturing and exports, and IT services that are not billed as operator telecom services.
Segmentation Overview
- Overall Telecom Revenue and ARPU
- Service Type
- Voice Services
- Data and Internet Services
- Messaging Services
- IoT and M2M Services
- OTT and PayTV Services
- Other Services (VAS, Roaming and International Services, Enterprise and Wholesale Services, etc.)
- End-user
- Enterprises
- Consumer
Data Sources, Market Sizing, and Validation
Desk Research
Desk research was used to set up the market structure and anchor it to India-specific operating and financial indicators. We referred to public releases and statistics such as TRAI performance indicator reports, Department of Telecommunications updates, Ministry of Statistics and Programme Implementation data, and Reserve Bank of India macro series, to align the model with subscriber trends, usage patterns, and nominal growth.
To support the revenue logic and assumptions, we also reviewed listed operator filings and investor presentations, association publications covering operators and digital infrastructure, reputed press, and peer-reviewed articles on spectrum and network economics. Where needed, paid subscriptions were used for company financials and intelligence, and for checking patent activity connected to telecom features and network evolution. These desk research sources are illustrative and not exhaustive, and many other references were also used for data collection, validation, and clarification.
Primary Interviews and Surveys
Primary work focused on validating how services are monetized in India, and stress-testing assumptions that do not show up cleanly in public tables, such as blended ARPU movement, mix shifts between prepaid and postpaid, and enterprise contract structures. We spoke with operator-side leaders, network and product owners, channel and distribution specialists, and enterprise buyers, and used the feedback to refine demand drivers and confirm realistic pricing and adoption paths across major circles.
Distribution of primary research fieldwork respondents
| Company type | Respondent position |
|---|---|
| Top tier: 26% | CXOs: 16% |
| Mid tier: 54% | Functional/Unit leaders: 27% |
| Smaller Players: 20% | Managers: 57% |
Market-Sizing & Forecasting
The market was reconstructed using a top-down approach, where operator service revenue pools were aligned to India telecom indicators such as wireless subscriber base, internet subscriber base, usage per subscriber, and ARPU direction following tariff changes. Since published series can differ by definition, the data was normalized to a consistent base year, and then mapped to the service set covered in this study.
To keep totals realistic, we corroborated outputs with selective bottom-up approximations, such as sampled price packs multiplied by estimated active subscriber mix, and channel checks on common recharge values and plan migration. Where some service lines had limited direct disclosure, we applied conservative allocation logic using supporting signals like enterprise mobility share, IoT connection growth, and OTT and pay TV bundling incidence, and then rechecked the splits through expert feedback.
For forecasting, we used scenario analysis supported by short time-series smoothing on key inputs, since the market can shift quickly with tariff hikes, spectrum and coverage rollouts, and pricing changes. A base case path was selected after reconciling primary feedback with observed trends in subscriber additions, data traffic growth, 4G to 5G migration pace, and enterprise connectivity demand.
Data Validation & Update Cycle
Each modeled year is checked against independent signals such as regulator-reported gross revenue direction, subscriber and internet base changes, and observed ARPU movement. Outliers are flagged, then assumptions are revisited, and we re-contact sources if a step change appears to come from pricing, reclassifications, or reporting effects.
Before sign-off, the model goes through multi-step analyst review so the arithmetic, splits, and conversion logic match the defined scope. Reports are refreshed annually, and interim updates are made when material events occur, for example major tariff revisions or policy moves that change service monetization. Before delivery, a final fresh pass is completed so clients receive the latest updated view.
Mordor Intelligence's India Telecom Market Estimate Compared With Other Published Estimates
Published estimates for India telecom can vary because the scope is not uniform, and because revenue is sometimes grouped with adjacent categories that sit next to telecom services. Differences also come from the base year used, the currency conversion timing applied, and how quickly assumptions are refreshed after tariff moves.
Some external figures include a wider telecom value chain, such as devices, tower rentals, or parts of broadcasting and cable. For Mordor Intelligence, only mobile network operator service revenues are counted across voice, data, messaging, IoT and M2M, and operator-linked OTT and pay TV services, which keeps the total tied to what operators bill and recognize in India.
Benchmark comparison
| Source | Market Size | Gaps in Research Methodology |
|---|---|---|
| Mordor Intelligence | USD 153.83 B (2025) | |
| Industry Association A | USD 40.24 B (2025) | Often reflects reported sector gross revenue for a fiscal year and may exclude non-core service lines, exclude parts of enterprise and platform revenues, and follow India fiscal-year accounting rather than a calendar-year market model. |
| Global Consultancy B | USD 42.65 B (2026) | Typically applies a narrower service definition and a different base year, and projections can lean heavily on assumed 5G monetization and tariff steps, with limited visibility on how ARPU, churn, and service-mix splits were validated. |
The table suggests most of the spread is explained by what gets counted as telecom revenue and by year alignment, not by a simple forecasting difference. Our model stays repeatable because the key totals can be traced back to subscriber counts, usage indicators, and ARPU direction, then checked again with field feedback before finalizing the splits.


Key Questions Answered in the Report
Why is VoLTE important to operators?
VoLTE frees legacy spectrum, lowers cost per minute, and supports high-definition voice without separate circuit-switched networks.
What challenges limit faster 5G expansion?
High spectrum fees and operator debt loads restrict capital spending, particularly for Vodafone Idea.
How many 5G base stations are active nationwide?
Operators have deployed about 460,000 5G sites, covering 779 districts.
What is driving enterprise demand?
Private 5G networks, edge computing, and managed cloud services are fueling a 4.12% CAGR in enterprise revenue.
Page last updated on:


 Your data is secure and never sold or shared.


