
Market Overview
| Study Period | 2021 - 2031 |
|---|---|
| Forecast Data Period | 2026 - 2031 |
| Base Year Market Size (2025) | USD 5.38 Billion |
| Market Size (2026) | USD 5.78 Billion |
| Market Size (2031) | USD 8.24 Billion |
| Growth Rate (2026 - 2031) | 7.35 % |
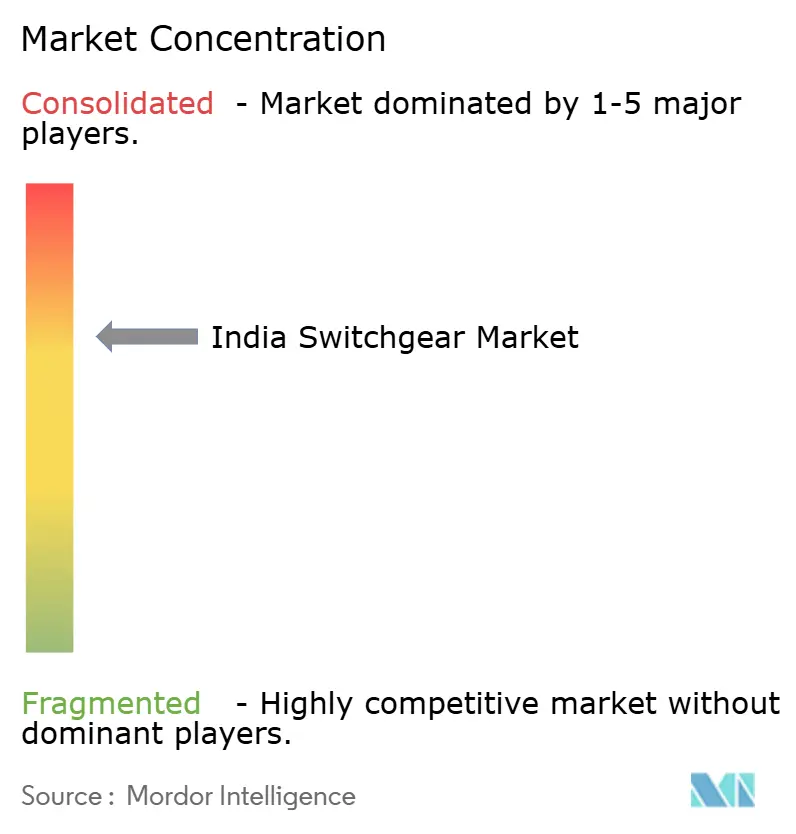
| Market Concentration | Medium |
Major Players *Disclaimer: Major Players sorted in no particular order Image © Mordor Intelligence. Reuse requires attribution under CC BY 4.0. | |
India Switchgear Market Analysis by Mordor Intelligence
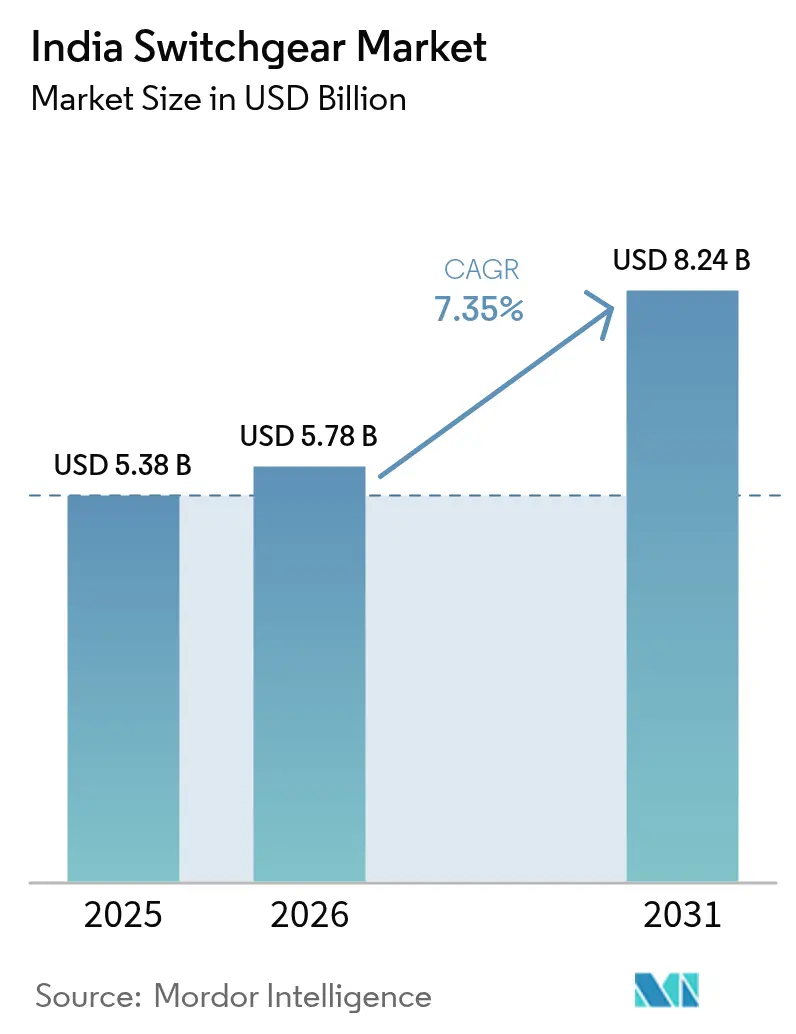
The India Switchgear market size is expected to grow from USD 5.38 billion in 2025 to USD 5.78 billion in 2026 and is forecast to reach USD 8.24 billion by 2031 at 7.35% CAGR over 2026-2031.
A confluence of large-scale government spending on transmission and distribution (T&D), rapid integration of renewables, and urban electrification underpins this trajectory. Grid-upgrade commitments, such as the Revamped Distribution Sector Scheme (RDSS) and the Central Electricity Authority’s (CEA) forecast of INR 9.1 trillion (USD 109 billion) in transmission capital expenditure by FY32, reinforce the long-term demand base. Heightened attention to sustainability is accelerating the shift toward SF₆-free technologies, while expanding data-center capacity and electric-vehicle (EV) fast-charging corridors widen the addressable landscape for medium- and high-voltage gear. Competitive strategies focus on localized manufacturing, innovative clean-air gas-insulated switchgear (GIS), and digitally enabled product lines tailored for smart grids. Forward-looking opportunities, therefore, hinge on capturing renewable evacuation projects, serving metro-rail extensions, and supplying edge-computing facilities—all of which collectively nourish the India switchgear market.
Key Report Takeaways
- By voltage, Low Voltage captured 47.05% of India's switchgear market share in 2025, whereas High Voltage is forecast to expand at a 9.28% CAGR through 2031.
- By insulation, Air Insulated Switchgear held a 72.10% share of the India switchgear market size in 2025, while the "Others" category—dominated by SF₆-free alternatives—exhibits the fastest growth rate of 15.10% from 2025 to 2031.
- By current type, AC equipment accounted for an 85.80% share in 2025; however, DC switchgear is advancing at an 8.42% CAGR in response to data center construction and EV charging rollouts.
- By installation, Indoor units commanded 82.60% of 2025 revenues, whereas Outdoor deployments are set to grow at a 10.08% CAGR, buoyed by utility-scale renewable projects.
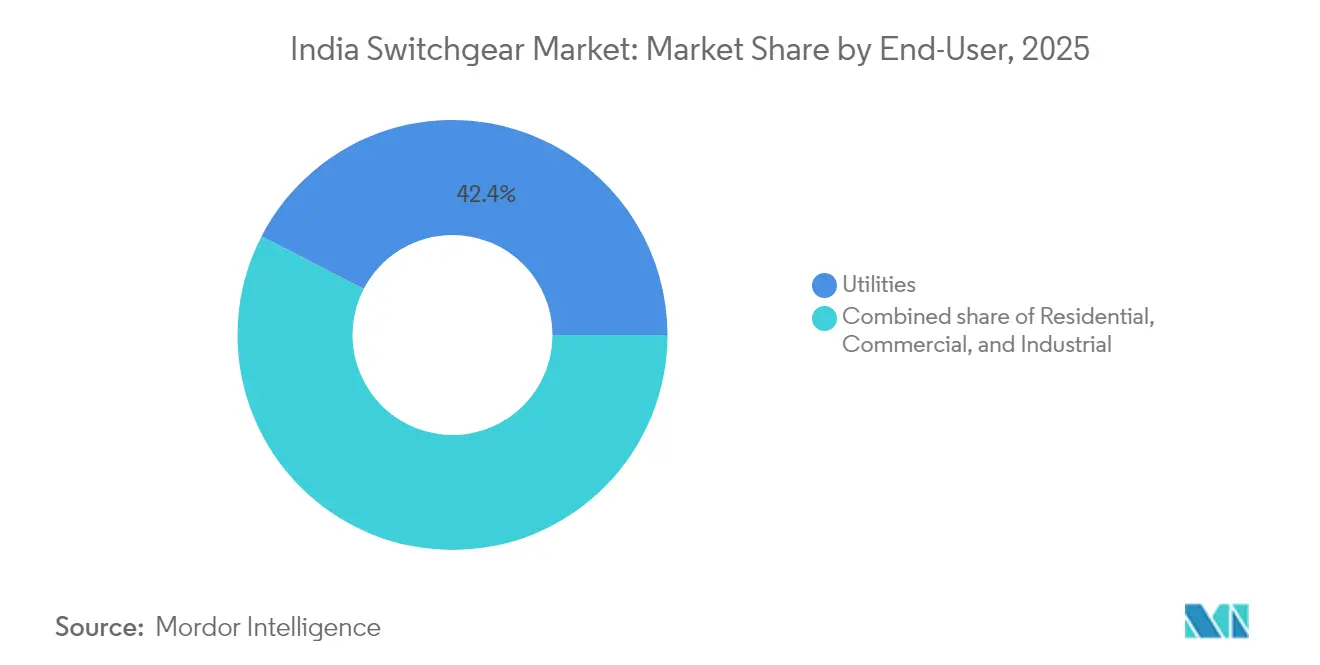
- By end user, Utilities led with 42.40% market share in 2025, while also maintaining the highest 8.05% CAGR projection through 2031.
Note: Market size and forecast figures in this report are generated using Mordor Intelligence’s proprietary estimation framework, updated with the latest available data and insights as of 2026.
India Switchgear Market Trends and Insights
Drivers Impact Analysis*
| Driver | (~) % Impact on CAGR Forecast | Geographic Relevance | Impact Timeline |
|---|---|---|---|
| Govt investment in T&D (RDSS, Saubhagya) | +2.1% | National, with concentration in Uttar Pradesh, Bihar, Rajasthan | Medium term (2-4 years) |
| Renewable-grid integration surge | +1.8% | National, with early gains in Gujarat, Rajasthan, Karnataka | Long term (≥ 4 years) |
| Urbanisation & Smart-City electrification | +1.4% | National, focused on 100 Smart Cities and metro areas | Medium term (2-4 years) |
| Data-centre build-out demand | +0.9% | National, concentrated in Mumbai, Chennai, Hyderabad, Pune | Short term (≤ 2 years) |
| Smart/digital switchgear adoption | +0.7% | National, with early adoption in industrial corridors | Medium term (2-4 years) |
| Metro-rail & EV-charging corridors | +0.6% | National, focused on 25 metro cities and highway corridors | Long term (≥ 4 years) |
| Source: Mordor Intelligence | |||
Government T&D Investment Acceleration
The RDSS sanction of INR 2.78 lakh crore aims to reduce aggregate technical and commercial losses to 15% by 2026 and mandates the installation of 250 million smart meters, all of which intensify the volume pull for medium-voltage ring-main units and protection devices.[1]Ministry of Power, “Budget 2025 Speech—Power & RE Outlay,” ministryofpower.nic.in Budget 2025’s INR 16,021 crore infusion further accelerates feeder segregation and substation digitization, steering procurement toward intelligent switchgear with real-time monitoring. Combined, these schemes deepen the utility sector’s appetite for grid-interactive equipment, shifting purchase criteria from purely upfront price to lifetime efficiency. Vendors that embed sensors and predictive analytics in switchgear position themselves to win multiyear framework contracts. As state utilities modernize, the India switchgear market benefits from both replacement cycles in urban centers and greenfield buildouts in electrification-lagging districts.
Renewable-Grid Integration Surge
India added 15.27 GW of renewable capacity in FY24, pushing the cumulative base to 190 GW and intensifying the need for high-voltage evacuation corridors. Large parks such as Khavda’s 30 GW project demand 400 kV and 765 kV bays equipped with fast-acting digital relays to handle bidirectional flows. On the distribution side, the PM-KUSUM program’s feeder-level solar arrays complicate voltage profiles, spurring demand for modular reclosers and sectionalizers with advanced fault-location features. Storage tenders totaling 4 GWh require DC switchgear with arc-quenching speed tailored for lithium-ion battery racks. The continual rise of renewable energy certificates traded on power exchanges underscores market mechanisms that reward grid flexibility, further advancing the adoption of premium switchgear designed for intermittent assets.
Urbanization & Smart-City Electrification
Smart Cities Mission has executed 7,504 projects totaling INR 1.5 trillion, including extensive underground cabling that necessitates compact indoor assemblies with IP54-plus ingress ratings.[2]Smart Cities Mission, “Mission Dashboard April 2025,” smartcities.gov.in Integrated command-and-control centers rely on switchgear-native communication protocols such as IEC 61850 for city-wide load balancing and outage analytics. In densely populated metros, land scarcity favors GIS despite its 2–3 times cost premium, provided vendors can articulate life-cycle savings. Energy-efficiency targets incorporated into municipal contracts incentivize utilities to specify low-loss copper busbars and embedded power-quality meters. These factors collectively broaden the feature set buyers require and raise the technical bar for contenders in the India switchgear market.
Data-Center Build-Out Demand
National data-center capacity is slated to reach 2,070 MW by the end of 2025, with energy consumption increasing from 13 TWh in 2024 to 57 TWh by 2030. Hyperscale operators stipulate N+1 or 2N redundancy, accelerating uptake of draw-out circuit breakers, bus-duct-mounted switchgear, and intelligent motor-control centers that cut mean-time-to-repair. Edge nodes proliferating across Tier-2 cities multiply low-voltage board requirements, yet still insist on continuous-operation standards that echo those of hyperscale facilities. Meanwhile, onsite battery energy-storage systems heighten the relevance of DC breakers capable of interrupting high-fault currents in under 10 ms. Suppliers that integrate environmental monitoring and predictive maintenance capabilities directly in their panels carve out defensible niches within this performance-critical vertical.
Restraints Impact Analysis*
| Restraint | % Impact on CAGR Forecast | Geographic Relevance | Impact Timeline |
|---|---|---|---|
| High cap-ex of GIS & retrofits | -1.2% | National, particularly affecting utility and industrial segments | Medium term (2-4 years) |
| SF₆ environmental‐compliance risk | -0.8% | National, with early impact on HV switchgear segments | Long term (≥ 4 years) |
| Permit & land-acquisition delays | -0.6% | National, with higher impact in densely populated states like Maharashtra, Gujarat, Delhi NCR | Short term (≤ 2 years) |
| Fragmented after-sales service | -0.4% | National, with pronounced impact in tier-2 and tier-3 cities | Medium term (2-4 years) |
| Source: Mordor Intelligence | |||
High Capital Expenditure of GIS Systems
Gas-insulated bays can cost up to three times more than their air-insulated counterparts, deterring adoption in tariff-sensitive distribution utilities despite their compact footprint and lower maintenance requirements. CEA guidance urging total-cost-of-ownership analyses has not fully allayed first-cost anxieties, particularly in financially stretched state electricity boards that collectively logged INR 90,000 crore losses in FY24.[3]Central Electricity Authority, “Consultation Paper on SF₆ Alternatives,” cea.gov.in Retrofit projects further hike costs because legacy civil layouts seldom align with modern GIS modules, necessitating bespoke enclosures and extended outages for integration. These economic headwinds prompt many tenders to specify AIS unless land constraints or the severity of coastal pollution mandate the use of GIS. Vendors are responding by localizing key subassemblies to trim import content and compress price differentials, but overall cost parity remains distant.
SF₆ Environmental-Compliance Risks
SF₆, possessing 23,500 times the global-warming potential of CO₂, has drawn scrutiny from policymakers. The CEA has launched stakeholder consultations to explore phased restrictions that mirror the European Union's timelines, starting in 2026. Manufacturers thus face dual pressure: upfront R&D investment in vacuum or dry-air alternatives, and potential inventory obsolescence should regulations tighten abruptly. Early-stage alternatives, such as Siemens' Blue GIS and ABB's PrimeGear ZX0, command premiums of 2–3 times, complicating procurement for utilities bound by least-cost norms. Buyers are hesitating on high-voltage orders, delaying capex until regulatory clarity emerges, a dynamic that could temper India's switchgear market growth if not resolved through financial incentives or accelerated cost declines.
*Our forecasts treat driver/restraint impacts as directional, not additive. The impact forecasts reflect baseline growth, mix effects, and variable interactions.
Segment Analysis
By Voltage: High Voltage Drives Future Growth
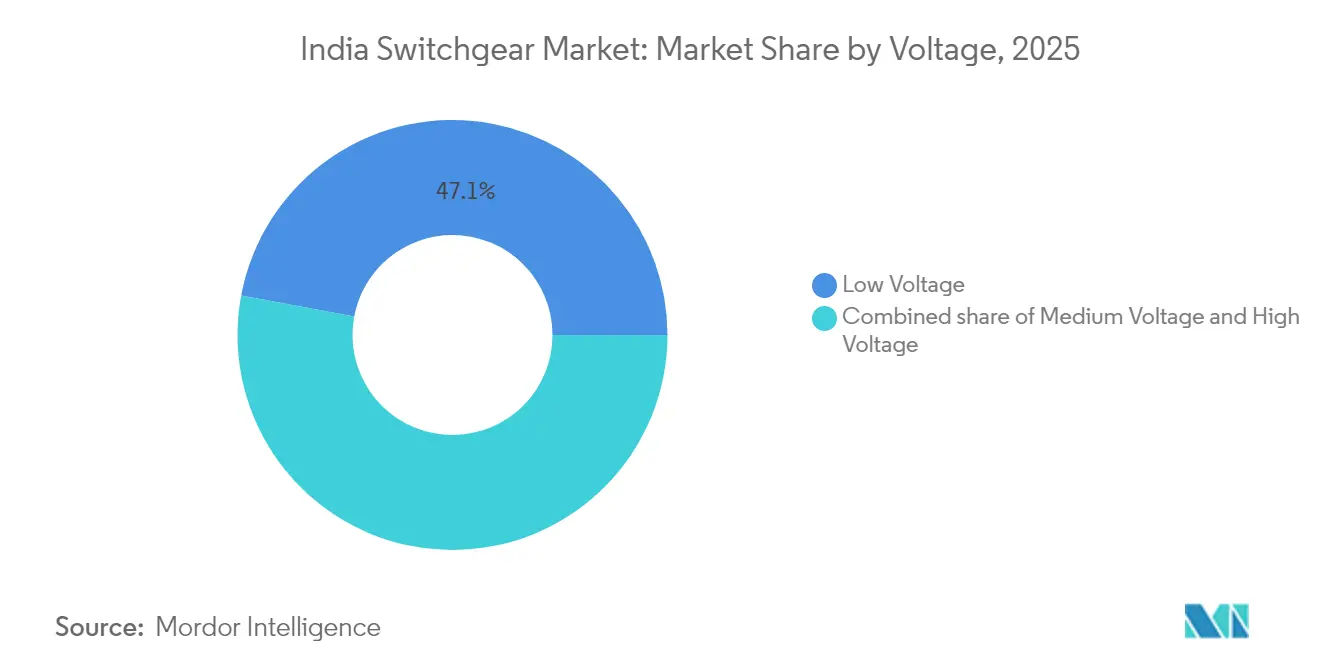
High-voltage equipment generated outsized momentum, logging a 9.28% CAGR forecast to 2031, despite low-voltage lines retaining 47.05% of India's switchgear market share in 2025. The INR 9.1 trillion transmission grid buildout will require 400 kV and 765 kV switchyards to link renewable clusters to load centers. Correspondingly, medium-voltage units benefit from RDSS-funded feeder upgrades, which incorporate digital relays and motorized isolators that enhance outage response. Low-voltage gear continues to supply residential and commercial loads at volume, yet commoditization erodes margins, prompting suppliers to differentiate via modular form factors and enhanced arc-flash protection.
Momentum in the high-voltage tier also reflects India's ambition to integrate 500 GW of renewables by 2030, necessitating robust inter-state corridors capable of bidirectional flow. ABB's supply of protection panels to the Kanpur Metro underscores the relevance of medium-voltage systems in transit electrification. Low-voltage adoption is increasingly tied to the rollout of smart meters, where compact breakers with integrated communication modules align with the housing sector's digitization. Taken together, voltage-layer segmentation confirms a demand pyramid: bulk revenues at low voltage, profit pools and growth at the medium and high-voltage layers, and rising specialization premiums for ultra-high-voltage OEMs.


By Insulation: Environmental Compliance Reshapes Technology Mix
Air-insulated constructions held a 72.10% share in 2025, yet the “Others” bucket—dominated by dry-air, vacuum, and solid-insulation hybrids—registered a 15.10% CAGR, signaling buyer appetite for greener alternatives. Siemens’ INR 333 crore Clean Air GIS line in Goa typifies investment momentum toward non-SF₆ options. While GIS still faces cost hurdles, space-rating economics in urban substations and offshore wind platforms favor its deployment. Regulatory uncertainty surrounding SF₆ phase-outs accelerates the installation of vacuum-interrupter modules, particularly in 145 kV classes, where technology readiness is higher.
AIS solutions remain price leaders for rural feeders, where land is plentiful and maintenance crews are on-site, reinforcing their volume dominance in the India switchgear market size. The growing acceptance of hybrid switchgear, which marries AIS busbars with GIS interrupters, illustrates engineering creativity geared toward balancing CAPEX and footprint constraints. As domestic manufacturing scales and R&D matures, cost gaps between legacy GIS and clean-air or vacuum variants are expected to narrow, hastening a structural technology shift that could redraw competitive positioning.
By Current Type: DC Infrastructure Gains Strategic Importance
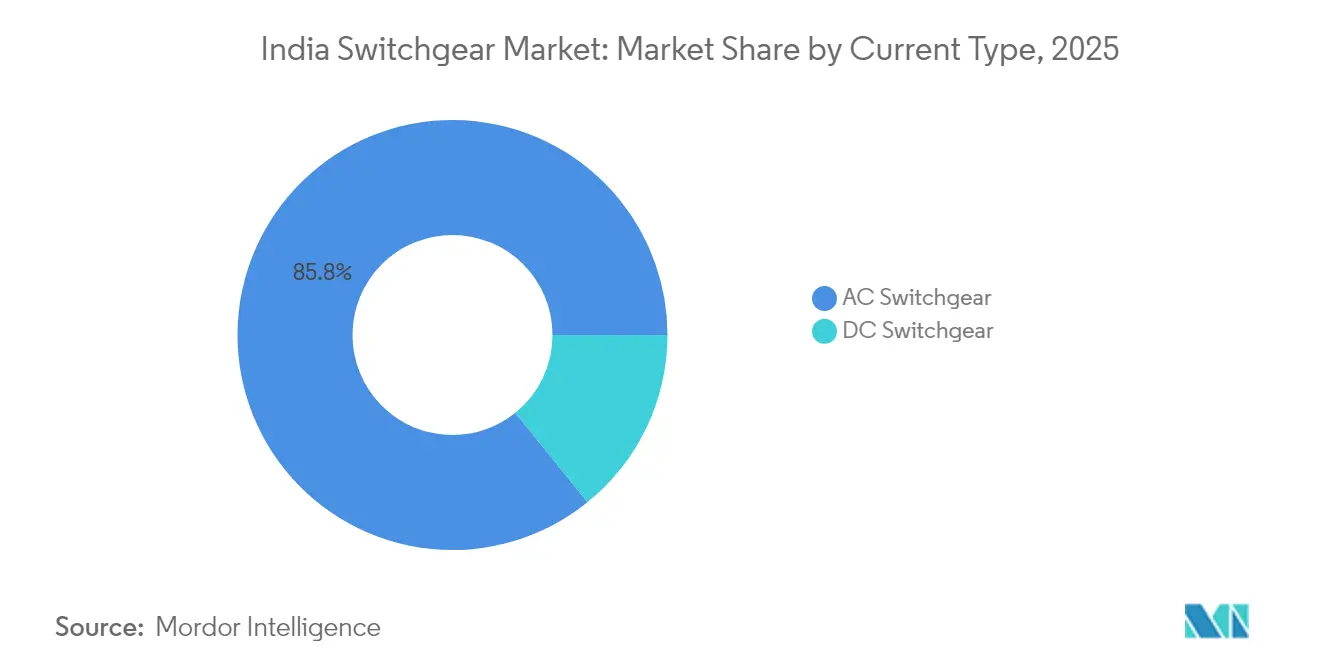
AC architectures accounted for 85.80% of 2025 revenues; nevertheless, DC gear’s 8.42% CAGR highlights niche yet accelerating segments, such as data centers, EV fast chargers, and battery energy storage. Mumbai and Chennai colocation clusters require DC busways integrated with lithium-ion racks to minimize conversion losses and enhance uptime. National highway charging corridors further stretch demand for 1,500 V DC breakers capable of withstanding frequent load cycles. Meanwhile, Solar EPCs specify DC disconnects for combiner boxes, expanding medium-voltage DC adoption.
Though still minor in absolute value, high-voltage direct-current (HVDC) links that ferry bulk renewable power over 800 km distances exemplify specialized growth, requiring line-commutated converter valves and accompanying DC switchgear. A steady pipeline of storage tenders complements this trend, as batteries inherently operate on direct current, necessitating protective devices tuned to rapid current-rise profiles. Together, these developments expand the India switchgear market’s technological diversity and invite entrants with deep DC competencies.
By Installation: Outdoor Growth Reflects Utility Expansion
Indoor boards claimed an 82.60% share in 2025, thanks to widespread use in commercial towers, factories, and subterranean substations of metro cities. However, outdoor installations are advancing at a 10.08% CAGR, mirroring the geographic spread of utility-scale solar and wind farms where weatherproof kiosks and skid-mounted assemblies prevail. The CEA’s plan to create green-energy corridors pushes utilities to erect remote 765 kV yards that naturally fall under outdoor classifications.
Urban smart-grid projects still favor indoor configurations for aesthetic and safety reasons, but rising real estate prices shift the cost-benefit calculus toward compact GIS rooms. For rural feeders, suppliers emphasize UV-resistant enclosures and deeper creepage distances to manage dust and humidity. Net result: installation choices are increasingly dictated by land prices, climatic stress, and maintenance logistics, reinforcing the need for modular, site-flexible designs across the India switchgear market.
By End User: Utilities Drive Both Volume and Growth
Utilities controlled 42.40% of 2025 spending and still headline with an 8.05% CAGR to 2031 as states race to comply with reliability indices and renewable purchase obligations. Large integrated projects award multi-year packages that bundle high-, medium-, and low-voltage panels, offering economies of scale to OEMs with complete portfolios. Industrial offtake follows manufacturing-sector capital expenditure cycles; automotive and pharmaceutical companies adopt premium switchgear for uninterrupted operations, although growth rates lag behind utility budgets.
Residential growth is underpinned by rapid urban housing development and the shift toward network upgrades following the completion of Saubhagya. Commercial uptake, boosted by data-center and retail-mall construction, commands intelligent switchgear with remote diagnostics. Collectively, these user cohorts reinforce a foundational theme: utilities deliver volumes and long-term contracts, whereas industrial and commercial niches offer margin uplift through customization—each reinforcing the multi-speed character of the India switchgear market.
Geography Analysis
Western and southern states together generate an estimated 59.70% of India's switchgear market revenues, reflecting the combined advantages of industrial corridors, port infrastructure, and renewable parks. Gujarat and Maharashtra alone contribute about 34.55%, supported by large solar arrays at Khavda and rapidly expanding manufacturing near Pune and Aurangabad. Southern states such as Tamil Nadu and Karnataka leverage IT hubs and automotive clusters to specify intelligent, medium-voltage gear with communication capabilities, further solidifying their position as adopters of premium technology.
Northern markets, covering Uttar Pradesh, Haryana, and Punjab, display the highest absolute growth in distribution-level purchases, driven by extensive agricultural electrification and rural feeder upgrades funded under RDSS. Yet budget constraints press utilities to pursue least-cost procurement, keeping low-voltage air-insulated panels dominant. Delhi-NCR differs from surrounding northern states by procuring high-reliability switchgear for metro-rail extensions and hyperscale data centers, thus skewing its mix toward GIS and advanced protection relays.
Eastern and northeastern states emerge as frontier zones. Odisha and West Bengal lead the industrial take-off with metals and refining projects, which demand medium-voltage GIS. Jharkhand and Chhattisgarh present mining-centric opportunities for rugged outdoor units engineered for dust and vibration. In all, geographic segmentation underscores diverging purchase criteria, ranging from high-specification metro hubs to price-sensitive rural feeders, compelling vendors to maintain a broad catalog tailored to regional variances within the India switchgear market.
Regulatory Landscape
India's switchgear market operates under tightening quality and test-compliance requirements led by the Ministry of Heavy Industries (MHI), the Bureau of Indian Standards (BIS), and the Central Electricity Authority (CEA). The Electrical Equipment (Quality Control) Order, 2020 (EEQCO) under MHI mandates BIS certification for specified electrical equipment. BIS Scheme X covers compulsory certification for low-voltage switchgear aligned to the IS/IEC 60947 series. BIS circular updates requiring revisions to IS/IEC 60947 Part 3 and Part 5/Sec 1 set an implementation deadline of August 2, 2025, pushing OEMs to refresh compliance documentation, testing, and labeling to remain eligible for regulated procurement.
On the power-sector project side, the CEA's January 2026 Guidelines for the Type Tests for Major Equipment of Power Sector formalize testing and witnessing practices for major equipment, including GIS and other switchgear. The guidelines include a requirement for external witnessing for type tests even when performed in a NABL-accredited in-house laboratory, which elevates the importance of compliant test plans and third-party witnessing logistics for suppliers serving utility and transmission projects. In parallel, CEA consultations on SF6 alternatives, along with discussion around green switchgear for higher voltage classes, reinforce a policy direction toward lower-GWP insulation technologies, influencing product roadmaps and tender qualifications for 132 kV and above equipment.
Competitive Landscape
Tier-1 international players—Siemens, ABB, and Schneider Electric—combine global R&D expertise with localized production to maintain a technological lead, while domestic champions such as CG Power, L&T, and BHEL leverage cost advantages and government relationships. The top six firms command an estimated 55% collective India switchgear market share, signaling moderate concentration. Siemens invested INR 1,000 crore in capacity, including a Clean-Air GIS line in Goa, which boosts its local content and aligns with potential SF₆ curbs. Schneider Electric’s full buyout of its India joint venture demonstrates long-term confidence and streamlines decision-making in a market transitioning to digital grids.
Domestic mid-tier firms are pursuing vertical integration and selective mergers, typified by CG Power’s INR 155 crore Nashik expansion and the Quality Power–Yash Highvoltage acquisition of Sukrut Electric. White-space opportunities proliferate in SF₆-free products, DC fast-charging switchgear, and cloud-connected panels. OEMs that quantify lifetime cost savings and sustainability benefits stand to displace incumbents wedded to legacy designs. At the low-voltage end, market fragmentation persists, but brand-driven differentiation through aesthetics and safety features is gaining traction, as illustrated by Havells’ recent launch of its smart MCB.
The Make-in-India policy backdrop rewards firms with localized value chains, easing project-specific import restrictions and shortening delivery lead times. Companies with pan-India service networks and remote diagnostic capabilities cement customer stickiness, particularly among utilities facing workforce shortages. Collectively, these dynamics incite both price and feature competition, ensuring a dynamic yet moderately consolidated India switchgear market.
India Switchgear Industry Leaders
Larsen & Toubro Ltd.
ABB India Ltd.
Siemens Ltd.
Schneider Electric India Pvt. Ltd.
CG Power & Industrial Solutions Ltd.
- *Disclaimer: Major Players sorted in no particular order

Market Opportunities and Future Outlook
Grid expansion and inter-state transmission additions create whitespace for high-voltage and extra-high-voltage switchgear packages tied to new substations and line bays. As of December 2025, CTUIL reported 84 projects under execution through the tariff-based competitive bidding (TBCB) route, targeting 37,994 ckt km of transmission lines and 320,000 MVA of transformation capacity. This pipeline supports sustained procurement of AIS/GIS bays, protection panels, and associated controlgear.
In July 2026, POWERGRID received a Letter of Intent for the Krishnagiri REZ Phase-I integration scheme across Andhra Pradesh, Telangana, and Karnataka. The scope includes two 765/400 kV substations and associated lines, linking renewable evacuation programs with large, specification-driven switchgear demand. Two additional opportunity pockets are emerging from rulemaking and localization priorities. In May 2026, the Central Electricity Regulatory Commission (CERC) issued draft Fourth Amendment regulations for Connectivity and General Network Access to the ISTS, covering energy storage norms and flexible access, which increases the need for protection and switching solutions compatible with variable injections and storage interconnection. Separately, the CEA's identification of 73 imported critical items for the T&D sector (December 2025) strengthens the business case for local manufacturing of key subassemblies and spares for switchgear and substation equipment, particularly for suppliers targeting utility tenders that favor resilient domestic supply chains. These shifts also support adoption of digitally enabled switchgear with monitoring and analytics, consistent with RDSS-driven upgrades and the operational needs of data centers and large industrial clusters.
Recent Industry Developments
- July 2026: Power Grid Corporation of India Limited (POWERGRID) received a Letter of Intent for the Transmission System for Integration of Krishnagiri REZ Phase-I, spanning Andhra Pradesh, Telangana, and Karnataka. The scope includes two 765/400 kV substations and associated transmission lines, translating renewable evacuation buildouts into incremental demand for EHV switchgear bays, protection panels, and controlgear across multiple states.
- July 2025: Schneider Electric acquired the remaining 35% stake in Schneider Electric India Private Limited (SEIPL) from Temasek, taking full control of its Indian operations. The consolidation streamlines governance and capital allocation for local manufacturing and portfolio development in a market shifting toward digital and SF6-free switchgear solutions.
- May 2024: Siemens Ltd. announced a capacity expansion program in India, including a dedicated Clean Air GIS line at its Goa facility. The investment strengthens local availability of SF6-free GIS options, supporting customers facing tightening environmental scrutiny and space constraints in urban and industrial substations.


Research Methodology Framework and Report Scope
Market Definition and Coverage
For this study, the India switchgear market covers revenue earned from switchgear equipment sold for electrical protection, isolation, and control across power distribution and transmission use cases within India.
Scope exclusions: We exclude upstream raw materials and components that are not sold as switchgear equipment, along with installation-only labor that is billed separately from product sales.
Segmentation Overview
- By Voltage
- Low Voltage
- Medium Voltage
- High Voltage
- By Insulation
- Gas Insulated Switchgear (GIS)
- Air Insulated Switchgear (AIS)
- Others
- By Current Type
- AC Switchgear
- DC Switchgear
- By Installation
- Indoor
- Outdoor
- By End-User
- Utilities
- Residential
- Commercial
- Industrial
Data Sources, Market Sizing, and Validation
Desk Research
Desk work was used to set the guardrails for the model, before any number was finalized. We reviewed public electricity and grid indicators, along with policy and program disclosures, to map where new substations, feeders, and industrial loads are being added across India.
Key references included non-paywalled sources such as Ministry of Power releases, Central Electricity Authority (CEA) statistics, Central Electricity Regulatory Commission (CERC) tariff and regulatory orders, Power Grid Corporation and state utility tender disclosures, and India's trade statistics (DGFT and customs summaries) for electrical apparatus categories. We also used company annual reports, investor presentations, and reputed press coverage to interpret capacity additions, order flow, and product mix changes. In a few places, paid subscriptions for company financials and an import-export shipment-level database were used to cross-check supplier exposure and trade direction. These examples are illustrative, and many other sources were also reviewed for collection, validation, and clarification.
Primary Interviews and Surveys
Primary checks helped us convert broad power sector activity into realistic switchgear revenue assumptions for India. We spoke with utility procurement and project teams, EPC and panel integrators, distributors, and industrial facility electrical managers to confirm order cycles, typical configurations, and pricing movement across low, medium, and high voltage demand points. Since this is an India-only market, coverage was balanced across key industrial corridors and high-growth urban loads so the final view is not dominated by one region's spend pattern.
Distribution of primary research fieldwork respondents
| Company type | Respondent position |
|---|---|
| Top tier: 34% | CXOs: 12% |
| Mid tier: 47% | Functional/Unit leaders: 34% |
| Smaller Players: 19% | Managers: 54% |
Market-Sizing & Forecasting
The sizing logic starts with a top-down reconstruction of India's demand pool from grid buildout and electrification activity, and then the totals are checked using selective bottom-up rollups so the outcome stays practical and repeatable. In the top-down layer, we map annual additions and upgrades in substations and distribution networks, and then translate these into switchgear demand using typical bill-of-material patterns by voltage class and installation type.
A few inputs that matter a lot for this market were tracked and refreshed through the model, such as planned and executed transmission and distribution capex, substation and feeder additions, renewable integration needs (which drive switchgear upgrades), industrial capacity expansions in power-intensive sectors, and price movement for common switchgear ratings seen in competitive tenders. Where direct unit information was uneven, gaps were handled by using proxy ratios from comparable projects and applying conservative utilization assumptions that were confirmed through interviews.
For the forecast, we used scenario analysis supported by expert expectations on grid spend timing and industrial project slippage, and then converted scenarios into a single base case. That base case was stress-tested by varying two or three sensitive drivers (capex execution rate, tender pricing, and mix shift toward GIS in space-constrained sites) so the forecast does not overreact to one indicator.
Data Validation & Update Cycle
Before results are signed off, outputs are triangulated across multiple checks that do not share the same data weaknesses. We compare the implied market value against independent signals such as utility capex disclosures, tender award volumes, and the direction of electrical apparatus trade, and then investigate variances that fall outside a reasonable band.
A second analyst review is done to re-check assumptions, units, and conversions, followed by targeted re-contacts when pricing, mix, or execution rates look inconsistent. Reports are refreshed annually, and interim updates are made when material events occur, such as major policy changes, large grid programs, or sharp input cost swings. Right before delivery, a final pass is performed so clients receive the latest updated view rather than an older snapshot.
Mordor Intelligence's India Switchgear Market Size Compared Against Other Published Estimates
Published market values for India switchgear often differ because each publisher makes different choices on what counts as switchgear revenue and how project timing is converted into annual sales. Differences in voltage coverage, inclusion of controlgear or panel assemblies, and how pricing is normalized across tender and non-tender channels can all change the final number.
Some external estimates narrow the scope to voltage switchgear categories, and others indirectly size only part of the value chain by relying on limited segment snapshots. In our work, Mordor Intelligence counts switchgear equipment revenue across LV, MV, and HV sold in India for utility, industrial, commercial, and residential end use, and it avoids adding adjacent products like cables, transformers, or services that are commonly procured in the same projects.
Benchmark comparison
| Source | Market Size | Gaps in Research Methodology |
|---|---|---|
| Mordor Intelligence | USD 5.38 B (2025) | |
| Industry Platform A | USD 3.20 B (2025) | This figure is presented as a voltage switchgear view and tends to track equipment format and voltage levels without fully reconciling utility and industrial procurement that sits outside the specific definitions used, which can undercount broader switchgear demand. |
| Trade Community B | USD 11.33 M (2025) | The value is materially smaller than sector spending signals and appears tied to a limited snapshot, which likely excludes large utility and industrial orders and may mix units or currencies, making it unsuitable for a full India market total. |
The spread across the table mainly comes from scope choices and from how procurement signals are translated into revenue for a given year. By keeping the counted products specific to switchgear equipment, and by checking pricing and execution rates against tenders and on-ground feedback, the final number stays traceable to real demand drivers and can be repeated when new data comes in.


Key Questions Answered in the Report
What is the projected value of the India switchgear market by 2031?
The India switchgear market is forecast to reach USD 8.24 billion by 2031, underpinned by a 7.35% CAGR driven by grid modernization and renewable integration initiatives.
Which voltage segment shows the fastest growth in India?
High-voltage equipment leads expansion with a 9.28% CAGR through 2031, fueled by INR 9.1 trillion transmission investments targeting 400 kV and 765 kV corridors.
How are environmental regulations impacting switchgear choices?
Anticipated SF₆ restrictions are accelerating demand for vacuum and dry-air GIS alternatives, evidenced by Siemens and ABB investments in clean-air manufacturing lines.
Why is DC switchgear gaining relevance in India?
Rapid build-out of hyperscale data centers, battery storage plants, and EV fast-charging networks is lifting demand for DC breakers, projected at an 8.42% CAGR.
Who holds the largest share of India’s switchgear sector?
Utilities remain the dominant end user, accounting for 42.40% of 2025 revenues and continuing to grow at an 8.05% CAGR as RDSS and green-energy corridor projects advance.
Utilities remain the dominant end user, accounting for 42.40% of 2025 revenues and continuing to grow at an 8.05% CAGR as RDSS and green-energy corridor projects advance.
High upfront costs of GIS systems and uncertainty over SF₆ phase-out timelines may slow adoption among cost-sensitive utilities, subtracting up to 2% from the forecast CAGR.
Page last updated on:


 Your data is secure and never sold or shared.


