
Market Overview
| Study Period | 2020 - 2031 |
|---|---|
| Forecast Data Period | 2026 - 2031 |
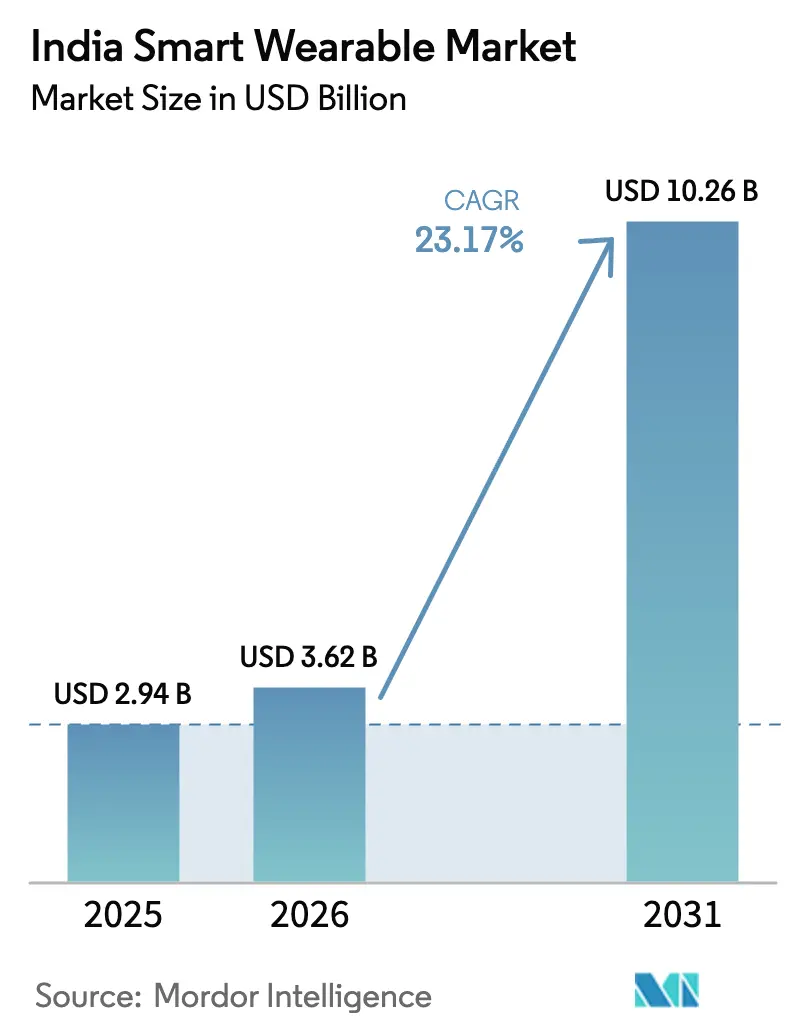
| Base Year Market Size (2025) | USD 2.94 Billion |
| Market Size (2026) | USD 3.62 Billion |
| Market Size (2031) | USD 10.26 Billion |
| Growth Rate (2026 - 2031) | 23.17 % |
| Market Concentration | Medium |
Major Players *Disclaimer: Major Players sorted in no particular order Image © Mordor Intelligence. Reuse requires attribution under CC BY 4.0. | |
India Smart Wearable Market Analysis by Mordor Intelligence
The India smart wearable market size was valued at USD 2.94 billion in 2025 and estimated to grow from USD 3.62 billion in 2026 to reach USD 10.26 billion by 2031, at a CAGR of 23.17% during the forecast period (2026-2031). Momentum reflects three mutually reinforcing forces: a health-aware middle class that is purchasing connected devices as everyday medical companions, steep average-selling-price (ASP) contractions enabled by local production incentives, and the integration of wearables into government-backed digital-health and payments infrastructure. Domestic brands leverage the Production Linked Incentive (PLI) program to on-shore electronics assembly, which compresses cost structures and enlarges the addressable consumer base beyond Tier 1 cities. Parallel roll-outs of Unified Payments Interface (UPI) “tap-and-pay” functionality are repositioning smartwatches from lifestyle accessories to quasi-bank cards, widening use-case appeal among price-sensitive shoppers. Finally, teleconsultation services delivered under the Ayushman Bharat Digital Mission (ABDM) are encouraging physicians to request remote vitals, giving medical legitimacy to devices once regarded as novelties.
Key Report Takeaways
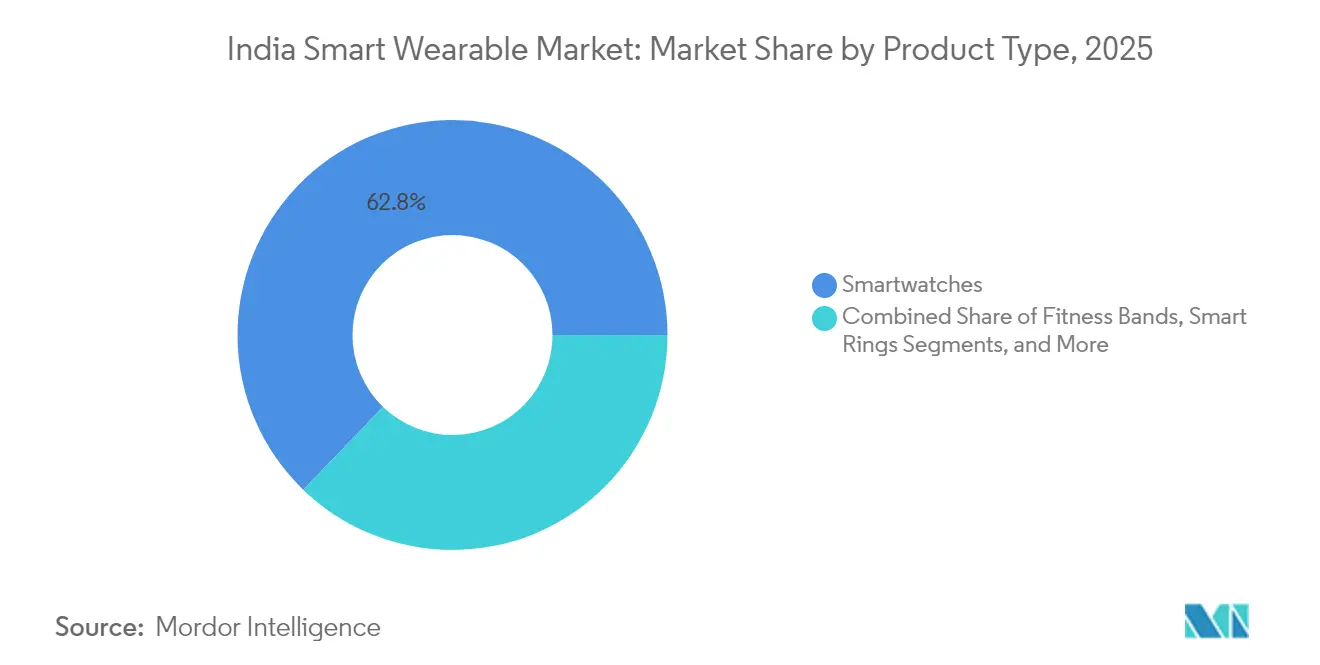
- By product type, smartwatches held 62.78% of the India smart wearable market share in 2025, whereas smart rings are projected to post a 24.4% CAGR through 2031.
- By connectivity, Bluetooth-only models represented 87.12% of the India smart wearable market size in 2025, but LTE/eSIM shipments are forecast to expand at 25.1% CAGR over 2026-2031.
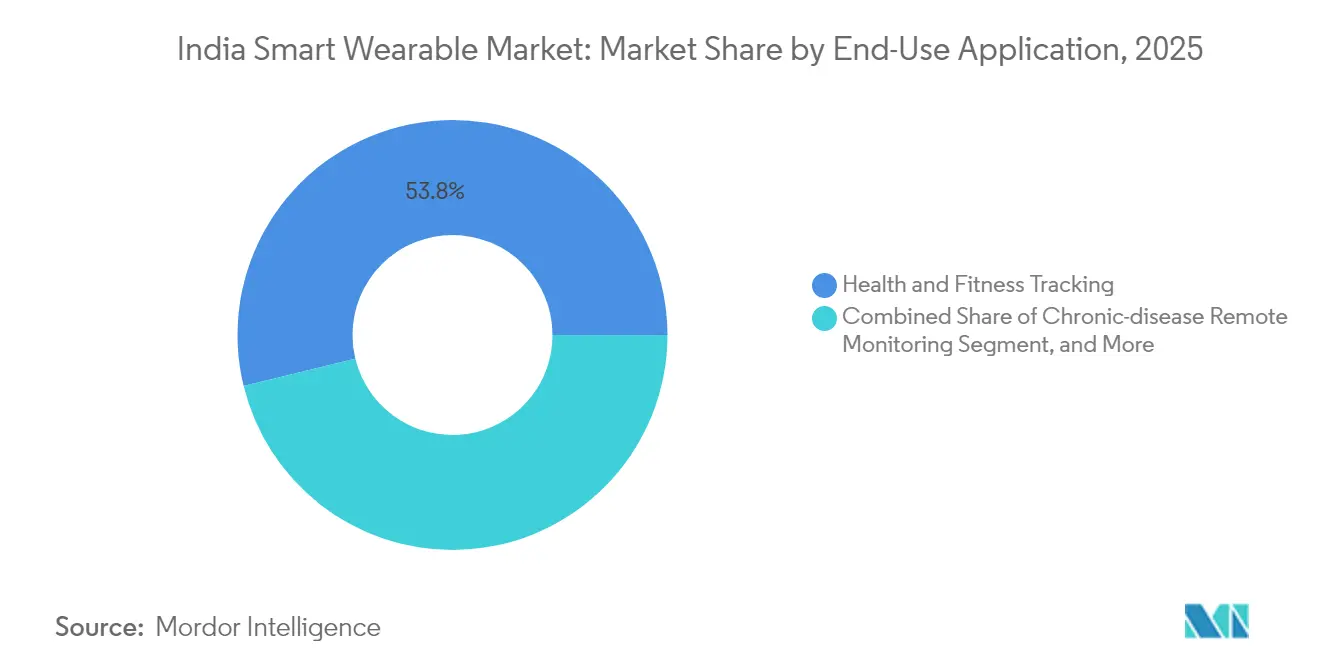
- By application, health and fitness tracking captured 53.82% of the India smart wearable market size in 2025, while chronic-disease monitoring is advancing at 23.9% CAGR toward 2031.
Note: Market size and forecast figures in this report are generated using Mordor Intelligence’s proprietary estimation framework, updated with the latest available data and insights as of 2026.
India Smart Wearable Market Trends and Insights
Drivers Impact Analysis*
| Driver | (~) % Impact on CAGR Forecast | Geographic Relevance | Impact Timeline |
|---|---|---|---|
| Rising health- and fitness-conscious middle class | +6.2% | National, with concentration in Tier 1 cities expanding to Tier 2 markets | Medium term (2-4 years) |
| Rapid ASP decline from intense domestic competition | +4.8% | National, particularly affecting sub-INR 5,000 segment | Short term (≤ 2 years) |
| Government PLI and Digital Health incentives | +3.5% | National, with pilot implementations in select states | Long term (≥ 4 years) |
| Health-insurance discounts for wearables data | +2.9% | Urban centers with organized insurance penetration | Medium term (2-4 years) |
| Emergence of smart rings as jewellery-friendly form factor | +3.1% | Metropolitan areas with higher disposable income | Medium term (2-4 years) |
| UPI-enabled contactless payments via wearables | +2.6% | National, leveraging existing UPI infrastructure | Short term (≤ 2 years) |
| Source: Mordor Intelligence | |||
Rising Health-Focused Middle Class
India’s urban and peri-urban middle class now views connected sensors as practical tools for managing chronic ailments. An estimated 172,148 Health and Wellness Centers had delivered 2.59 billion wellness sessions by mid-2025, creating day-to-day demand for automated vitals capture.[1]Simultaneously, 65 crore citizens have generated Ayushman Bharat Health Accounts (ABHA), normalizing digital medical records that can ingest smartwatch or smart-ring data.[2] These parallel developments position the India smart wearable market as an indispensable adjunct to the primary-care network rather than an optional consumer gadget category.
Rapid ASP Decline from Domestic Competition
Local assemblers operating under the Electronics Component Manufacturing Scheme receive cap-ex and turnover subsidies that reduce bill-of-materials costs by up to 12%. As a result, nine out of every ten smartwatches shipped in Q1 2025 retailed below INR 5,000, accelerating device diffusion in Tier 2 geographies. While ASP contraction squeezes gross margins, the volume surge enlarges the active installed base, creating follow-on opportunities for subscription software, accessories, and replacement straps that offset hardware compression.
Government PLI and Digital-Health Schemes
The 22,919 crore Electronics Component Manufacturing Scheme and the 76,000 crore Semicon India initiative deliver tax credits that shorten payback periods for chip-on-board, display, and battery plants dedicated to wearables. Interoperability stipulations embedded in ABDM further mandate open APIs, encouraging startups to build disease-specific analytics on top of raw device telemetry. The India smart wearable market therefore benefits from both supply-side subsidies and demand-side clinical validation.
Insurance Discounts for Wellness Data
Regulator-approved “pay-how-you-live” pilots allow insurers to reward step counts or heart-rate adherence with premium rebates. Early trials offering free smartwatches in exchange for 15,000 daily steps produced policy-renewal rates 17% higher than traditional plans, translating into lower claims costs and higher customer-lifetime value for underwriters. Such quantifiable returns convince insurers to subsidize hardware outright, subsidizing further penetration of the India smart wearable market.
Restraints Impact Analysis*
| Restraint | (~) % Impact on CAGR Forecast | Geographic Relevance | Impact Timeline |
|---|---|---|---|
| ASP erosion squeezing OEM margins | -3.8% | National, affecting all price segments | Short term (≤ 2 years) |
| Data-privacy and cybersecurity concerns | -2.1% | Urban centers with higher digital literacy | Medium term (2-4 years) |
| Lengthening replacement cycles after first-time buyer boom | -2.9% | National, particularly in saturated Tier 1 markets | Medium term (2-4 years) |
| CDSCO ambiguity on medical-grade wearables | -1.6% | National, affecting health-focused applications | Long term (≥ 4 years) |
| Source: Mordor Intelligence | |||
ASP Erosion Squeezing OEM Margins
Price wars have already reduced smartwatch ASPs by 42% since 2023, eroding gross margins for second-tier brands. Unless firms monetize cloud analytics or expand into adjacent audio accessories, cash-flow stress could force consolidation, trimming the long-tail of competitors that now accounts for 38% of shipments. Over 2026-2027, fewer SKUs may translate into slower feature innovation, introducing softness in the India smart wearable market growth curve.
Data-Privacy and Cybersecurity Concerns
The Draft Digital Personal Data Protection Rules 2025 classify biometric data as “critical,” obligating device makers to perform mandatory Data-Protection-Impact-Assessments before commercial launch.[3] Compliance costs raise barriers for budget brands already operating on razor-thin margins. In addition, media coverage of Bluetooth spoofing and cloud-storage breaches reinforces consumer skepticism, potentially lengthening replacement cycles and delaying upgrades in the India smart wearable industry.
*Our forecasts treat driver/restraint impacts as directional, not additive. The impact forecasts reflect baseline growth, mix effects, and variable interactions.
Segment Analysis
By Product Type: Smartwatch Dominance With Ring Momentum
Smartwatches generated 62.78% of the India smart wearable market size in 2025, buoyed by multi-sensor arrays that bundle fitness, communication, and UPI payments in a single wrist-top interface. In contrast, smart rings, while still niche, are tracking a 24.4% CAGR as jewelry-friendly aesthetics appeal to style-conscious millennials.
Continued smartwatch leadership is underwritten by rapid feature creep, such as LTE modules, 2 GB RAM, and a full Android OS that converts the device into a phone substitute. Yet rings enjoy a higher average revenue per unit, USD 204, subsidizing premium titanium builds and medical-grade photoplethysmography sensors. Over the forecast horizon, rings could capture cardiometabolic-monitoring niches even while watches retain mass-market status, ensuring both categories coexist rather than cannibalize within the India smart wearable market.

By Connectivity: Bluetooth Prevalence, Lte Inflection
Bluetooth-only SKUs accounted for 87.12% of 2025 unit sales because tethering keeps bill-of-materials low and battery life high. Nevertheless, LTE/eSIM shipments will climb at 25.1% CAGR, elevating their slice of the India smart wearable market share once nationwide 5G coverage exceeds 99% of districts in 2026.
Standalone connectivity unlocks emergency calling, untethered music streaming, and over-the-air diagnostics—functionality valued by outdoor athletes and parents of school-age children. Operators are already trialing INR 99 monthly data packs dedicated to wearables, converting telcos into after-sales revenue partners for device OEMs.
By Application: Fitness Core, Chronic-Care Surge
Health-and-fitness features represented 53.82% of 2025 revenues as step tracking and sleep scoring became hygiene factors across pricing tiers. The next growth spike comes from chronic-disease remote monitoring, projected at 23.9% CAGR on the back of diabetes and hypertension prevalence. Hospitals integrating ABDM-ready dashboards can now ingest continuous glucose trends or arrhythmia alerts directly from consumer devices, eliminating manual logs and lowering outpatient revisit frequency. Commercial payments and access-control use-cases will also expand once RuPay “on-the-go” tokenization limits rise beyond INR 5,000, nudging the India smart wearable market toward enterprise turnstile and transit-ticketing deployments.
Regulatory Landscape
Smart wearables sold in India sit at the intersection of electronics safety, telecom conformity, and personal-data governance. On the product side, smart watches and similar ICT-class devices fall under the BIS Compulsory Registration Scheme (CRS) notified under MeitY, with testing aligned to BIS safety standards. This includes the legacy IS 13252 (Part 1) and the newer IS/IEC 62368-1:2023 pathway, which is being integrated into compliance practice. For connected wearables that embed cellular or other telecom functions, the Department of Telecommunications ecosystem adds mandatory conformity through the Telecommunication Engineering Centre (TEC) under the MTCTE regime, increasing the compliance load for LTE/eSIM models compared with Bluetooth-only SKUs.
The regulatory perimeter is also tightening around connectivity assurance and accountability in the telecom supply chain. The Telecommunications (Standards, Conformity Assessment and Certification) Rules, 2025 establish the current framework for mandatory conformity assessment of telecom equipment and reinforce shared responsibility among OEMs, importers, and distributors across the lifecycle. Alongside this, the Draft Digital Personal Data Protection Rules 2025 elevate expectations for biometric-data handling through Data Protection Impact Assessments, which raises documentation and security-by-design requirements for health-heavy wearables. BIS standardization work via the LITD33 committee (aligned with IEC/TC 124) further supports convergence toward clearer performance and interoperability baselines for emerging wearable categories, including body area networks and related sensor-driven devices.
Competitive Landscape
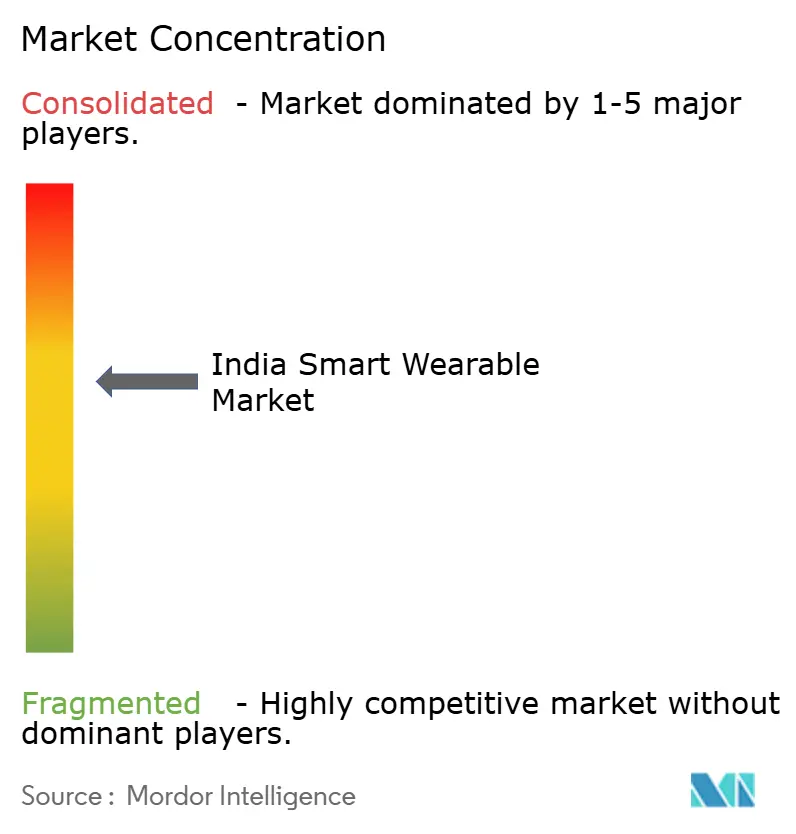
The India smart wearable market exhibits a Herfindahl-Hirschman Index consistent with moderate concentration. Noise leads with 24.8% smartwatch shipments after securing USD 20 million from Bose to scale local assembly lines. boAt follows, though its share slipped from 19% to 14% amid intensifying ring and LTE offerings from Chinese OEMs positioning at USD 38 ASP.
Strategic playbooks converge on backward integration: more than 90% of Noise units are now built in-country, compressing freight and import duties while qualifying for PLI rebates. Simultaneously, horizontal diversification into audio (TWS earbuds) and smart-home (security cams) products helps brands amortize R&D across ecosystems. New entrants, notably Ultrahuman, ride a premium track, raising USD 35 million to push smart rings with AI-based metabolic insights.
Global technology majors (Samsung, Apple, Google) retain aspirational cachet but collectively represent under 8% of volume; high import duties and channel margins inflate retail tags beyond INR 25,000. Their influence, however, shapes feature expectations, once ECG or NFC payments debut in flagship imports, domestic replicas appear within two product cycles.
India Smart Wearable Industry Leaders
-
Apple Inc.
-
Samsung Electronics Co., Ltd.
-
Xiaomi Corporation
-
Google LLC (Pixel Watch)
-
Nike, Inc.
- *Disclaimer: Major Players sorted in no particular order
Market Opportunities and Future Outlook
Policy push and incentives broaden the wearable ecosystem in India. In 2026, the Mobile Phone Manufacturing Scheme (MPMS) received cabinet approval with an outlay of INR 62,500 crore for FY 2026-27 to 2030-31, and Semicon 2.0 with INR 1.27 lakh crore. These incentives expand the pool of support available to wearable OEMs and component suppliers. Private investment also adds momentum: Foxconn Singapore injected about Rs 319 crore into its Indian arm in June 2026 to scale manufacturing operations, and Optiemus Electronics partnered in March 2026 to manufacture 3 million mobile and wearable devices at its Noida facility backed by a Rs 125 crore, five-year investment.
Compliance and standards evolution create opportunity lanes for organized brands that can industrialize certification and series registrations at scale. MeitY issued series guidelines in May 2026 for IS/IEC 62368-1:2023 that allow registering up to 10 models (one lead plus nine in a series) under a single registration construct for eligible products, which can reduce the time and cost to refresh portfolios amid rapid ASP-driven SKU churn. On the demand side, ABDM-linked digital health workflows, including ABHA-linked records and remote vitals capture, and ongoing UPI tap-and-pay integration expand addressable use cases beyond fitness tracking. This creates room for device makers, insurers, and teleconsultation ecosystems to package hardware plus services into repeatable programs.
Recent Industry Developments
- June 2026: Foxconn Singapore injected about Rs 319 crore into its Indian arm to scale manufacturing operations for wearables and consumer electronics. The move expands domestic production capacity and supplier coverage, strengthening the Indian wearables ecosystem.
- June 2026: Wear OS 7 rollout for Pixel Watches adds Gemini AI features alongside system optimizations aimed at better efficiency and user experience. It raises the baseline for premium smartwatch software capabilities and increases feature parity pressure on Android-based and Wear OS-aligned devices sold in India.
- April 2025: Bose invested USD 20 million in Noise through compulsory convertible debentures to fund factory automation and marketing. The funding supported scaling of in-country assembly and brand-building, signaling strategic interest from a global audio brand in India wearables ecosystems.
Research Methodology Framework and Report Scope
Market Definition and Coverage
This market covers the value of smart wearable devices sold and used in India, where the device has sensors and software that track activity, health signals, connectivity, or user interactions, and the totals are presented in USD.
Scope exclusions: We exclude conventional watches and basic accessories that do not generate measurable smart functions, as well as standalone smartphone apps without a wearable device.
Segmentation Overview
- By Product Type (Value)
- Smartwatches
- Fitness Bands
- Smart Rings
- Smart Glasses
- Other Product Types
- By Connectivity Technology (Value)
- Bluetooth-only
- Bluetooth + LTE/eSIM
- NFC-enabled
- By End-Use Application (Value)
- Health and Fitness Tracking
- Chronic-disease Remote Monitoring
- Payments and Access Control
- Industrial and Field Workforce
- Other End-Use Applications
Data Sources, Market Sizing, and Validation
Desk Research
Desk work was used to set market boundaries, build the first demand and supply indicators, and then pressure test early assumptions. We reviewed public sources such as MeitY and DPIIT releases, DGFT trade notices, Customs tariff and import-export statistics, and BIS standards that influence device approvals and labeling. Consumer and connectivity context was added using sources such as TRAI updates, NPCI guidance around UPI touchpoints, and NITI Aayog publications that relate to digital health and remote monitoring.
We also relied on company annual reports, investor decks, earnings transcripts, and reputable business press to understand pricing moves, channel expansion, and product launches. A paid subscription focused on company financials and news was used to map entity structures and cross-check disclosed revenue cues, and a paid patent database was referenced to spot feature areas that can change replacement demand. These examples are indicative only, and many other sources were referred to for data collection, validation, and research clarification during the study.
Primary Interviews and Surveys
Primary inputs came from interviews and structured questionnaires with device brands, contract manufacturing and component contacts, offline and online channel participants, and healthcare or enterprise users that deploy wearables for monitoring and workforce use cases. We used these discussions to confirm shipment direction, realistic ASP bands, the mix shift across smartwatches, fitness bands, rings, and glasses, and the pace of NFC and LTE or eSIM adoption in India.
Distribution of primary research fieldwork respondents
| Company type | Respondent position |
|---|---|
| Top tier: 38% | CXOs: 19% |
| Mid tier: 41% | Functional/Unit leaders: 25% |
| Smaller Players: 21% | Managers: 56% |
Market-Sizing & Forecasting
Market sizing was built using top-down and bottom-up logic, where India device demand is first reconstructed from shipment signals and category penetration, and then corrected using grounded price and mix checks. On the top-down side, we track India wearables unit trends, the changing share of smartwatches versus ear-worn and other form factors, and the typical replacement cycle that moves with battery life and feature upgrades. We also model how Bluetooth-only versus LTE or eSIM devices and NFC-enabled devices affect realized value, because connectivity choices influence both pricing and usage intensity.
Once the demand pool is shaped, selective bottom-up approximations are used to keep the totals realistic, including sampled ASP by product type, channel mix checks across online versus offline, and a supplier and assembler view of what is practically available in the market. When a product bucket has weaker disclosure, gaps are handled using conservative mix assumptions anchored to what channel participants see, and then we re-check totals against import patterns and announced manufacturing scale where relevant.
Forecasts were derived using scenario analysis supported by a simple multivariate regression layer. Variables such as ASP progression, feature-led upgrade rates, consumer spending sentiment, and policy-linked local manufacturing momentum are allowed to move together. The forward view is adjusted when primary experts point to step changes, including sudden price cuts, new payment use cases, or a demand pause after an over-shipment period.
Data Validation & Update Cycle
Validation is done through repeated checks across independent signals, so the modeled value does not drift away from what the market can support. We compare outputs against unit shipment direction, price band movement, and category mix shifts, and then investigate any large variance before sign-off. Where a number looks out of place, the assumptions are revisited and respondents are re-contacted to confirm whether the issue is timing, definition, or a one-time event.
Before publication, the full model is reviewed in steps by another analyst to confirm arithmetic, logic flow, and scope consistency, followed by a final edit pass to ensure the narrative matches the numbers. Reports are refreshed annually, and interim updates are triggered when material events occur, such as major policy changes, sharp pricing resets, or sudden category-level demand swings. Right before delivery, we perform a fresh check so clients receive the latest updated view.
Mordor Intelligence's India Smart Wearable Market Sizing Compared With Other Published Estimates
It is normal to see different market size numbers for India smart wearables because publishers do not always count the same products, the same connectivity features, or even the same buying channels. Some estimates also pick a different base year and then apply a faster or slower price trend, which changes the value totals quickly in a market that is still price sensitive.
By tracking device mix, connectivity adoption, and India-only pricing bands through repeated channel checks, Mordor Intelligence keeps the total tied to smart wearables that deliver measurable functions, rather than bundling broad audio accessories or generic consumer electronics. The largest gap drivers typically come from whether ear-worn products are included, how smartwatch ASP declines are treated during high discounting periods, and whether values are converted using average annual currency rates versus a point-in-time rate, which can shift the USD view even if local pricing is stable.
Benchmark comparison
| Source | Market Size | Gaps in Research Methodology |
|---|---|---|
| Mordor Intelligence | USD 2.94 B (2025) | |
| Industry Tracker A | USD 2.35 B (2025) | Often focuses on smartwatch and band value using a narrower device list, and may exclude smart rings and smart glasses, which reduces the counted addressable value. |
| Trade Journal B | USD 3.40 B (2025) | Tends to fold in a wider wearables bucket that can include a larger portion of ear-worn devices, and may apply higher implied ASPs from premium launches without fully normalizing for discount-led price compression. |
The spread in the table mainly comes from scope boundaries and how pricing is treated during a year with strong promotions and fast mix changes. When device inclusion rules are kept explicit, and assumptions are cross-checked with channel and shipment signals, the resulting market size stays easier to repeat and easier to audit over time.
Key Questions Answered in the Report
How big is the India smart wearable market in 2026?
The India smart wearable market size is USD 3.62 billion in 2026.
What CAGR is forecast for Indian smart wearables through 2031?
Revenue is projected to expand at a 23.17% CAGR between 2026 and 2031.
Which product segment holds the highest share today?
Smartwatches command 62.78% of 2025 revenue.
Why are LTE/eSIM wearables gaining traction?
Stand-alone connectivity supports untethered calls, safety alerts, and payments as 5 G covers 99% of districts.
How are insurers using wearable data?
Leading insurers offer premium rebates or free devices when customers meet activity targets, linking wellness to underwriting.