
India Satellite Imagery Services Market Size and Share
Market Overview
| Study Period | 2020 - 2031 |
|---|---|
| Forecast Data Period | 2026 - 2031 |
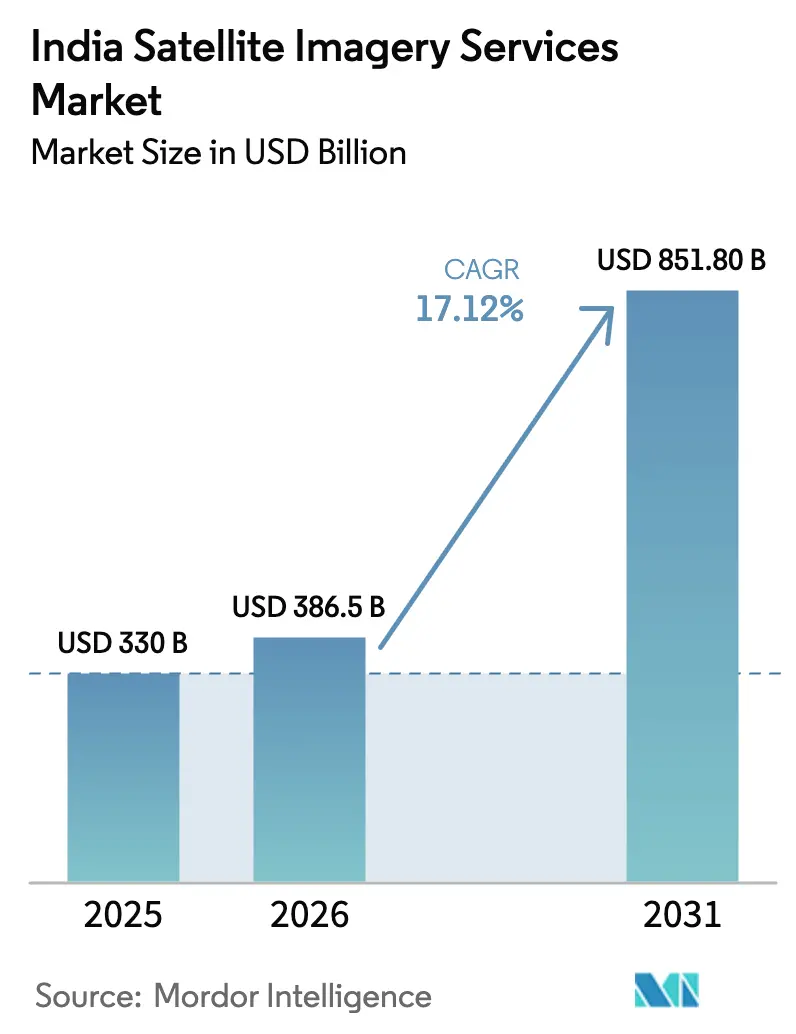
| Base Year Market Size (2025) | USD 330 Billion |
| Market Size (2026) | USD 386.5 Billion |
| Market Size (2031) | USD 851.8 Billion |
| Growth Rate (2026 - 2031) | 17.12% CAGR |
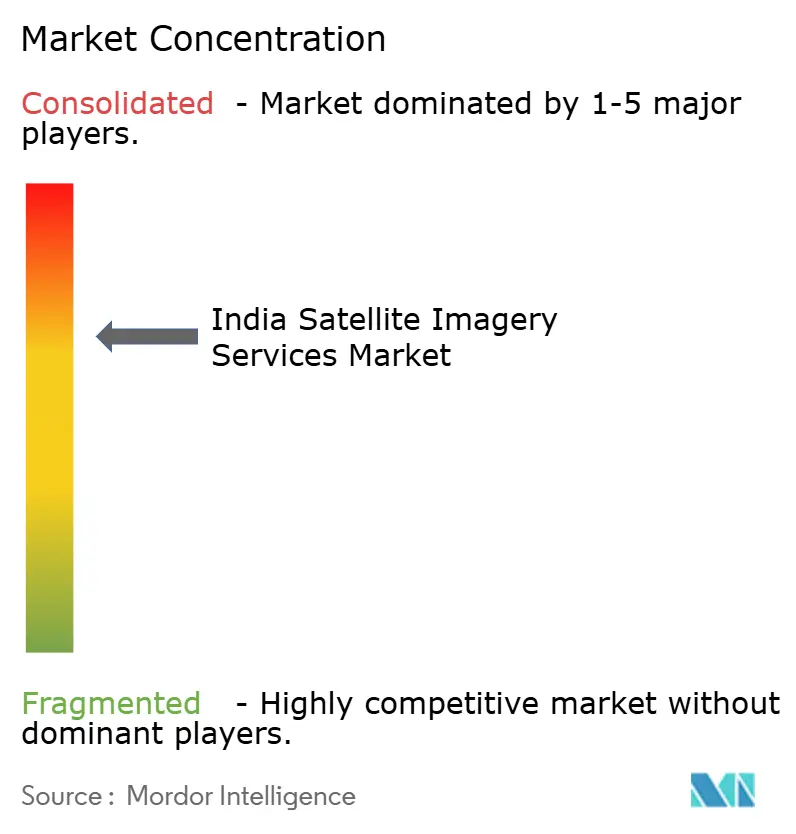
| Market Concentration | Medium |
Major Players *Disclaimer: Major Players sorted in no particular order Image © Mordor Intelligence. Reuse requires attribution under CC BY 4.0. | |
India Satellite Imagery Services Market Analysis by Mordor Intelligence
The India satellite imagery services market size is expected to grow from USD 330 million in 2025 to USD 386.5 million in 2026 and is forecast to reach USD 851.8 million by 2031 at 17.12% CAGR over 2026-2031. Government-backed digitization programs, surging private‐sector satellite launches and growing defense requirements collectively accelerate data consumption, while expanding hyperspectral capacity widens the scope of commercial applications. Momentum is strongest where public funding converges with venture capital, such as Smart Cities 2.0 and Digital Agriculture Mission, which shortens innovation cycles and fosters a thriving ecosystem of analytics start-ups. As revisit times fall from weeks to daily coverage, enterprises that once relied on annual mapping updates now migrate toward subscription-based feeds, creating stickier revenue models. Competitive intensity is heightened by international partnerships that bring advanced radar and cloud-native processing to domestic players, yet regulatory liberalization and IN-SPACe clearances keep strategic control firmly in Indian hands.
Key Report Takeaways
- By application, Geospatial Data Acquisition and Mapping led with a 28.24% revenue share in 2025, while Precision Agriculture is forecast to expand at a 17.6% CAGR through 2031.
- By end-user, Government Agencies held 41.88% of the India satellite imagery services market share in 2025, whereas financial services and insurance post the highest projected CAGR at 18.02% through 2031.
- By service type, Value-Added Analytics accounted for 45.36% of the India satellite imagery services market size in 2025; Platform-as-a-Service/API access is rising at an 18.15% CAGR to 2031.
- By imaging type, High-resolution data (0.5–1 m) captured 38.12% of 2025 revenues in the India satellite imagery services market, and hyperspectral imaging is advancing at an 17.85% CAGR during the same period.
Note: Market size and forecast figures in this report are generated using Mordor Intelligence’s proprietary estimation framework, updated with the latest available data and insights as of 2026.
India Satellite Imagery Services Market Trends and Insights
Drivers Impact Analysis*
| Driver | (~) % Impact on CAGR Forecast | Geographic Relevance | Impact Timeline |
|---|---|---|---|
| Public-private EO satellite launches post-2025 | +3.2% | National; Bengaluru, Hyderabad clusters | Medium term (2-4 years) |
| Defense and border management digitization programs | +4.1% | Northern and eastern borders, coastal belts | Long term (≥ 4 years) |
| Precision-agri subsidy schemes (e-NAM 2.0, Digital Ag Mission) | +2.8% | Punjab, Haryana, Uttar Pradesh, Maharashtra | Short term (≤ 2 years) |
| Mandated LiDAR-based city planning for Smart-Cities 2.0 | +1.9% | 100 designated smart cities | Medium term (2-4 years) |
| Cat-6 cyclone early-warning upgrade roadmap | +1.4% | East and west coastal states | Short term (≤ 2 years) |
| Satellite-IoT back-haul for nationwide 5G densification | +2.1% | Rural and remote districts | Medium term (2-4 years) |
| Source: Mordor Intelligence | |||
Public-private EO satellite launches post-2025
IN-SPACe clearances opened the launch market to private firms, enabling constellations such as Pixxel’s three-satellite hyperspectral cluster that flew in January 2025. Venture funding coupled with a Rs 1,500 crore public-private tender attracts global primes and local start-ups, driving revisit times down to sub-daily windows. Cheaper access lowers entry barriers for insurers, agritech firms and logistics operators, widening the India satellite imagery services market. Partnerships with BlackSky and Thales Alenia Space inject advanced tasking and cloud delivery capabilities, strengthening domestic analytics depth. As a result, imagery supply is set to outpace historical demand, pivoting market dynamics from data scarcity to value-added differentiation.
Defense and border management digitization programs
The SBS-3 program covering 52 satellites commits sustained funding to all-weather surveillance along contested borders. Dual-use payloads generate commercial spillovers, especially in infrastructure security and resource monitoring, thereby deepening the India satellite imagery services market. Inter-satellite links and AI-enabled onboard processing shrink decision loops from hours to minutes, feeding demand for near-real-time analytics dashboards. Indigenous sourcing clauses foster technology transfer to private manufacturers, lifting local content in optical, SAR and propulsion subsystems. The sustained cadence of military launches ensures baseline capacity that private clients can opportunistically lease during peacetime windows.
Precision-agri subsidy schemes (e-NAM 2.0, Digital Ag Mission)
A budget outlay under the Digital Agriculture Mission links farmer registries to satellite-derived crop indices, shifting subsidy disbursal from area-based norms to pixel-level verification.[1]Press Information Bureau, “Digital Agriculture Mission,” pib.gov.inTamil Nadu’s Sentinel-1 pilot validated payout acceleration by 30 days, catalyzing adoption in other agrarian states. The policy pull pushes lenders and insurers to embed end-of-season yield forecasts directly into underwriting, expanding addressable users beyond agronomic departments. As ISO 19115 metadata standards become mandatory, interoperable data pipelines cut integration costs, supporting broader deployment across 400 districts. Elevated imagery cadence enables pest and moisture alerts, translating into recurring subscription revenue for analytics vendors.
Mandated LiDAR-based city planning for Smart-Cities 2.0
Revised Smart Cities guidelines stipulate LiDAR-fused ortho-imagery as the base map for zoning, utilities and transport corridors. Central grants of Rs 48,000 crore underwrite procurement, creating a predictable tender pipeline that sustains the India satellite imagery services market. Pilot programs such as NAKSHA demonstrate 50% faster permit issuance once geospatial layers are integrated, compelling municipal corporations to lock in multi-year imagery contracts. Satellite coverage offers a cost-effective complement to drone surveys for change detection over sprawling urban footprints. The policy also mandates open Web-GIS portals, embedding imagery services into citizen-facing applications and enlarging user bases.
Restraints Impact Analysis*
| Restraint | (~) % Impact on CAGR Forecast | Geographic Relevance | Impact Timeline |
|---|---|---|---|
| Fee-based access to less than 1 m IRS imagery below 2018 baseline | −2.1% | Nationwide commercial segment | Short term (≤ 2 years) |
| Data-localization and multi-agency clearance delays | −1.8% | Nationwide, cross-border deals | Medium term (2-4 years) |
| Limited interoperability across state-run data portals | −1.3% | Digitally lagging states | Medium term (2-4 years) |
| Shortage of hyperspectral image analysts | −0.9% | Bengaluru, Hyderabad, Pune | Long term (≥ 4 years) |
| Source: Mordor Intelligence | |||
Fee-based access to less than 1 m IRS imagery below 2018 baseline
NewSpace India Limited shifted sub-meter archives to a paid model, raising input costs for agritech, forestry and urban-planning start-ups.[2]National Remote Sensing Centre, “Bhoonidhi Home,” nrsc.gov.inStart-ups now weigh paying for legacy Indian data against sourcing fresher foreign imagery, which undercuts domestic capacity-building. Although the National Geospatial Policy removes prior-approval hurdles, the funding gap persists until competitive private constellations scale sufficiently to lower domestic prices.
Data-localization and multi-agency clearance delays
Projects involving cross-border imagery transfer face overlapping scrutiny from the Department of Space and the Ministry of Defence, extending contract cycles by three to six months. Uncertainty deters some international insurers and commodity traders from integrating Indian feeds, constraining export earnings. The Geospatial Data Promotion Committee promises single-window clearance, yet operational roll-out remains slow.
*Our forecasts treat driver/restraint impacts as directional, not additive. The impact forecasts reflect baseline growth, mix effects, and variable interactions.
Segment Analysis
By Application: Government-led Mapping Dominance Gives Way to Agri Upside
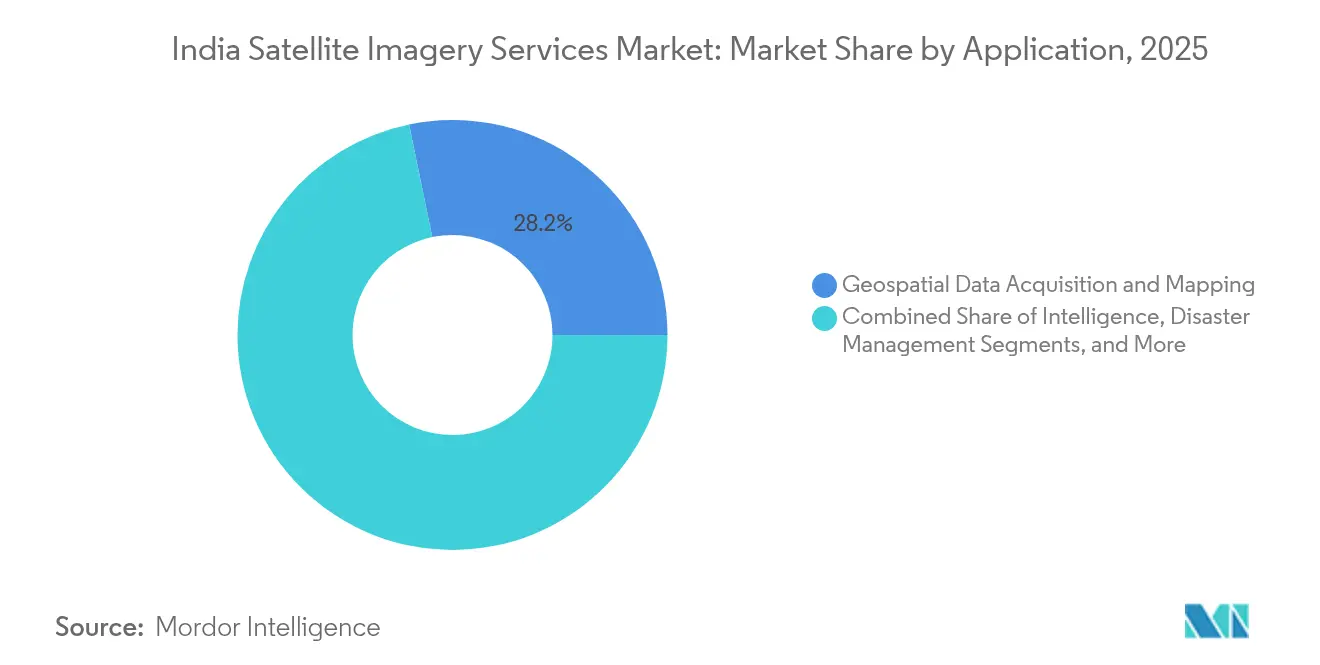
Geospatial Data Acquisition and Mapping commanded 28.24% of 2025 revenues, mirroring the land-record modernization push and nationwide cadastral surveys. The India satellite imagery services market benefits from predictable government procurement cycles, ensuring baseline utilization for optical, SAR and LiDAR-derived products. Mandated Unique Land Parcel IDs across 620,000 villages enlarge annual demand for ortho-rectified mosaics, while rural development agencies add time-series layers for asset audits. In parallel, disaster-management authorities integrate high-refresh imagery into cyclone preparedness workflows, converting episodic projects into multiyear service agreements.
Precision Agriculture expands at a 17.6% CAGR as subsidy disbursals pivot to plot-level indicators. Satellite-enabled nutrient deficiency maps replace blanket fertilizer norms, nudging fertilizer firms to fund imagery purchases. Cooperative banks embed seasonal biomass scores into lending apps, widening the India satellite imagery services market’s rural footprint. Over time, sustained agri demand offsets mapping’s gradual maturation, diversifying revenue streams across more price-sensitive user groups while preserving high-margin analytics opportunities.


By End-User: Financial Services Disrupts Long-standing Government Primacy
Government buyers represented 41.88% of 2025 turnover, buoyed by defense, rural-development and smart-city outlays that rely on turnkey imagery bundles. Central agencies purchase statewide licenses rather than project-specific tiles, underpinning volume growth but exerting price pressure during rebids. Despite budget heft, procurement rigidity leaves white spaces open to agile private customers.
Financial Services and Insurance is on track for an 18.02% CAGR, fed by crop-yield indices, property-risk scores and real-time flood alerts. Sentinel-1-based indemnity models cut claim-settlement lags by 40%, prompting insurers to subscribe to season-long monitoring feeds. Banks extend similar analytics to mortgage portfolios, monetizing geospatial risk dashboards. As transaction-based pricing replaces capex-heavy licensing, recurring revenues deepen stickiness within the India satellite imagery services market.
By Service Type: Analytics Hold Sway as APIs Democratize Access
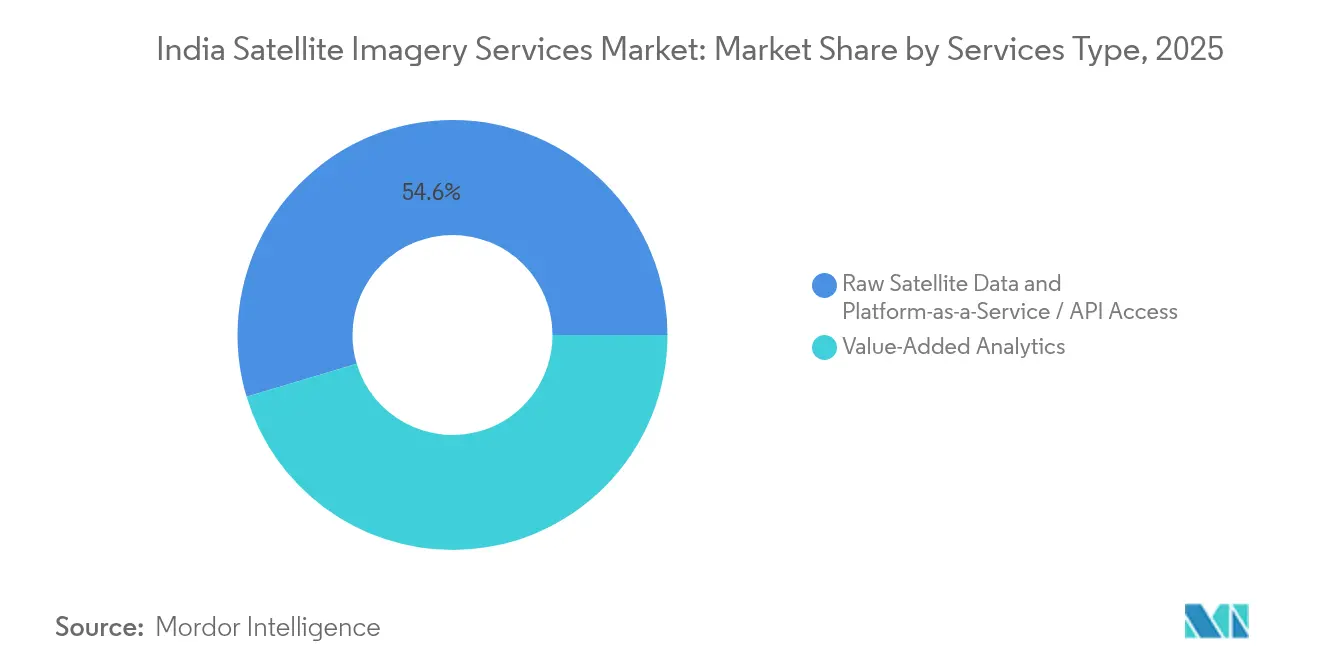
Value-Added Analytics delivered 45.36% of 2025 sales, confirming that stakeholders increasingly pay for insights rather than pixels. Defense agencies demand change-detection algorithms that flag incursions automatically, while agribusinesses prefer crop-condition scores integrated into ERP screens. Premiums accrue to vendors offering sector-specific taxonomies and pretrained models.
Platform-as-a-Service and API channels are climbing at an 18.15% CAGR. ISRO’s Bhuvan and start-up cloud stacks expose standardized endpoints, letting developers embed cadastral layers, SAR thumbnails and spectral indices directly into mobile apps. Microservices reduce data-engineering overhead, unlocking small but numerous user cohorts, from micro-finance officers to telecom tower auditors, thus broadening the India satellite imagery services market margin base.
By Imaging Type: High-Resolution Staples Face Hyperspectral Disruption
High-resolution optical (0.5–1 m) remained the workhorse with 38.12% share, essential for land-titles, utilities and transport corridor audits. Continuous price decline per square kilometer keeps utilization high even as revisit expectations rise. SAR fills all-weather gaps, now vastly improved after the 2025 NISAR launch, adding deformation and biomass metrics to monitoring suites.
Hyperspectral assets are projected to outpace all other modalities at an 17.85% CAGR. With 150+ bands, Pixxel datasets deliver material composition insights invaluable for nitrogen-stress detection and mineral prospecting. Analytics vendors integrate these cubes with machine-learning pipelines, accelerating feature extraction. The complexity drives demand for cloud-native processing, reinforcing platform growth dynamics within the India satellite imagery services market.
Geography Analysis
Northern states such as Punjab, Haryana and Uttar Pradesh spearhead precision-agri uptake, leveraging Digital Agriculture Mission subsidies to finance seasonal NDVI monitoring and pest-alert services. Consistent wheat and rice acreage offers stable recurring demand, helping vendors amortize ground-truthing costs. Rajasthan and Himachal Pradesh increasingly procure SAR-based soil-moisture data to optimize drip-irrigation scheduling, diversifying client portfolios.
Western India, led by Maharashtra and Gujarat, clusters industrial use cases around smart-city build-outs, refinery asset surveillance and port-led logistics corridors. Maharashtra’s state remote-sensing center standardizes quarterly ortho-mosaics for 36 districts, securing multi-year contracts that deepen the India satellite imagery services market. Gujarat Maritime Board now mandates SAR sweeps for oil-spill detection along 1,600 km coastline, adding subscription-based revenues.
Southern India functions as the technology incubator: Bengaluru hosts Pixxel, SatSure and Dhruva Space, while Hyderabad attracts SAR and IoT satellites. Access to ISRO’s testing facilities and an engineering talent pool sustains prototype iterations at lower cost. Tamil Nadu’s crop-insurance pilots demonstrate pay-as-you-use models, drawing insurers from Andhra Pradesh and Telangana. Start-up cluster density fuels peer-learning spillovers, accelerating time-to-market for API products.
Eastern and coastal belts emphasize disaster management. Odisha, Andhra Pradesh and West Bengal integrate cyclone-track forecasts with village-level evacuation apps, requiring 30-minute refresh optical imagery during monsoon. Assam and Arunachal Pradesh, situated on porous borders, deploy high-resolution and SAR overlays for troop movement tracking, reinforcing defense-driven demand within the India satellite imagery services market.
Regulatory Landscape
India's satellite imagery services operate under the Department of Space (DOS) and the Indian Space Policy 2023, with the Indian National Space Promotion and Authorization Centre (IN-SPACe) positioned as the single-window nodal body to authorize non-government entity (NGE) activities across satellite operations, ground systems, and dissemination of remote sensing data. Within this framework, high-resolution remote sensing dissemination is subject to IN-SPACe authorization requirements, tightening governance around sensitive datasets while still allowing private participation through a defined approval pathway.
Commercial access and pricing are also shaped by institutional roles. NewSpace India Limited (NSIL), ISRO's commercial arm, is the designated channel associated with dissemination of Indian Remote Sensing (IRS) data (including finer-resolution products), while government users access certain lower-resolution datasets on preferential terms. For service providers, the compliance focus is on authorization, security-linked handling of high-resolution imagery, and managing data-localization and multi-agency clearances that can extend contracting timelines for cross-border transfers.
Competitive Landscape
Incumbents Antrix Corporation, RMSI and Genesys International leverage established ground-station networks and government ties to win bulk data contracts. Yet newcomers Pixxel, SatSure and Dhruva Space innovate with hyperspectral sensors, analytics-first business models and agile tasking interfaces. Partnerships with global firms, BlackSky for constellation ops, Thales Alenia Space for bus manufacturing, infuse advanced capabilities, narrowing technology gaps.
Funding flows reflect confidence: Indian space-tech start-ups attracted USD 126 million in 2023, up 7% year on year. Constellation operators integrate vertically, offering imagery, analytics, and hosted payloads in a single subscription, thereby differentiating from data-only incumbents. Meanwhile, legacy firms counter by embedding AI engines; Genesys International’s tie-up with SatSure exemplifies portfolio expansion into 3D digital twins.
Regulatory mastery is a competitive wedge. Start-ups that secure early IN-SPACe approvals fast-track launches and woo foreign insurers seeking sovereign-compliant data streams. Compliance with ISO 19115 and OGC standards lowers integration friction for enterprise clients, positioning compliant vendors favorably in high-growth verticals such as financial services. Overall, competition is shifting from sensor resolution bragging rights to multi-modal, API-delivered analytics ecosystems that maximize lifetime customer value in the India satellite imagery services market.
India Satellite Imagery Services Industry Leaders
Airbus SE
Antrix Corporation Limited
Hexagon AB
RMSI Private Limited
Genesys International Corporation Limited
- *Disclaimer: Major Players sorted in no particular order

Market Opportunities and Future Outlook
A clear opportunity is forming where policy-led liberalization meets procurement pull-through. Indian Space Policy 2023 and the National Geospatial Policy 2022 emphasize domestic geospatial data production and usage, which supports city-scale digital twins and 3D urban models that fit the report's fast-growing themes around analytics and platform/API delivery. NSIL's active expression-of-interest (EOI) processes for high-resolution satellite imagery and DEM supply further point to a structured route for commercial suppliers to participate in government-linked demand and to build repeatable distribution and licensing models.
Whitespace remains for compliant high-resolution and near-real-time delivery stacks for enterprises that want sovereign-aligned data access with modern developer workflows. IN-SPACe's authorization regime around very high-resolution data makes governance and auditability a differentiator for providers offering secure processing, standardized metadata, and controlled dissemination. On the demand side, preferential access for government entities receiving sub-5 m data alongside transparent pricing for NGEs creates room for hybrid offerings, where vendors bundle paid high-resolution inputs with value-added analytics and API access for insurers, infrastructure owners, and utilities that need operational decisions rather than one-off map updates.
Recent Industry Developments
- July 2026: Dhruva Space secures Rs 60 crore investment from Antariksh Venture Capital Fund to expand satellite manufacturing and space infrastructure capacity. The investment strengthens India’s private-space manufacturing stack, enabling higher volume EO data production for surveillance and analytics services.
- December 2025: Genesys International launched a 3D subsurface mapping project for six airports operated by Adani Group, deploying 3D Ground Penetrating Radar systems integrated with high-precision LiDAR and satellite resolution inputs. The project strengthens high-margin analytics services and expands enterprise-grade geospatial offerings for airports, deepening private-sector collaboration in critical infrastructure projects.
- October 2024: Genesys International announced a partnership with SatSure to integrate 3D Digital Twin and LiDAR mapping with satellite remote sensing and AI-driven platforms. The collaboration enhances AI-enabled geospatial ecosystem capabilities and supports cross-selling across aviation, forestry, disaster management, and utilities sectors.


Research Methodology Framework and Report Scope
Market Definition and Coverage
This market covers revenues earned from providing satellite imagery and related delivery services to customers in India, including access, tasking, data delivery, and basic image-ready outputs sold on a contract or subscription basis.
Scope exclusions: It does not count satellite manufacturing, launch services, ground-station hardware, or downstream analytics-only work when imagery is not part of the commercial service delivered.
Segmentation Overview
- By Application
- Geospatial Data Acquisition and Mapping
- Natural Resource Management
- Surveillance and Security
- Conservation and Research
- Disaster Management
- Intelligence
- Urban Planning and Smart Cities
- Precision Agriculture
- By End-User
- Government
- Construction and Infrastructure
- Transportation and Logistics
- Military and Defense
- Forestry and Agriculture
- Energy and Utilities
- Financial Services and Insurance
- Other End-Users
- By Service Type
- Raw Satellite Data
- Value-Added Analytics
- Platform-as-a-Service / API Access
- By Imaging Type
- Resolution
- Very High ( less than 0.5 m)
- High (0.5–1 m)
- Medium (1–5 m)
- Low ( above 5 m)
- Spectral Modality
- Optical
- Synthetic Aperture Radar (SAR)
- Hyperspectral
- Resolution
Data Sources, Market Sizing, and Validation
Desk Research
Desk research is used to map the operating environment and to anchor assumptions on demand and supply signals that shape imagery consumption in India. We leaned on public sources such as ISRO and IN-SPACe releases, Government of India policy notes for geospatial and remote sensing, Survey of India updates, and data portals that publish agriculture, land use, and disaster statistics.
We also reviewed open technical publications and proceedings (such as IEEE and other peer-reviewed journals) to understand resolution trends, revisit cycles, and typical product formats, which helps keep the service scope practical. Company annual reports, investor decks, reputed press, and tender notices were used to capture contracting behavior and how services are packaged. Where needed, our paid subscriptions for company financials and intelligence, news and financials, patent databases, and contracts and tenders were used to fill gaps on pricing direction and deal timing. The sources listed here are illustrative, and many other public and proprietary references were also used to collect, cross-check, and clarify data points.
Primary Interviews and Surveys
Primary work focused on validating what buyers in India actually pay for, how often imagery is refreshed, and how service bundles differ by use case, before final assumptions are locked. We spoke with a mix of imagery service providers, channel partners, and large end users across areas like defense support, agriculture programs, urban planning, infrastructure monitoring, and disaster response to pressure-test volumes and ASP ranges. These inputs helped us correct desk-research gaps on procurement cycles, currency pass-through, and what is typically included in the contracted deliverable (tasking, archive pulls, or recurring feeds).
Distribution of primary research fieldwork respondents
| Company type | Respondent position | Region |
|---|---|---|
| Top tier: 38% | CXOs: 12% | |
| Mid tier: 45% | Functional/Unit leaders: 31% | |
| Smaller Players: 17% | Managers: 57% |
Market-Sizing & Forecasting
Sizing starts with a top-down build where India demand pools were reconstructed from application activity and procurement patterns, then mapped to imagery refresh frequency and the typical spend per square kilometer or per subscription package. Only after those demand signals were set did we corroborate totals using selective bottom-up checks, including a roll-up of visible service revenues where reported, sampled contract values from public tenders, and sanity checks on price-per-scene versus expected order volumes.
Key model inputs included the share of projects that require new tasking versus archive imagery, revisit expectations for programs like crop monitoring and infrastructure tracking, and resolution mix shifts that affect unit economics. We also tracked government tender cadence, and the split between one-time mapping and recurring feeds. Because pricing can shift as capacity enters the market, ASP progression was stepped using interview-led ranges and adjusted for observed contract timing rather than using a flat escalation rule.
For forecasting, scenario analysis was used, supported by a light multivariate view of drivers such as public program spending intensity, private EO capacity additions, and adoption of subscription-based access. Where bottom-up data was incomplete for smaller providers, we applied coverage factors based on interview feedback and rechecked outputs against end-user spend patterns so the final path stays realistic and repeatable.
Data Validation & Update Cycle
Outputs are validated through multiple checks, starting with internal variance reviews across applications and service types, followed by consistency checks against independent signals like tender pipelines, policy changes, and reported program rollouts. When a number looks off, the assumptions behind refresh rate, pricing, and delivery scope are revisited first, and then respondents are re-contacted to confirm whether the change is real or timing noise.
Before sign-off, the model is reviewed by another analyst to catch unit errors, double counting across service bundles, and currency conversion timing issues. Reports are refreshed annually, and interim updates are made when material events occur (for example, major policy shifts or procurement step-changes). Right before delivery, a final pass is completed so the client receives the latest aligned view based on the most recent data available.
Mordor Intelligence's India Satellite Imagery Services Market Estimate Compared With Other Published Estimates
Published market sizes for India satellite imagery services can differ because the refresh date, currency conversion month, and pricing logic behind subscriptions versus one-time tasking are not always treated the same way. Differences also show up when adjacent work is bundled in, such as analytics-only contracts or broader earth observation revenues.
A practical gap driver is how often ASPs are re-leveled using recent contract signals, because older price points can understate subscription expansion or overstate tasking-heavy work. Another driver is whether figures are built from India-only commercial revenues, or if they blend government imagery programs and multi-country provider revenues, which changes the denominator quickly. In this study, quarterly checks on tender outcomes and deal timing were used to refresh currency and ASP assumptions before locking the 2025 base year, which is where Mordor Intelligence can diverge from estimates that rely on older exchange rates or constant price ladders.
Benchmark comparison
| Source | Market Size | Gaps in Research Methodology |
|---|---|---|
| Mordor Intelligence | USD 0.33 B (2025) | |
| Regional Consultancy A | USD 0.24 B (2023) | Uses an earlier base year and appears to rely on historical service revenues without fully capturing the newer shift toward recurring subscription feeds and higher revisit requirements. |
| Industry Association B | USD 0.29 B (2024) | Likely blends a wider earth observation revenue pool and applies simplified currency timing, which can move India values noticeably when contracts are billed across different months. |
The table shows that timing and scope choices explain most of the spread, not just different growth views. When refresh cadence, currency month, and subscription versus tasking pricing are treated consistently, the resulting market value becomes easier to trace back to clear demand and spend drivers, and then to update in a repeatable way.


Key Questions Answered in the Report
What is the current size of the India satellite imagery services market?
The market stands at USD 386.5 million in 2026 and is forecast to reach USD 851.8 million by 2031.
Which application segment grows fastest within Indian satellite imaging?
Precision Agriculture posts a 17.6% CAGR through 2031, fueled by subsidy-linked crop monitoring.
How quickly are financial institutions adopting satellite imagery?
Financial services and insurance users exhibit an 18.02% CAGR, leveraging imagery for risk scoring and claims.
What technology will drive the next growth wave?
Hyperspectral imaging, expanding at an 17.85% CAGR, enables material-level analytics that unlock new use cases.
How concentrated is competition?
The top five firms capture just over 60% of revenue, yielding a moderate score of 6 on a 1–10 concentration scale.
Page last updated on:






