
India Satellite Communication Market Size and Share
Market Overview
| Study Period | 2020 - 2031 |
|---|---|
| Forecast Data Period | 2026 - 2031 |
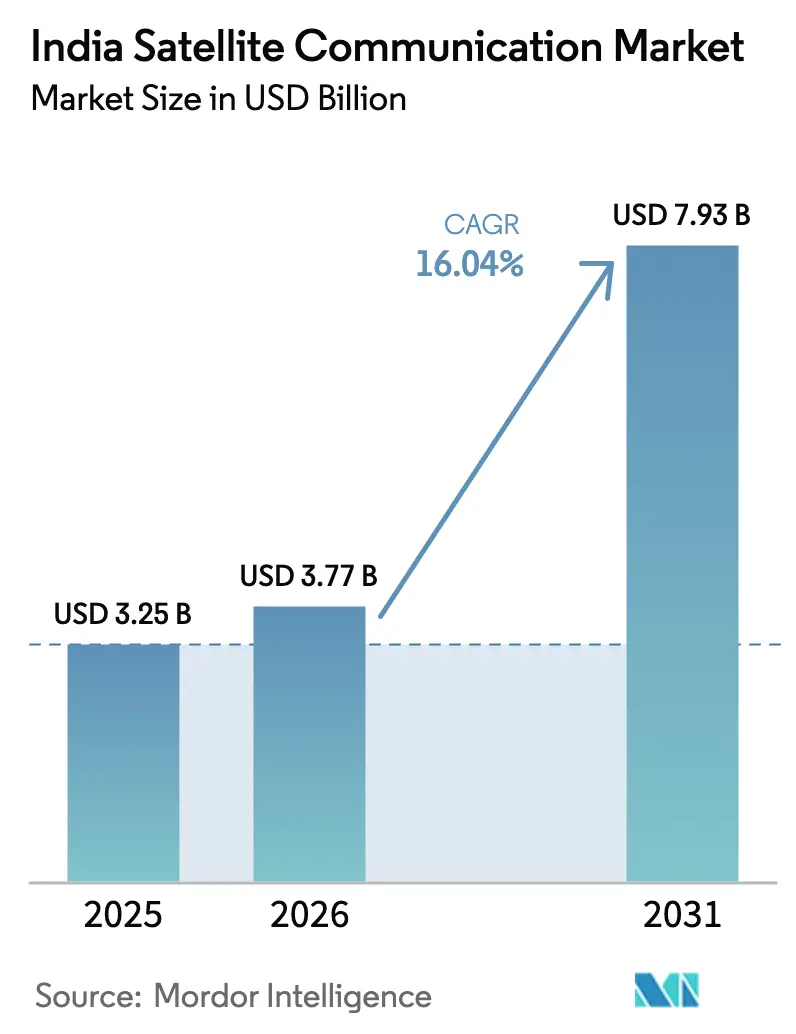
| Base Year Market Size (2025) | USD 3.25 Billion |
| Market Size (2026) | USD 3.77 Billion |
| Market Size (2031) | USD 7.93 Billion |
| Growth Rate (2026 - 2031) | 16.04 % |
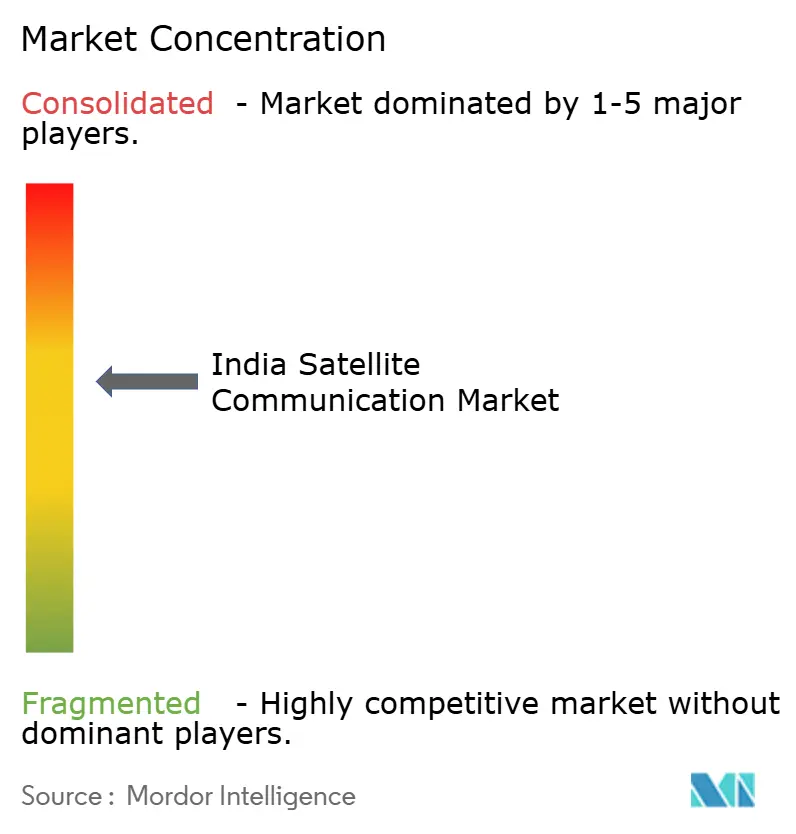
| Market Concentration | Medium |
Major Players *Disclaimer: Major Players sorted in no particular order Image © Mordor Intelligence. Reuse requires attribution under CC BY 4.0. | |
India Satellite Communication Market Analysis by Mordor Intelligence
The India's satellite communication market size is expected to grow from USD 3.25 billion in 2025 to USD 3.77 billion in 2026 and is forecast to reach USD 7.93 billion by 2031 at 16.04% CAGR over 2026-2031. Accelerated growth reflects sustained government investments in rural broadband, rising defense bandwidth needs, and surging demand for video streaming resiliency. Enterprise VSATs underpin banking, retail, and energy operations, while direct-to-device (D2D) concepts promise fresh revenue streams once spectrum approvals materialize. Intensifying competition from global LEO constellations is pushing incumbents toward software-defined networking and hybrid GEO-LEO offerings that lower latency and boost throughput. At the same time, stepped-up security rules and spectrum usage charges tighten margins, compelling operators to pursue high-value managed services and turnkey solutions.
Key Report Takeaways
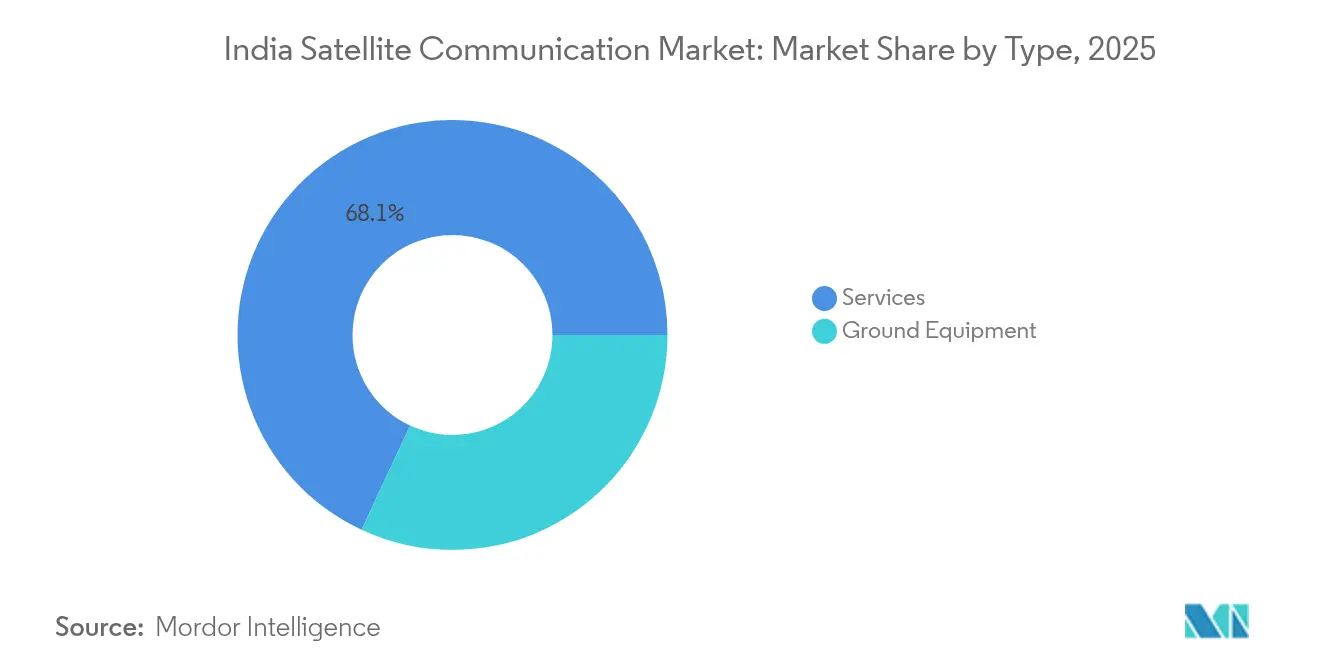
- By type, Services captured 68.05% of India's satellite communication market share in 2025 and are expanding at a 16.72% CAGR through 2031, outpacing all other categories.
- By platform, Airborne platforms are forecast to post the fastest 17.05% CAGR between 2026-2031, while land platforms retained 58.85% revenue share of India's satellite communication market in 2025.
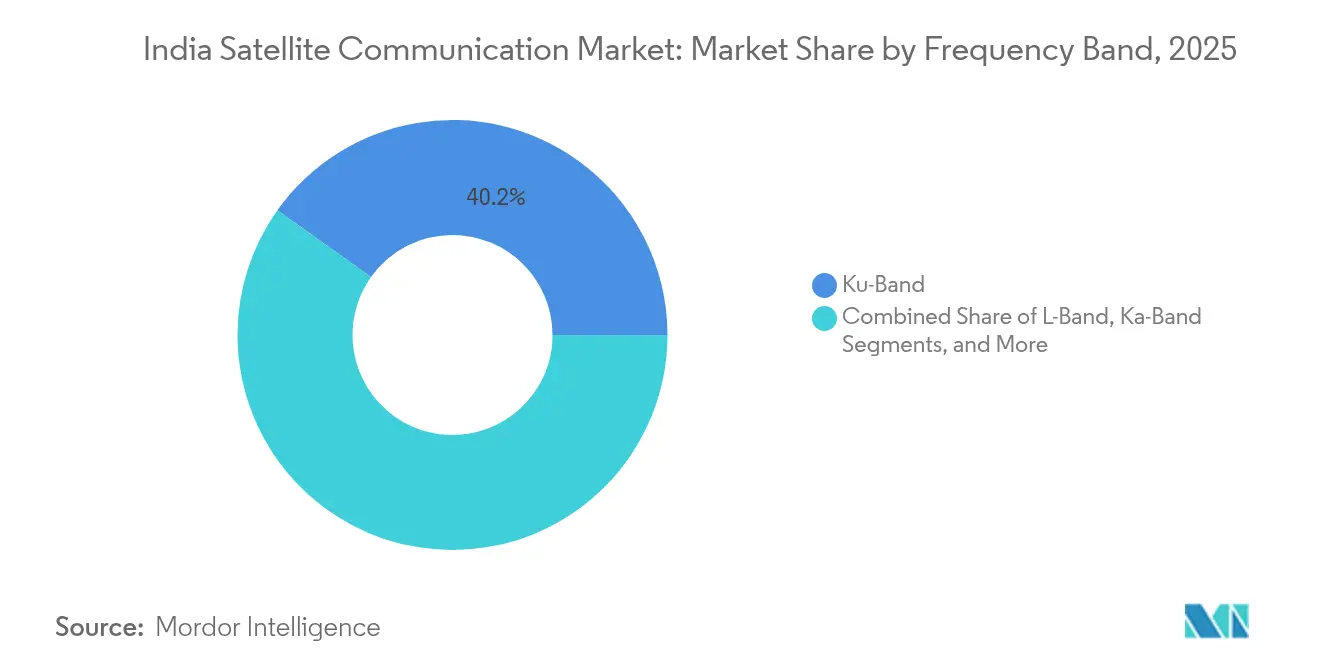
- By frequency band, Ku-band held 40.15% share of India satellite communication market size in 2025; Ka-band is poised to grow at 17.28% CAGR to 2031 on the back of GSAT-20’s 48 Gbps capacity.
- By end-user vertical, Defense and government users commanded 36.78% of the India satellite communication market share in 2025, whereas media and entertainment lead future growth at a 16.96% CAGR.
- By region, South India accounted for 33.85% of India's satellite communication market revenue in 2025; East and North-East India will advance the fastest at 17.12% CAGR through 2031.
Note: Market size and forecast figures in this report are generated using Mordor Intelligence’s proprietary estimation framework, updated with the latest available data and insights as of 2026.
Market Trends and Insights
Drivers Impact Analysis of India Satellite Communication Market*
| Driver | (~) % Impact on CAGR Forecast | Geographic Relevance | Impact Timeline |
|---|---|---|---|
| BharatNet 3.0 and Digital India broadband roll-outs | +3.2% | National (rural focus) | Long term (≥ 4 years) |
| OTT/video traffic explosion | +2.8% | Urban and Tier-2/3 cities | Medium term (2-4 years) |
| Defense modernization programs | +2.4% | Border and coastal zones | Long term (≥ 4 years) |
| Mass-scale IoT/M2M deployments | +2.1% | Agricultural belts, utilities | Medium term (2-4 years) |
| Direct-to-Device satellite services | +1.9% | Remote low-coverage areas | Medium term (2-4 years) |
| ISRO small-sat launchers | +1.7% | Nationwide | Long term (≥ 4 years) |
| Source: Mordor Intelligence | |||
Government-Led BharatNet and Digital India Broadband Roll-Outs
Massive public-sector funding anchors long-term demand. BharatNet 3.0 allocates INR 1.39 lakh crore (USD 16.8 billion) to connect 250 million rural residents, funneling satellite backhaul orders to cover terrain where fiber is infeasible. [1] The 5G Intelligent Village pilot in ten states calls for 1 Gbps satellite links with scalable 10 Gbps pathways, positioning satellites as equal partners to terrestrial networks rather than fallback options. Secure gateways mandated by data-localization rules further stimulate domestic ground-segment investments. Together, these policies provide operators with predictable multi-year revenue and underpin the continued expansion of the India satellite communication market.
OTT/Video Traffic Explosion Boosting Satellite Bandwidth Demand
Peak-time video streaming routinely saturates terrestrial backbones. During IPL 2025, concurrent viewership exceeded 32 million, sending spillover traffic to satellite capacity leases. [2] High-definition 4K and HDR formats multiply per-user data rates, prompting broadcasters to reserve Ka-band beams on GSAT-20 for edge caching in Tier-2 cities. Long-term contracts signed by major streaming platforms create stable utilization rates that lift average revenue per megahertz and enhance the profitability of the India satellite communication market.
Defense and Homeland-Security Modernization Programs
The Indian Army’s Satellite-Based Surveillance (SBS-3) roadmap envisions 52 satellites by 2029, ensuring secure command-and-control across remote theaters. Border outposts now incorporate L-band terminals that ride through jamming episodes, while naval units leverage Ku-band maritime VSATs for real-time ISR feeds. Domestic NewSpace firms like Dhruva Space gain from indigenization mandates that require local bus design and integration facilities in Bengaluru and Hyderabad, broadening the supplier base and reducing import dependence.
Mass-Scale IoT/M2M Roll-Outs in Agriculture and Utilities
Satellite IoT links are projected to grow from 3.6 million to 41 million connections by 2030, powered by precision farming, smart grids, and pipeline monitoring. Heimdall Power’s sensors using Iridium Certus modems already raise transmission-line capacity by 40%, cutting blackout risks. Hybrid LoRa-satellite architectures pioneered by Tata Communications seamlessly switch between cellular and satellite footprints, offering ubiquitous coverage at optimized cost.
Restraints Impact Analysis of India Satellite Communication Market*
| Restraint | (~) % Impact on CAGR Forecast | Geographic Relevance | Impact Timeline |
|---|---|---|---|
| Cyber-intrusion and jamming vulnerabilities | -1.8% | Border zones, metros | Short term (≤ 2 years) |
| High CAPEX for gateways/VSAT and spectrum fees | -2.3% | Nationwide | Medium term (2-4 years) |
| Spectrum-allocation delays and regulatory ambiguity | -1.6% | National | Short term (≤ 2 years) |
| New debris-mitigation rules raising costs | -1.2% | Global | Long term (≥ 4 years) |
| Source: Mordor Intelligence | |||
Cyber-Intrusion and Jamming Vulnerabilities
Security audits of NavIC exposed spoofing risks that threaten both civilian logistics and military navigation. Electronic warfare incidents near sensitive borders highlight potential service blackouts, prompting TRAI to mandate end-to-end encryption and two-factor terminal authentication. Compliance adds latency to deployment cycles and inflates opex, moderating near-term uptake.
High CAPEX for Gateways/VSAT and Spectrum Fees
Gateway build-outs run USD 10–50 million each, while spectrum usage charges hover near 3% of adjusted gross revenue, eroding ROI for new entrants. Despite falling VSAT prices, payback periods stretch to seven years for rural tele-education projects, dampening appetite among smaller integrators.
*Our forecasts treat driver/restraint impacts as directional, not additive. The impact forecasts reflect baseline growth, mix effects, and variable interactions.
India Satellite Communication Market Segment Analysis
By Type:
Services Drive Market EvolutionServices commanded 68.05% of 2025 revenue as enterprises favored turnkey bandwidth and network-management contracts over owning hardware. India's satellite communication market size for services is projected to climb at a 16.72% CAGR, fueled by long-term VSAT outsourcing deals in banking and energy. Banks rely on 70,000+ Hughes VSATs for ATM uptime, illustrating how managed capacity assures regulatory service-level targets. OTT platforms and telecoms likewise lease backup Ka-band beams to guarantee 99.9% availability during marquee events.
Ground equipment retained a 31.95% share, yet the category is migrating toward software-defined gateways that remotely re-point beams and load-balance traffic. India's satellite communication market share for equipment suppliers could slide as operators prefer opex-light models, but vendors offset the shift by bundling security, analytics, and orchestration software that deepens integration stickiness.

By Platform:
Land Dominance Meets Airborne InnovationLand platforms held 58.85% revenue in 2025, supported by BSNL’s satellite backhaul roll-outs across 3,500 4G towers in North India. India's satellite communication market size for land-based links will continue growing as state agencies digitize public-service delivery across Panchayats. Portable terminals serve disaster-relief agencies and TV newsgathering units that need high mobility and quick setup.
Airborne systems will grow fastest at 17.05% CAGR as airlines retrofit fleets with Ka-band IFC to meet passenger expectations for streaming video. The Indian Air Force’s iDEX-funded mini-satellites enable beyond-line-of-sight control of UAV swarms, showcasing new high-throughput use cases. Equipment vendors now tailor electronically steered phased-array antennas that fit small fuselage footprints, removing installation hurdles.
By Frequency Band:
Ku-Band Legacy Meets Ka-Band InnovationKu-band maintains leadership with a 40.15% share owing to the entrenched VSAT base and lower migration costs. Disaster-relief authority NDMA keeps Ku-band sets on standby because of their rain-fade resilience, a critical factor during the monsoon season.
However, India's satellite communication market size for Ka-band capacity will escalate rapidly thanks to GSAT-20’s 48 Gbps payload and 32 spot beams. Smaller dish size and higher throughput make Ka-band attractive for residential broadband and in-flight connectivity, though operators must deploy adaptive modulation to counter rainfall attenuation in coastal belts.
By End-User Vertical:
Defense Leadership Amid Media SurgeDefense and government agencies contributed 36.78% of 2025 revenue, cementing their position as anchor tenants for secure bandwidth leases. Ministry of Home Affairs integrated satellite links into border outposts to maintain resilient communications during fiber cuts.
Yet media and entertainment, propelled by OTT expansion, will log the highest 16.96% CAGR as broadcasters secure overflow capacity for live sports streams. Agricultural IoT and smart-grid utilities follow closely, diversifying demand across economic cycles.
Geography Analysis
South India’s 33.85% revenue share stems from a dense supplier ecosystem anchored by ISRO headquarters and private manufacturers like Dhruva Space, which jointly advance component localization. Ports across Tamil Nadu and Kerala use GEO and LEO hybrid terminals to track cargo, while tech firms in Bengaluru demand redundant Ka-band connectivity for cloud workloads. The presence of satellite control centers and skilled aerospace talent sustains innovation and quickens new-service adoption.
West India hosts extensive VSAT deployments supporting Mumbai’s banking sector, where 30,000+ branches and 40,000 ATMs rely on always-on connectivity for real-time settlement. Gujarat’s industrial corridors tap satellite IoT to manage energy pipelines and solar farms across vast desert stretches. Ship-to-shore links at JNPT and Kandla port are now trial multi-orbit services to cut latency for real-time crane operations.
East and North-East India will record the fastest gains at 17.12% CAGR as the government accelerates road, rail, and telecom projects in hilly and border districts. BSNL’s satellite backhaul fills last-mile gaps, while the defense establishment outfits forward posts with secure X-band terminals. Agrarian states in the Indo-Gangetic plain adopt satellite-enabled precision irrigation, using C-band links to mitigate monsoon interference.
Regulatory Landscape
India's satcom regulation is being recast under the Telecommunications Act, 2023, shifting the sector from legacy licensing to an authorization-led framework administered by the Department of Telecommunications (DoT) and implemented through the Wireless Planning and Coordination (WPC) wing for spectrum-related permissions. TRAI added near-term direction through its April 8, 2026 consultation paper on a framework for Satellite Communication Network (SCN) authorization and spectrum assignment, which brought gateway and space-segment authorization, spectrum approach, and compliance sequencing into public comment. Indian Space Policy, 2023, and the Indian National Space Promotion and Authorisation Centre (IN-SPACe) continue to shape market entry for satellite networks and associated ground infrastructure alongside telecom regulation.
A defining compliance feature is the layering of security approvals alongside spectrum processes. In 2026 draft satcom spectrum rules, service providers would require an explicit security clearance even after administrative spectrum assignment, before offering consumer services. Spectrum usage charges also remain a key variable, with a DoT proposal discussed publicly around a 5% adjusted gross revenue (AGR) usage fee that diverges from TRAI's earlier 4% recommendation. Together with mandatory WPC approvals, these measures raise the execution burden for LEO/GEO operators and resellers, while favoring players that can localize gateways, meet data and security requirements, and run compliant managed services at scale.
Value Chain Analysis
The India satcom value chain starts with satellite capacity and payload access, drawing on domestic ISRO assets and international GEO/LEO constellations. It then moves through network authorization and spectrum processes overseen by DoT/WPC and IN-SPACe, followed by ground-segment buildout, including gateways, teleport infrastructure, network operation centers, and customer terminals such as VSATs, maritime and airborne antennas, and portable kits. Platform and solution providers integrate capacity with modems, phased-array/ESAs where applicable, cybersecurity layers, and software-defined networking to deliver fixed and mobile satellite services. This integration is becoming central as operators bundle hybrid GEO-LEO resilience and managed service-level agreements for banking, energy, media contribution, and government networks.
Downstream, distribution and service delivery are handled by telecom operators and satcom specialists, including Bharti Airtel/OneWeb India, Jio Satellite Communications, Hughes Communications India, Nelco, and Tata Communications. These players contract capacity, establish Indian gateways to satisfy localization and security requirements, and provide installation, field support, and managed operations. Enterprise and government procurement anchors utilization across defense, public-sector connectivity, and BharatNet-linked backhaul. Ecosystem enablers include domestic NewSpace firms and system integrators supplying terminals, integration, and analytics. High gateway capex and recurring spectrum and security compliance shift value toward shared infrastructure, partnerships with global constellations, and scalable managed-services delivery rather than standalone equipment sales.
Competitive Landscape
The market is moderately concentrated, with the top five players accounting for roughly 55% of 2024 revenue. Hughes Communications India leverages its 70,000-terminal VSAT network and manages centralized network operations centers that small rivals struggle to match. Bharti Airtel deepened integration by securing 100% ownership of OneWeb India and signing distribution rights with SpaceX Starlink, hedging its portfolio with both GEO and LEO capacity. [4] Jio entered a similar Starlink pact and is piloting D2D messaging that may broaden its rural footprint once spectrum clearances are finalized.
Foreign operators pursue local gateways to satisfy data-localization rules. Eutelsat OneWeb is completing two Ka-band gateways in Gujarat and Tamil Nadu, while SES seeks JV arrangements to avoid capex duplication. Domestic NewSpace firms target niche constellations: Pixxel focuses on hyperspectral imaging, Astrome on flat-panel antennas, and SatSure on analytics, each aiming for bundled data-connectivity packages that increase switching costs for enterprise clients.
Strategic alliances dominate recent maneuvers. Thales Alenia Space inked a contract with NIBE for a private EO constellation that will ride SSLV, signaling French suppliers’ commitment to Make-in-India frameworks. Meanwhile, gateway equipment providers such as ST Engineering iDirect partner with TCS for software-defined network orchestration, reflecting rising demand for virtualized ground segments.
India Satellite Communication Industry Leaders
-
Jio Satellite Communications Ltd.
-
Hughes Communications India Ltd.
-
Bharti Airtel Limited
-
Tata Communications Limited
-
Nelco Limited
- *Disclaimer: Major Players sorted in no particular order
India Satellite Communication Market Companies Covered in this Report
- Jio Satellite Communications Ltd.
- Hughes Communications India Ltd.
- Bharti Airtel Limited (incl. OneWeb India)
- Tata Communications Limited
- Nelco Limited
- ViaSat Inc.
- Thales Group
- ORBCOMM Inc.
- Precision Electronics Limited
- Avantel Limited
- Astrome Technologies Private Limited
- Dhruva Space Private Limited
- Pixxel Space Technologies Pvt. Ltd.
- Skylo Technologies, Inc.
- SES S.A.
- Inmarsat Global Limited
- Intelsat US LLC
- Eutelsat Group
- Antrix Corporation Limited
- NewSpace India Limited
- Kacific Broadband Satellites Group
- Larsen & Toubro Limited (Defence VSAT)
Market Opportunities and Future Outlook
A primary whitespace is in scaled LEO-led broadband and mobility services under a clearer authorization and administrative spectrum-assignment regime, provided operators can clear the added security-approval layer in the 2026 draft spectrum rules. Evidence of competitive build-up includes IN-SPACe completing technical evaluation of Reliance Jio's proposal for a roughly 1,600-satellite LEO constellation. At the same time, global LEO capacity is entering through partnerships and distribution arrangements, including Bharti Airtel's Starlink agreement and Nelco's LEO connectivity agreement with Eutelsat/OneWeb infrastructure. This mix of sovereign-constellation planning and multi-constellation partnerships creates room for differentiated offers in low-latency enterprise access, maritime and airborne connectivity, and managed backup for terrestrial outages, particularly where fiber buildout is slow or vulnerable.
Opportunities also exist in ground-segment localization and secure managed services. The regulatory direction tightens requirements around authorization, security clearances, and WPC permissions, which increases demand for compliant gateways, network orchestration, and end-to-end monitoring delivered as a service. East and North-East India, along with hard-to-reach geographies such as Ladakh, represent addressable gaps for satellite backhaul and public-service connectivity, aligning with Digital India programs and defense-led resilient communications. Direct-to-device and IoT/M2M services remain constrained by spectrum and authorization mechanics, but TRAI's April 2026 consultation and operator-led trials keep commercialization pathways open for messaging and low-bandwidth sensor connectivity as rules and clearances are finalized.
Recent Industry Developments in India Satellite Communication Market
- July 2026: IN-SPACe completed technical evaluation of Jio's proposal to deploy approximately 1,600 LEO satellites, deeming the architecture technically sound and able to coexist with other constellations. The assessment highlights Jio's potential to scale LEO capacity within the Indian market. The result strengthens Jio's competitive position in sovereign-space infrastructure and could influence downstream demand for ground services and regulatory coordination.
- August 2025: Nelco signed a strategic agreement with Eutelsat to offer LEO connectivity services across India, leveraging OneWeb India Communications infrastructure. The collaboration expands domestic LEO capability and provides enterprise customers with alternative capacity. This move reinforces Nelco's role in the evolving Indian satellite connectivity ecosystem and broadens the choice for bandwidth-sensitive applications.
- March 2025: Bharti Airtel Limited, Airtel announced a partnership with SpaceX to bring Starlink high-speed satellite internet to its customers in India, subject to regulatory approvals. The partnership enables Airtel to offer Starlink services to customers once approvals are in place. This accelerates broadband reach via satellite and expands Airtel's multi-constellation strategy.
India Satellite Communication Market Report Scope and Research Methodology
Market Definition and Coverage
This market is defined as revenues earned in India from delivering communication services through satellites and the related ground infrastructure that enables connectivity, broadcast, and data links for commercial and government users.
Scope exclusions: This sizing excludes non-communication satellite activities such as earth observation payload data sales and navigation services that do not primarily deliver satcom connectivity.
Segments Covered in This Report
- By Type
- Ground Equipment
- Gateway
- Very Small Aperture Terminal (VSAT)
- Network Operation Centre (NOC)
- Satellite News Gathering (SNG)
- Services
- Mobile Satellite Services (MSS)
- Fixed Satellite Services (FSS)
- Earth-Observation Services
- Ground Equipment
- By Platform
- Portable
- Land
- Maritime
- Airborne
- By Frequency Band
- L-Band
- S-Band
- C-Band
- X-Band
- Ku-Band
- Ka-Band
- By End-user Vertical
- Defence and Government
- Maritime
- Enterprises
- Media and Entertainment
- Agriculture and Environmental Monitoring
- Other End-user Verticals
- By Region
- North India
- West India
- South India
- East and North-East India
- Central India
Data Sources, Market Sizing, and Validation
Desk Research
Desk research is used to set the factual base for India satcom, so the model starts from verifiable demand signals and operating constraints rather than only stated company aspirations. We leaned on public and official references such as Wireless Planning and Coordination wing notifications, Telecom Regulatory Authority of India releases, Department of Telecommunications policy notes, and Indian Space Research Organization and IN-SPACe publications to understand licensing, spectrum, and program timelines.
To convert those signals into workable sizing inputs, we also reviewed materials such as annual reports and investor presentations, audited financial statements, and credible press reporting on launches, capacity additions, and service rollouts. Where needed, we used paid subscriptions for company financials and intelligence, patent databases, and shipment-level import and export checks for satcom equipment to sanity test volume trends. These desk sources are not exhaustive, and additional references were used during data collection, validation, and clarification.
Primary Interviews and Surveys
Primary work is used to pressure test the desk assumptions and translate policy and capacity headlines into usable pricing and utilization ranges. We spoke with a mix of satellite operators, service providers, integrators, and large user organizations to validate how bandwidth is purchased, which service bundles are common, and what drives churn and contract renewals.
To make sure the India view was not skewed toward one buyer group, the coverage was balanced across government and defense use, enterprise VSAT networks, mobility links, and media and broadcast workloads. Inputs were then reconciled back into a single India market model so coverage does not over-weight any one segment.
Distribution of primary research fieldwork respondents
| Company type | Respondent position |
|---|---|
| Top tier: 29% | CXOs: 12% |
| Mid tier: 57% | Functional/Unit leaders: 41% |
| Smaller Players: 14% | Managers: 47% |
Market-Sizing & Forecasting
Sizing starts with a top-down build where demand pools are reconstructed from India-specific satcom service usage, active terminal base patterns, and capacity availability, and then translated into revenue using realistic price ranges by service class. In parallel, selective bottom-up checks are used to validate the totals, such as sampled ASP times volume for VSAT terminals and equipment, plus supplier and channel checks on installation activity to adjust any overstatements.
Key inputs that influenced the model include active VSAT and enterprise site counts, leased bandwidth and transponder capacity utilization, frequency band mix shifts (C, Ku, Ka), adoption of high-throughput satellite services, and the pace of regulatory clearances and spectrum assignments that can gate new demand. Since pricing can move quickly when capacity changes, we tracked ASP progression carefully and stress tested it with interview feedback before locking the base case.
For forecasting, scenario analysis was used around a central case because near-term outcomes in India are sensitive to policy timing, constellation availability, and enterprise rollout speed. Where data series were stable enough, simple trend fitting was applied to supporting indicators, and gaps in bottom-up evidence were handled with conservative penetration rates cross-checked with multiple respondents.
Data Validation & Update Cycle
Validation is done through multiple checks so the final numbers stay aligned to real market behavior. We compared outputs against independent signals like reported connectivity programs, equipment import trends, stated capacity additions, and observable demand from key satcom use cases, and then investigated outliers before sign-off.
If a variance is large, assumptions are revisited and the relevant experts are re-contacted, especially for pricing, utilization, and policy gating factors. Reports are refreshed annually, with interim updates when material events occur, and a final pre-delivery review is completed so clients receive the latest updated view.
Mordor Intelligence's India Satellite Communication Market Size Compared With Other Published Estimates
Published estimates for India satcom often differ because analysts do not always count the same revenue streams, and because the timing of policy driven rollouts changes the near-term base year quickly. Differences also show up when one estimate leans heavily on announced capacity plans, while another relies more on realized service revenues and contracted utilization.
The biggest gap drivers in this market are usually whether only satcom service revenues are counted or if adjacent equipment and integration revenues are bundled in, how high-throughput satellite pricing is projected to move, and whether direct-to-device expectations are treated as near-term or pushed out. Some figures also use older currency timing and do not re-check assumptions after new licensing or spectrum steps, which can make the base year look smaller or larger than what the demand pool supports. This spread is reduced when utilization and service pricing are revalidated close to publication in the approach applied by Mordor Intelligence.
Benchmark comparison
| Source | Market Size | Gaps in Research Methodology |
|---|---|---|
| Mordor Intelligence | USD 3.25 B (2025) | |
| Industry Advisory A | USD 2.50 B (2024) | Uses an earlier base year and appears to emphasize current realized deployments, which can undercount pipeline-led growth and the pricing uplift from newer HTS capacity. |
| Business Daily B | USD 2.30 B (2025) | Often reported as a headline market value tied to news narratives, with limited transparency on included revenue lines, currency timing, and whether broadcast and enterprise networks are consistently captured. |
The table shows that the spread is mainly explained by base year choice, scope of revenues included, and how quickly pricing and utilization are updated after policy and capacity changes. By keeping the model tied to observable demand pools and re-checking pricing and utilization with field inputs, the resulting value stays traceable to clear variables and can be repeated with the same steps.
Key Questions Answered in the Report
What is the current value of India satellite communication market?
It is valued at USD 3.77 billion in 2026 with projections reaching USD 7.93 billion by 2031.
Which segment holds the largest India satellite communication market share?
Services dominate with 68.05% revenue in 2025, reflecting the preference for managed connectivity solutions.
How fast is Ka-band growing in India’s satcom space?
Ka-band capacity is forecast to rise at a 17.28% CAGR through 2031, driven by high-throughput satellites like GSAT-20.
Which region is expanding the quickest in satellite connectivity?
East and North-East India are projected to grow at 17.12% CAGR, benefiting from border infrastructure projects and tough terrain.
What factor poses the biggest capital hurdle for new entrants?
High gateway and VSAT capex, compounded by spectrum usage fees, lengthens payback periods and limits small-operator entry.
How are telecom operators integrating satellite services?
Companies like Bharti Airtel and Jio are partnering with Starlink and OneWeb to blend GEO and LEO capacity into their fixed-wireless and fiber portfolios.