
Market Overview
| Study Period | 2020 - 2031 |
|---|---|
| Forecast Data Period | 2026 - 2031 |
| Base Year Market Size (2025) | USD 14.28 Billion |
| Market Size (2026) | USD 15.17 Billion |
| Market Size (2031) | USD 20.53 Billion |
| Growth Rate (2026 - 2031) | 6.24 % |
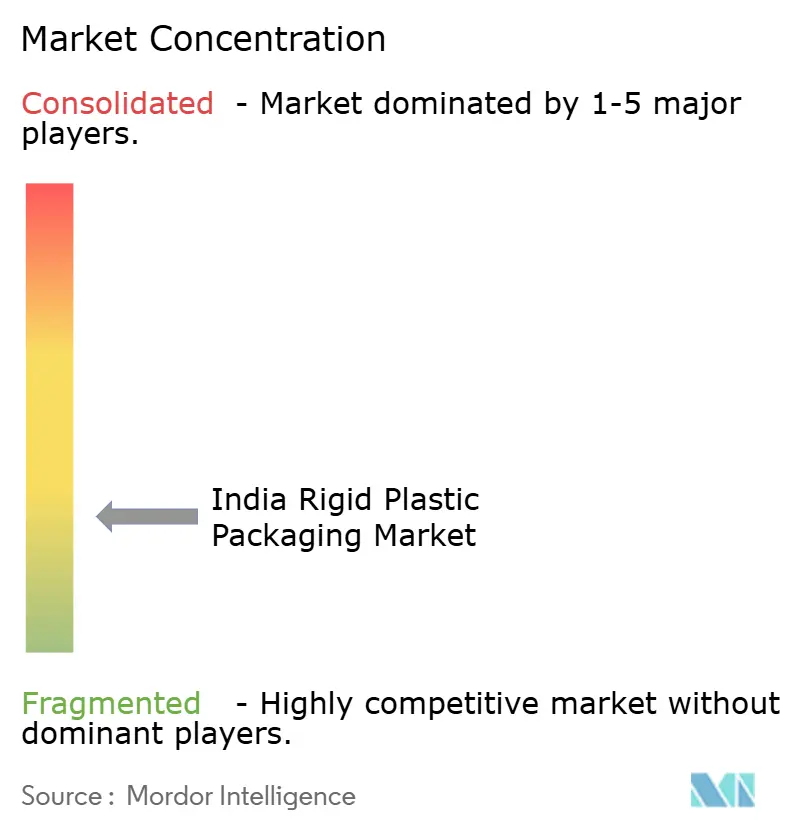
| Market Concentration | Low |
Major Players *Disclaimer: Major Players sorted in no particular order Image © Mordor Intelligence. Reuse requires attribution under CC BY 4.0. | |
India Rigid Plastic Packaging Market Analysis by Mordor Intelligence
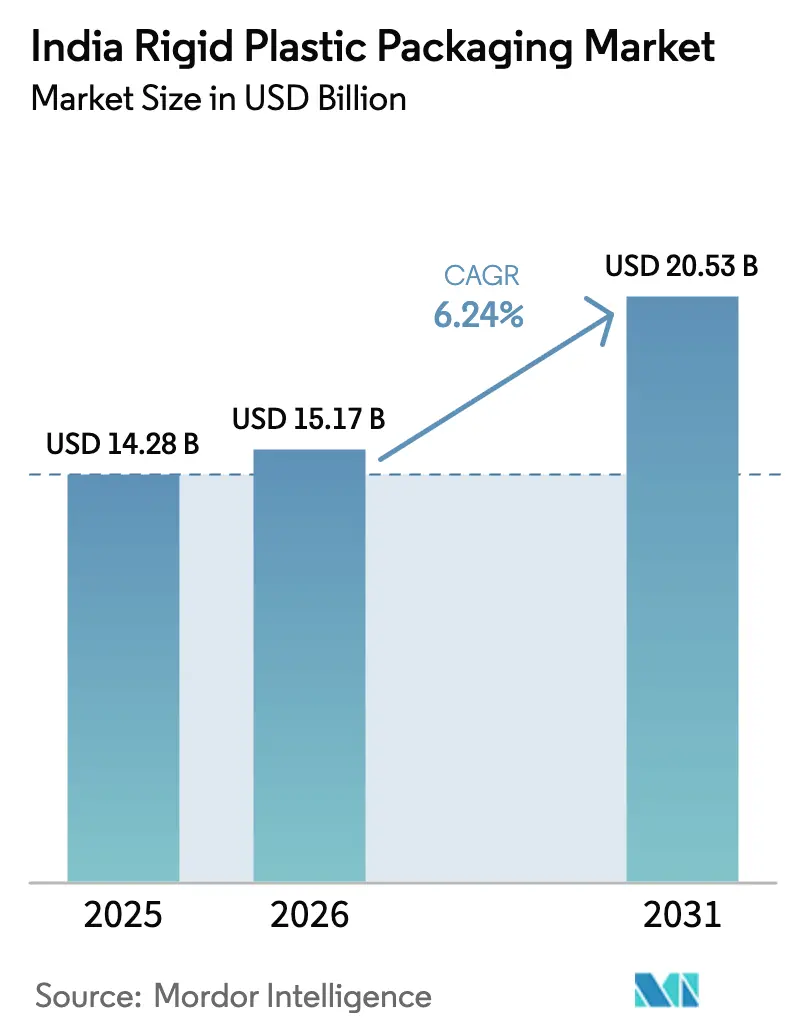
The India rigid plastic packaging market size is expected to grow from USD 14.28 billion in 2025 to USD 15.17 billion in 2026 and is forecast to reach USD 20.53 billion by 2031 at 6.24% CAGR over 2026-2031. Robust dairy output, rapid cold-chain roll-out, and policy-induced demand for ethanol fuel containers underpin steady volume gains. Brand owners are shifting toward packaging that meets recycled-content thresholds, while converters invest in advanced extrusion and injection lines to control unit costs. Tight margins caused by polypropylene price swings are accelerating resin substitution toward rPET where collection infrastructure permits. Strategic acquisitions signal rising consolidation as financial sponsors target scale and specialty capabilities inside the India rigid plastic packaging market.
Key Report Takeaways
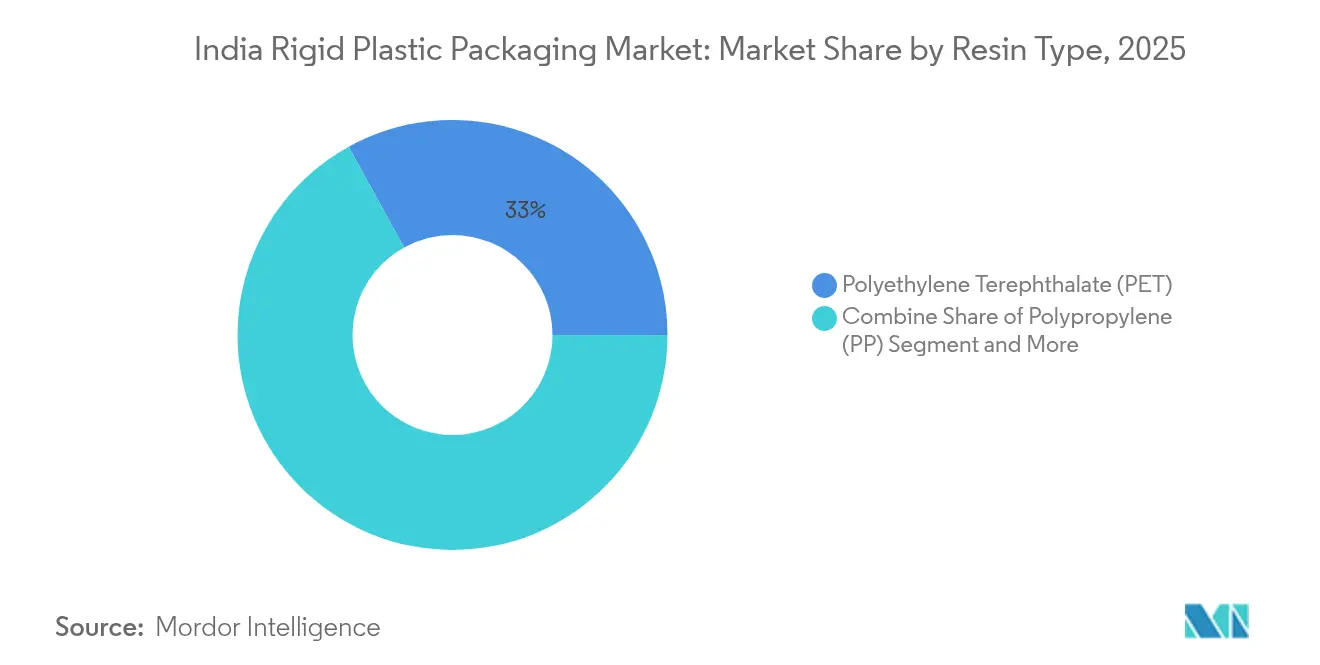
- By resin type, Polyethylene Terephthalate led with 33.02% of the India rigid plastic packaging market share in 2025, whereas Polypropylene is projected to post the fastest 7.42% CAGR through 2031.
- By product type, Bottles & Jars accounted for 35.31% revenue share in 2025; Trays & Containers are expected to expand at a 6.71% CAGR between 2026-2031.
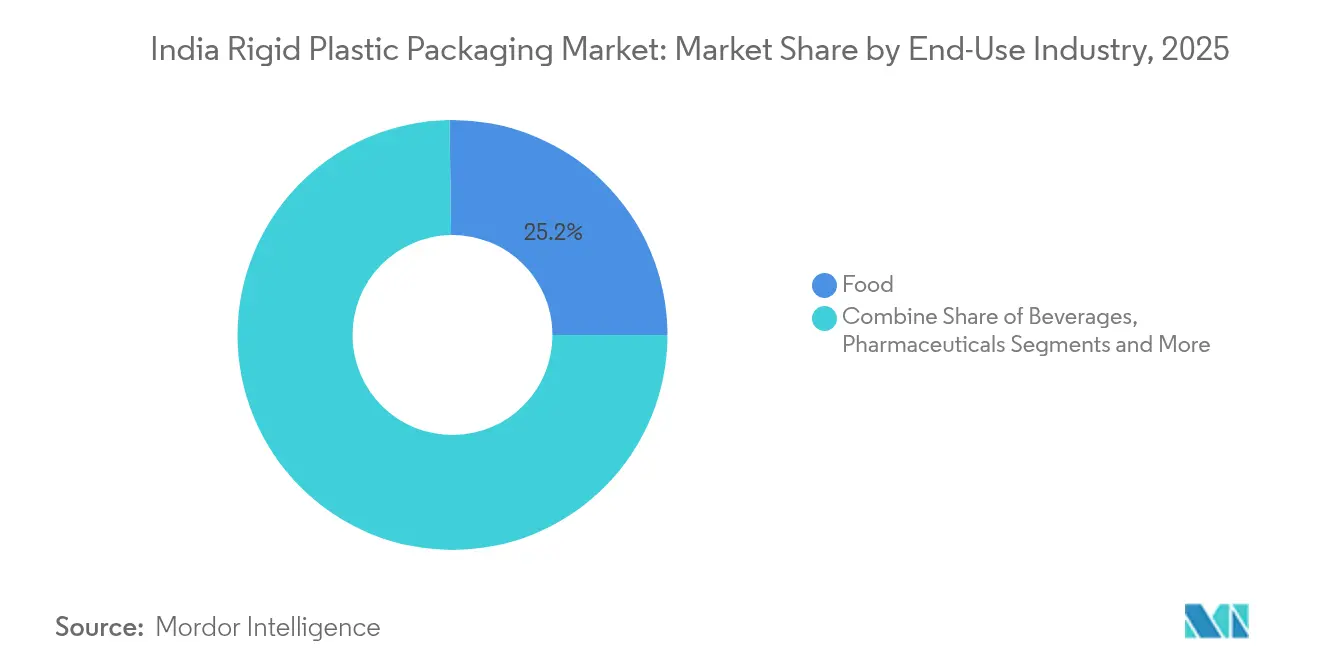
- By end-use industry, the Food segment retained 25.22% share of the India rigid plastic packaging market size in 2025, while Pharmaceuticals are forecast to grow fastest at 8.12% CAGR.
- By production process, Extrusion dominated with 68.34% share in 2025; Injection Molding shows the highest projected CAGR of 5.65% to 2031.
Note: Market size and forecast figures in this report are generated using Mordor Intelligence’s proprietary estimation framework, updated with the latest available data and insights as of 2026.
India Rigid Plastic Packaging Market Trends and Insights
Drivers Impact Analysis*
| Driver | (~) % Impact on CAGR Forecast | Geographic Relevance | Impact Timeline |
|---|---|---|---|
| Explosive Growth of Packaged Dairy in Tier-II and Semi-Urban India | +1.2% | Tier-II cities, semi-urban regions with focus on Uttar Pradesh, Rajasthan, Madhya Pradesh | Medium term (2-4 years) |
| Government Push for Ethanol-Blended Fuel Boosting HDPE Jerrycan Demand | +0.8% | National, with concentration in fuel distribution networks | Short term (≤ 2 years) |
| Rising Adoption of PCR-Content Mandates by Top FMCG Brands Accelerating rPET Bottle Penetration | +1.5% | National, with early adoption in metropolitan markets | Medium term (2-4 years) |
| Surge in Organized Food-service Chains Driving Clamshell and Tray Volumes | +0.9% | Urban centers, expanding to Tier-II cities | Short term (≤ 2 years) |
| Cold-Chain Expansion Enabling PET Preform Demand for Beverage and Pharma Vials | +1.1% | National, with infrastructure concentration in industrial corridors | Long term (≥ 4 years) |
| Source: Mordor Intelligence | |||
Explosive Growth of Packaged Dairy in Tier-II and Semi-Urban India
Fluid milk consumption is set to touch 91 million tonnes in 2025, a 2.2% rise from 2024, converting into consistent bottle and jar demand inside the India rigid plastic packaging market. Packaged fresh milk alone pursues a USD 20 billion opportunity by 2026 as semi-urban consumers shift from loose to branded supply. The INR 15,000 crore Animal Husbandry Infrastructure Fund is financing processing units that specify multilayer HDPE bottles for improved shelf life. Direct-to-consumer brands such as Country Delight, backed by USD 20 million of fresh capital in 2025, adopt tamper-evident PET designs to guarantee delivery within 36 hours. Together these forces embed long-run volume visibility for converters operating in the India rigid plastic packaging market.
Government Push for Ethanol-Blended Fuel Boosting HDPE Jerrycan Demand
India averaged an 11.5% ethanol blend in 2024 and eyes 20% by 2025, triggering downstream demand for chemically resistant HDPE storage drums. [1]Ministry of Petroleum & Natural Gas, “India's Ethanol Push: A Path to Energy Security,” pib.gov.in Production capacity reached 6.35 billion liters in 2024 and continues to climb under the modified Pradhan Mantri JI-VAN Yojana. [2]U.S. Department of Agriculture, “Biofuels Annual: India,” apps.fas.usda.gov As new distilleries open away from cane belts, distributed jerrycan demand follows, widening geographic spread within the India rigid plastic packaging market. Premium grade HDPE that withstands ethanol corrosion commands higher margins, rewarding processors with compounding expertise.
Rising Adoption of PCR-Content Mandates by Top FMCG Brands Accelerating rPET Bottle Penetration
A 30% minimum recycled-content rule effective April 2025 forces beverage and personal-care brands toward bottle-to-bottle loops. Only 5 of 18 food-grade rPET units have FSSAI licences, constraining supply and inflating bottling costs by 30%. Capacity additions by Ganesha Ecopet and an Indorama Ventures JV add 142 kilotons by 2026, narrowing the gap. As infrastructure scales, rPET becomes a branding tool rather than a compliance cost inside the India rigid plastic packaging market.
Cold-Chain Expansion Enabling PET Preform Demand for Beverage and Pharma Vials
Cold-chain investment is targeted to hit Rs 5 lakh crore by 2032 under the PM Gati Shakti plan. Improved temperature logistics favor PET preforms for dairy, juice and injectables requiring tight oxygen and moisture barriers. Converters that can certify vial grades for export win share in the India rigid plastic packaging market.
Restraints Impact Analysis*
| Restraint | (~) % Impact on CAGR Forecast | Geographic Relevance | Impact Timeline |
|---|---|---|---|
| Draft BIS Standards Limiting Phthalate Levels Raising Compliance Costs | -0.7% | National, with higher impact on food-contact applications | Short term (≤ 2 years) |
| State-Level Single-Use Plastic Bans Shifting Volume to Paper Cartons | -0.9% | State-specific, with varying enforcement levels | Medium term (2-4 years) |
| Volatile Propylene Prices Squeezing PP Margins for SME Converters | -0.6% | National, with higher impact on cost-sensitive segments | Short term (≤ 2 years) |
| E-commerce Preference for Flexible Mailers Reducing Small-Parcel Rigid Use | -0.4% | Urban centers with high e-commerce penetration | Long term (≥ 4 years) |
| Source: Mordor Intelligence | |||
Draft BIS Standards Limiting Phthalate Levels Raising Compliance Costs
Revised BIS norms for LDPE, LLDPE and HDPE effective January 2024 impose certification hurdles that smaller converters struggle to finance. Parallel Food Safety Authority rules demand migration testing for recycled PET, adding laboratory overheads. The expense tilts bargaining power toward larger players inside the India rigid plastic packaging market that operate accredited labs and can amortize compliance over scale.
State-Level Single-Use Plastic Bans Shifting Volume to Paper Cartons
Nineteen categories of single-use plastics were banned nationally in July 2022, yet enforcement varies widely by state. Some jurisdictions extend restrictions to trays and cutlery, nudging retailers toward coated paperboard. The Central Pollution Control Board’s monitoring reveals patchy compliance, creating uncertainty for suppliers. Inconsistent rules complicate inventory planning across the India rigid plastic packaging market and limit long-horizon capital spending on affected SKUs.
*Our forecasts treat driver/restraint impacts as directional, not additive. The impact forecasts reflect baseline growth, mix effects, and variable interactions.
Segment Analysis
By Resin Type: PET Leadership With Accelerating PP Gains
The segment generated the largest slice of the India rigid plastic packaging market size, as PET secured 33.02% share in 2025 on the strength of beverage and pharma demand. PP, while smaller, is projected to clock a 7.42% CAGR to 2031 supported by microwave-safe food tubs and automotive components. Regulatory pushes for higher recycled content favor rPET investments, whereas polypropylene volatility, with prices at USD 970-990 per tonne CFR in early 2025, stresses SME cash flows. Bioplastic PLA capacity of 75,000 tonnes coming onstream by 2026 introduces fresh competition, yet cost parity is some years away.
Continued dairy bottling and pharmaceutical vial adoption anchor PET volume, while the circular-economy narrative lifts brand acceptance of recycled grades. PP’s heat-resistance profile secures growth in hot-fill applications even as resin price uncertainty leads converters to hedge procurement. Collectively, resin choice trends will recalibrate margins across the India rigid plastic packaging market.


By Product Type: Bottles & Jars Dominate While Trays Accelerate
Bottles & Jars contributed 35.31% of the India rigid plastic packaging market share in 2025 due to universal use in milk, water and OTC medicine. Rice, snack and ready-to-eat portfolios rely on barrier trays that extend shelf life under humid conditions. Intermediate bulk containers maintain a stable niche in chemicals, amplified by the ethanol program that lifts 20-liter drum procurement. Product innovation centers on lightweight neck finishes that drop resin usage per unit, a vital lever to sustain profitability inside the India rigid plastic packaging market.
By End-Use Industry: Food Steady, Pharmaceuticals Fastest
Food applications accounted for 25.22% of the India rigid plastic packaging market size in 2025, anchored by dairy, edible oils and snacks. Pharmaceutical demand, expanding at 8.12% CAGR, gains from India’s role as the leading global supplier of generics and vaccines.
Regulations mandate child-resistant closures and traceability features on export vials, pushing converters to invest in vision inspection and clean-room molding. Cosmetics and personal care segments ride income growth but remain comparatively smaller. Overall, end-use diversification tempers cyclical swings in the India rigid plastic packaging market.
By Production Process: Extrusion Scale, Injection Precision
Extrusion held 68.34% revenue in 2025, underlying the cost-effective production of water and milk bottles. Injection molding, poised for a 5.65% CAGR, captures closures, pharma components and intricate personal-care jars where dimensional accuracy is critical.
Automation drives both lines, yet injection projects focus on multi-cavity hot-runner tools to cut cycle time. Blow molding retains relevance for HDPE jerrycans demanded by the ethanol blend program. Thermoforming gains in bakery clamshells, aided by polypropylene’s rigidity-to-weight advantage. Collectively, evolving process mix underpins productivity gains across the India rigid plastic packaging market.
Geography Analysis
Western India leads consumption with 46.72% of national plastic demand as FMCG and petrochemical clusters co-locate in Gujarat and Maharashtra. Northern states deploy automotive and packaging hubs around Delhi-NCR, while southern Tamil Nadu leverages port access for processed-food exports. Government-approved plastic parks—10 to date—provide shared utilities that cut conversion costs and support exports that the industry targets to double to USD 25 billion by 2025.
Inland logistics improves under the Unified Logistics Interface Platform, reducing transit damage to rigid packs bound for tier-II cities. Cold-chain corridors linking dairy catchments to consumption centers further widen addressable demand in the India rigid plastic packaging market. Export-oriented units around special economic zones win pharma and food assignments from Western buyers who value India’s BIS and ISO certifications.
Collectively, geography shapes resin selection, pack formats and compliance investments, making location strategy a critical determinant of competitiveness inside the India rigid plastic packaging market.
Regulatory Landscape
India's rigid plastic packaging requirements are shaped by plastic waste and food-contact rules, with compliance increasingly tied to digital reporting and third-party audits. Producers, importers, and brand owners (PIBOs) meet Extended Producer Responsibility (EPR) obligations through the Central Pollution Control Board (CPCB) centralized EPR portal, which affects procurement and documentation across bottles, jars, trays, and industrial packs.
On 31 March 2026, the Ministry of Environment, Forest and Climate Change notified the Plastic Waste Management (Amendment) Rules, 2026, which set phased increases in recycled-plastic usage targets for packaging. In parallel, the Food Safety and Standards Authority of India (FSSAI) issued Food Safety and Standards (Packaging) First Amendment Regulations, 2025, allowing the use of recycled PET in food packaging subject to prescribed national standards. The Environment Audit Rules, 2025 also formalized the use of Registered Environment Auditors for certification and compliance audits of recycled material processors, raising the importance of accredited testing, traceability, and supplier qualification for converters.
Competitive Landscape
The market remains fragmented. PAG’s USD 1 billion purchase of Manjushree Technopack and USD 200 million follow-on deal for Pravesha Industries provide scale and pharma exposure. UFlex allocates USD 200 million to backward integration in Egypt, insulating resin inputs for its Indian plants.
Amcor’s Lift-Off program commits USD 3 million annually to start-ups solving recyclability and AI-based design, aiming to speed sustainable innovations. Ganesha Ecopet’s tie-up with Sorema lifts bottle-to-bottle recycling to 42,000 tonnes a year, addressing supply gaps ahead of the 2025 mandate.
Mold-Tek commissions three plants focused on pharma tubs, courting a Rs 6,000 crore opportunity with tamper-evident IML pails. Resin price swings and tightening BIS norms are squeezing sub-scale players, accelerating M&A and joint-venture activity within the India rigid plastic packaging market.
India Rigid Plastic Packaging Industry Leaders
Essel Propack (EPL Ltd)
Manjushree Technopack Ltd
Mold-Tek Packaging Ltd
Pyramid Technoplast Pvt Ltd
Chemco Group
- *Disclaimer: Major Players sorted in no particular order

Market Opportunities and Future Outlook
Recycled-content and reuse requirements are creating demand pockets for converters with certified recycling feedstock, traceability systems, and food-contact compliant rPET capabilities. The Plastic Waste Management (Amendment) Rules, 2026 provide the compliance pull for higher recycled content in rigid packaging, including a 40% recycled-content target starting 1 April 2026 that scales to 60% by 2028-29, and reuse targets of 10% to 25% for medium-sized formats (0.9-4.9 L) over 2025-2029. With the CPCB EPR portal workflow as the operating backbone, packaging designs that can be supported by audited mass-balance documentation are gaining traction.
Pharmaceutical and industrial rigid packs offer clear scaling lanes where regulated feature requirements align with current capacity additions. Mold-Tek Packaging expanded its pharma packaging focus with a new division at Sultanpur that turned profitable within 12 months, and Pyramid Technoplast disclosed FY26 expansion targets across polymer drums (32,530 MTPA) and IBCs (540,000 units), supported by its 5,000 MT recycling plant commissioned in October 2025 to supply internal feedstock. Consolidation and platform-building are also opening partnering and integration opportunities, including EPL Ltd approving the merger of Indovida India Private Limited in March 2026 to strengthen its market position as brand owners work through tighter recycled-content compliance timelines.
Recent Industry Developments
- July 2026: Mold-Tek Packaging Ltd scheduled installation of four machines at Panipat plant to increase thin-wall packaging capacity. The installation expands capacity for thin-wall packaging in the pharma segment. This strengthens Mold-Tek's ability to meet rising demand from pharma and healthcare customers in India.
- June 2026: Mold-Tek Packaging Ltd launched 28 mm CR-TE (Child-Resistant Tamper-Evident) cap for pharmaceutical liquid and suspension packaging. The launch addresses regulatory needs and strengthens the portfolio in controlled-substance and pediatric-safe packaging. It enhances its exposure to higher-margin segments and regulatory-compliant offerings.
- May 2026: EPL Ltd secured a long-term supply agreement with a global pharmaceutical major for sustainable packaging solutions. The contract expands the pharma packaging footprint with a sustainability focus. The win strengthens market position through major customer win, potential scale benefits and higher recurring revenue.


Research Methodology Framework and Report Scope
Market Definition and Coverage
For this methodology, the India rigid plastic packaging market covers rigid plastic packs sold into India across key end-use applications, tracked as market revenue at the converter and importer level for the study period.
The scope excludes flexible plastic packaging, paper-based rigid packs, and metal or glass rigid packaging formats.
Segmentation Overview
- By Resin Type
- Polyethylene (PE)
- Low-Density Polyethylene (LDPE)
- Linear Low-Density Polyethylene (LLDPE)
- High-Density Polyethylene (HDPE)
- Polyethylene Terephthalate (PET)
- Polypropylene (PP)
- Polystyrene (PS) and Expanded PS (EPS)
- Polyvinyl Chloride (PVC)
- Other Resin Type
- Polyethylene (PE)
- By Product Type
- Bottles and Jars
- Trays and Containers
- Intermediate Bulk Containers (IBCs)
- Drums and Jerrycans
- Other Product Type
- By End-Use Industry
- Food
- Snacks and Confectionery
- Fresh Produce
- Dairy Based Products
- Dry Foods and Cereals
- Pet Food
- Other Food Products
- Beverage
- Bottled Water
- Juices and Nectars
- Dairy Based Beverages
- Carbonated Soft Drinks
- Other Beverages
- Food-service
- Pharmaceuticals
- Cosmetics and Personal Care
- Industrial
- Other End-Use Industry
- Food
- By Production Process
- Blow Molding
- Injection Molding
- Extrusion
- Thermoforming
Data Sources, Market Sizing, and Validation
Desk Research
Desk work starts with building a clear map of demand and supply factors that shape rigid plastic packs in India, then tying those factors to measurable data series. We typically refer to public data such as MOSPI index series, the Department for Promotion of Industry and Internal Trade (DPIIT) investment releases, Central Board of Indirect Taxes and Customs trade statistics, and CPCB and PIB updates that connect to plastic waste rules and EPR timelines.
We also use company annual reports, investor presentations, exchange filings, and business press to understand capacity additions, product mix shifts, and resin exposure for key packaging converters. To close data gaps, paid subscriptions are used selectively for company financials and intelligence, shipment-level import and export views, and patent databases to track process changes and lightweighting trends. These sources are not exhaustive, and we refer to additional publications and datasets for data collection, validation, and research clarification.
Primary Interviews and Surveys
Primary inputs are captured through expert interviews and structured surveys with packaging converters, resin and preform ecosystem participants, brand and procurement stakeholders, and distribution channel contacts across major consuming and manufacturing clusters in India. We use these conversations to confirm volume drivers by format and to sanity-check assumptions such as typical price realization, utilization swings, and substitution across resins and pack types.
Distribution of primary research fieldwork respondents
| Company type | Respondent position |
|---|---|
| Top tier: 31% | CXOs: 13% |
| Mid tier: 55% | Functional/Unit leaders: 28% |
| Smaller Players: 14% | Managers: 59% |
Market-Sizing & Forecasting
The core model is top-down, where end-use demand pools are reconstructed using India-level output and consumption indicators, and then translated into rigid pack requirements using penetration and mix assumptions. For checks, we also run selective bottom-up approximations, such as scaling sampled converter revenue, validating high-volume formats through channel checks, and cross-checking using ASP times volume before adjusting totals when the spread is not fully explainable.
Inputs are selected to reflect how rigid plastic packaging is actually bought and sold in India. Typical variables include packaged food and beverage output trends, dairy and edible oil packaging intensity, pharma and personal care volume movement, resin price progression for PET, PE, and PP, and format mix shifts across bottles and jars, trays and containers, and caps and closures. Where data is patchy (for example, in unorganized conversion clusters), we apply conservative coverage factors and validate them through multiple interview rounds.
Forecasting uses scenario analysis supported by multivariate regression for the main demand drivers. The results are then reviewed with primary experts to keep assumptions realistic on capacity utilization and price pass-through. The final forecast is kept reproducible, since each major line item is tied back to a measurable indicator and a stated assumption.
Data Validation & Update Cycle
Outputs are validated through triangulation across independent signals, including demand indicators, trade movement, and the implied resin requirement from the final volume and mix. Variance checks are run at the format and end-use level, and any outliers trigger a deeper look at unit assumptions, currency conversion timing, and the price realization logic before sign-off.
A multi-step internal review is followed, and experts are re-contacted when new capacity announcements, policy changes under plastic waste rules, or large resin price shocks can move the numbers materially. Reports are refreshed annually, with interim updates also made when major market developments occur. Before delivery, a final analyst pass ensures clients receive the most current view that fits the stated scope.
Mordor Intelligence's India Rigid Plastic Packaging Market Sizing Compared With Other Published Estimates
Published market values for India rigid plastic packaging can differ because each publisher makes its own choices on scope boundaries, price build-ups, and the timing of currency and inflation assumptions. Even small differences, such as counting closures with the container or treating industrial packs as part of consumer packaging, can shift the total by a noticeable amount.
Trade movement patterns for key polymer and packaging-related imports, along with converter capacity and utilization signals gathered in interviews, are used to tie Mordor Intelligence's estimate to a defined India demand pool rather than an expanded packaging universe. In practice, gaps can also come from aggressive price escalation for resin-linked formats, mixing fiscal-year and calendar-year bases, or not re-validating pack-mix changes across bottles, trays, and caps after policy and consumer shifts.
Benchmark comparison
| Source | Market Size | Gaps in Research Methodology |
|---|---|---|
| Mordor Intelligence | USD 14.28 B (2025) | |
| Industry Data Portal A | USD 12.89 B (2025) | Uses a fiscal-year framing and a narrower coverage of rigid formats in packaged consumer goods, which can undercount closures and non-FMCG rigid packs and also compress reported ASP ranges. |
| Sector News Brief B | USD 8.63 B (2023) | Often reflects the rigid segment inside a broader plastic packaging headline, and the year basis and pricing method are not clearly linked to resin movements, which can lead to a lower point estimate. |
The table shows that most of the spread is explained by year selection and by what gets counted inside rigid packs, especially around caps and closures and non-consumer applications. By keeping the scope rules explicit and then re-checking price and volume assumptions against independent signals, the final number stays transparent and repeatable for planning.


Key Questions Answered in the Report
What is the current value of the India rigid plastic packaging market?
The market is worth USD 15.17 billion in 2026 and is projected to reach USD 20.53 billion by 2031.
Which resin holds the largest share in the India rigid plastic packaging market?
Polyethylene Terephthalate leads with 33.02% share in 2025.
Why are HDPE jerrycans in higher demand?
Government targets for 20% ethanol-blended fuel by 2025 require chemically resistant HDPE containers across fuel supply chains.
How will recycled-content mandates affect packaging suppliers?
A 30% rPET requirement from April 2025 is driving investments in bottle-to-bottle recycling and raising costs for brands without secure recycled resin supply.
Which end-use sector is growing fastest?
Pharmaceutical applications show the highest 8.12% CAGR thanks to India’s expanding generic drug and vaccine production.
What is the main restraint confronting the industry?
State-level single-use plastic bans and new BIS standards raise compliance expenditures and push some volume to alternative materials.
Page last updated on:


 Your data is secure and never sold or shared.


