
Market Overview
| Study Period | 2020 - 2031 |
|---|---|
| Forecast Data Period | 2026 - 2031 |
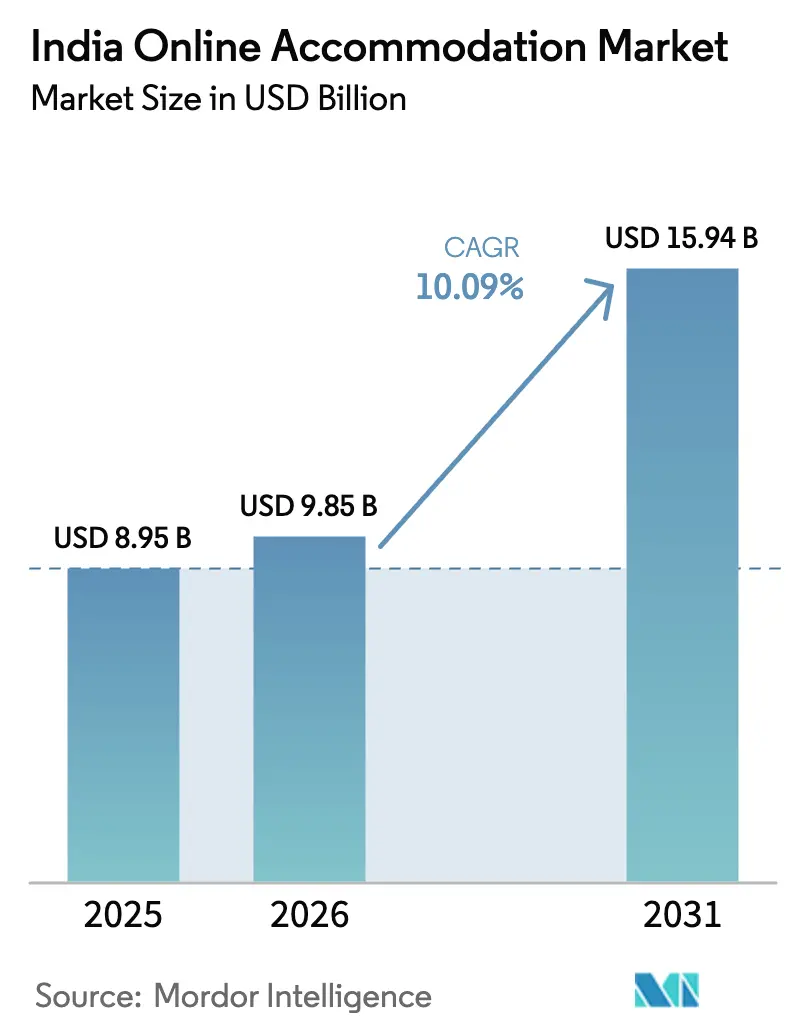
| Base Year Market Size (2025) | USD 8.95 Billion |
| Market Size (2026) | USD 9.85 Billion |
| Market Size (2031) | USD 15.94 Billion |
| Growth Rate (2026 - 2031) | 10.09 % |
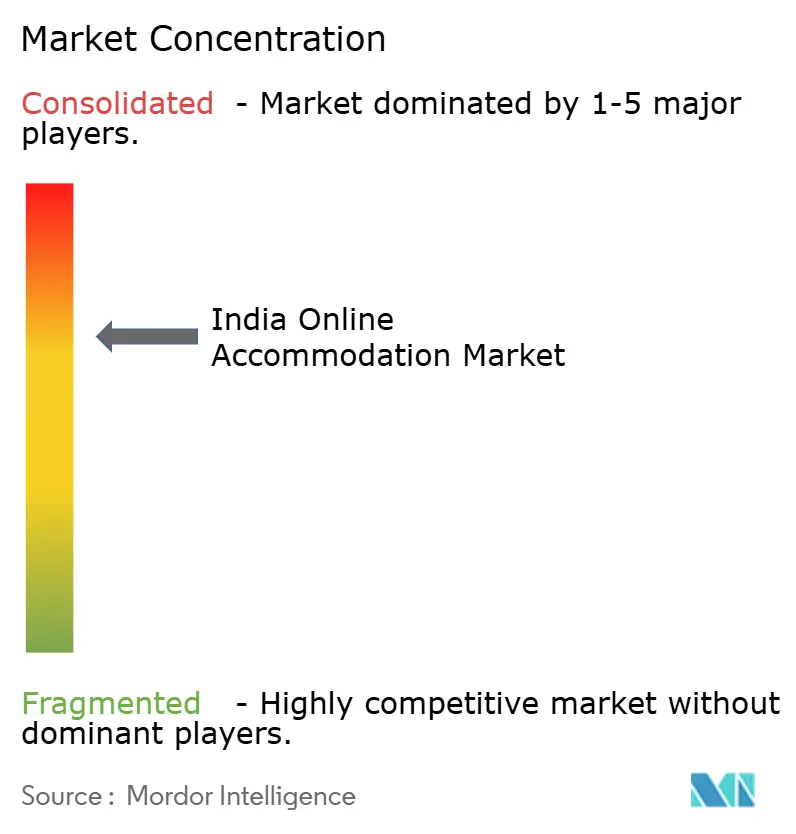
| Market Concentration | Medium |
Major Players *Disclaimer: Major Players sorted in no particular order Image © Mordor Intelligence. Reuse requires attribution under CC BY 4.0. | |
India Online Accommodation Market Analysis by Mordor Intelligence
The India online accommodation market size was valued at USD 8.95 billion in 2025 and estimated to grow from USD 9.85 billion in 2026 to reach USD 15.94 billion by 2031, at a CAGR of 10.09% during the forecast period (2026-2031). Smartphones account for most of the digital travel consumption, while Unified Payments Interface (UPI) transactions remove friction at checkout and boost conversion rates. Domestic leisure demand is rebounding ahead of business travel, supported by improved highways and low-cost carriers that expand weekend escape options. Platform players intensify competition through AI-enabled personalization and vernacular interfaces that shrink customer acquisition costs in Tier-2 and Tier-3 cities. Government initiatives such as the Open Network for Digital Commerce (ONDC) promise to lower distribution fees, potentially redrawing bargaining power between property owners and online travel agencies (OTAs).
Key Report Takeaways
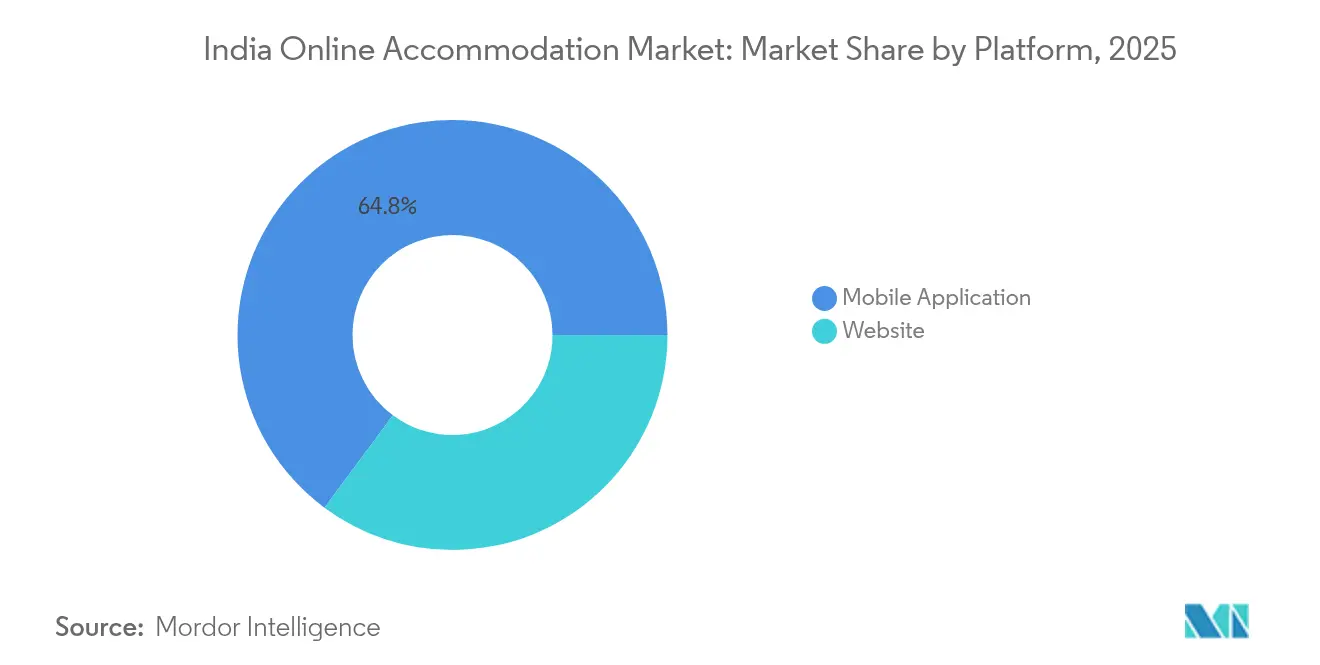
- By platform, mobile applications captured 64.84% of the India online accommodation market share in 2025, and are growing at a CAGR of 18.73% through 2031, while web interfaces are losing ground at a measured pace.
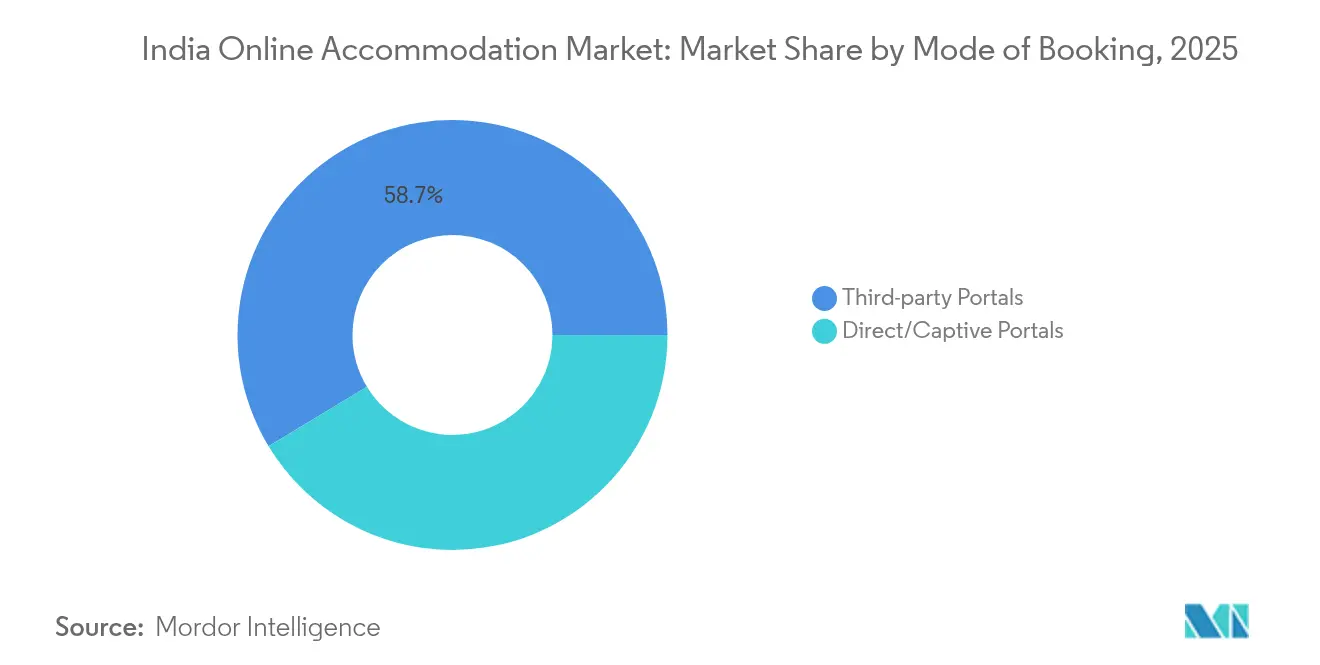
- By mode of booking, third-party portals held 58.66% of the India online accommodation market size in 2025; direct channels are expanding at a 21.65% CAGR through 2031.
- By property type, hotels and resorts accounted for 47.58% of the India online accommodation market size in 2025, whereas vacation rentals are advancing at an 17.66% CAGR to 2031.
- By geography, West India commanded 24.02% of the India online accommodation market share in 2025, while the Northeast is poised for the fastest 15.89% CAGR through 2031.
Note: Market size and forecast figures in this report are generated using Mordor Intelligence’s proprietary estimation framework, updated with the latest available data and insights as of 2026.
India Online Accommodation Market Trends and Insights
Drivers Impact Analysis*
| Driver | (~) % Impact on CAGR Forecast | Geographic Relevance | Impact Timeline |
|---|---|---|---|
| Smartphone penetration & affordable data | +2.8% | National; strongest in Tier-2/3 cities | Medium term (2-4 years) |
| UPI-driven frictionless payments | +2.1% | National; urban concentration | Short term (≤ 2 years) |
| Domestic leisure & micro-vacations | +1.7% | West, South, and emerging Northeast | Medium term (2-4 years) |
| Millennial preference for alternative stays | +1.4% | Metros and secondary cities | Long term (≥ 4 years) |
| ONDC-enabled zero-commission distribution | +0.9% | Pilot cities nationwide | Long term (≥ 4 years) |
| Vernacular voice search adoption | +0.6% | Hindi belt and South Indian languages | Medium term (2-4 years) |
| Source: Mordor Intelligence | |||
Smartphone Penetration and Affordable Data Tariffs
Mobile data costs fell below USD 0.20 per GB in 2025, fueling 87.5% usage of apps for search and booking. User engagement rises when connectivity is inexpensive, elevating repeat bookings and shrinking seasonal revenue swings. Tier-2 and Tier-3 cities, once reliant on brick-and-mortar agents, now leap directly to app-based discovery, allowing OTAs to access fresh customer cohorts at lower acquisition costs. Push notifications, location-aware deals, and single-click check-ins deliver convenience that entrenches mobile as the default interface. Platforms benefit from granular behavioral data that drives algorithmic pricing, while travelers receive hyper-personalized suggestions mapping to real-time availability. As 5G rolls out broadly, high-definition images and immersive room tours will further strengthen the mobile value proposition.
UPI-Driven Frictionless Digital Payments
Unified Payments Interface settled 52% more transactions and 40% higher value in H1 2024, trimming historic cart abandonment that exceeded 60% for India online accommodation market bookings [1]Ishita Sharma, “UPI transaction volume up 52%, value rises 40% in H1 2024,” Economic Times, economictimes.indiatimes.com.. Zero-fee instant transfers raise net margins for small hosts previously paying 2-3% gateway charges. The familiar interface improves trust among first-time digital users, widening the pool of addressable customers well beyond metro geographies. OTAs emphasize India-specific payment rails in their checkout stacks, giving them a competitive moat versus global rivals still optimized for card-based flows. As UPI’s credit-on-UPI feature matures, installment-style travel payments could unlock higher-ticket bookings and length-of-stay upgrades. The virtuous loop between seamless payments and rising bookings amplifies scale effects for market leaders.
Domestic Leisure and Micro-Vacation Boom
Weekend getaways dominate search queries as travelers trade a single annual vacation for multiple micro-breaks, pushing domestic RevPAR 15% above pre-pandemic watermark in 2024. Enhanced highways and regional airports extend practical drive-time radii, enlarging the demand catchment for tier-two destinations. Vacation rentals and boutique homestays capture outsized benefits because they align with experiential itineraries that favor local immersion over standardized services. Government-funded tourism circuits, particularly the 33 projects underway in the Northeast, seed fresh supply corridors where early movers can lock in brand equity. OTAs capitalize by bundling stay, activity, and last-mile mobility into single-screen offerings that generate ancillary revenue. Micro-vacations also flatten demand seasonality, stabilizing cash flows for property owners and facilitating dynamic revenue-management strategies.
Millennial Acceptance of Alternative Lodging
Millennials and Gen Z allocate increasing disposable income to experience-based products, propelling vacation rentals at an 18.24% CAGR through 2030. Curated brands such as SaffronStays and Vista Rooms assure service consistency across villas, farm-stays, and heritage homes. Social media amplifies user-generated content, turning guests into de facto marketers who broadcast property aesthetics to peer networks. Blended trips that merge workdays with leisure evenings, or “workations,” lift the average length of stay, particularly during shoulder seasons. Corporate travel managers also warm to extended-stay rentals that cut per-diem housing costs relative to upscale hotels. OTA algorithms now surface alternative inventory alongside hotels, accelerating mainstream adoption while providing suppliers with direct exposure to high-intention audiences.
Restraints Impact Analysis*
| Restraint | (~) % Impact on CAGR Forecast | Geographic Relevance | Impact Timeline |
|---|---|---|---|
| High OTA commission structure | -1.8% | Nationwide, acute for independents | Short term (≤ 2 years) |
| Complex multi-layer GST burden | -1.2% | Nationwide, harsher on micro hosts | Medium term (2-4 years) |
| Escalating cyber-fraud and refund scams | -0.9% | Metro clusters with dense digital adoption | Short term (≤ 2 years) |
| Municipal crack-downs on short-term rentals | -0.7% | Goa, Himachal Pradesh, gradual spillover | Medium term (2-4 years) |
| Source: Mordor Intelligence | |||
High OTA Commission Structure Squeezing Margins
Commission rates climbed from 15-18% toward 40-45%, inciting hotel associations to threaten boycotts that forced MakeMyTrip to cap commissions near 22% [2]Matthew Parsons, “MakeMyTrip CEO on India’s fragmented travel sector,” skift.com. . Margin compression incentivizes properties to channel-shift toward direct bookings and ONDC-enabled storefronts that forgo intermediary fees. Chains with bargaining clout negotiate tiered rate bands, widening competitive gaps versus independents that lack volumes. OTAs counter by offering bundled ad credits and loyalty integrations that promise revenue lifts, offsetting fee loads. Nevertheless, commission escalation accelerates consolidation as financially stretched small hotels cede market presence to scaled operators. Government scrutiny of pricing parity clauses may further unravel existing commission frameworks.
Complex Multi-Layer GST and Compliance Burden
Accommodation providers grapple with varying GST slabs for rooms, food, and ancillary services, generating filing workloads ill-suited to mom-and-pop properties lacking dedicated accountants. Delayed input-tax credit refunds constrain working capital, especially during off-peak months. Divergent state-level interpretations of GST applicability complicate OTA invoicing systems that must dynamically map tax codes to thousands of listings. Vacation-rental hosts in rural districts confront the cost–benefit dilemma of formal registration, stunting supply growth where new demand is most pronounced. Digitization of GST returns offers partial relief, yet familiarity gaps persist among micro-entrepreneurs outside metro hubs. A harmonized single-rate regime could unlock participation from long-tail suppliers, but legislative consensus remains distant.
*Our forecasts treat driver/restraint impacts as directional, not additive. The impact forecasts reflect baseline growth, mix effects, and variable interactions.
Segment Analysis
By Platform: Mobile Apps Dominate Discovery
Mobile applications controlled 64.84% of India online accommodation market share in 2025 and are anticipated to post a 18.73% compound rate to 2031, whereas desktop websites serve primarily corporate and multi-stop itineraries. The India online accommodation market size for mobile interfaces is set to expand as Hindi and Tamil voice-search penetration multiplies, simplifying query entry for non-English speakers. Push-notification retargeting converts undecided browsers into bookers, while biometric log-ins shrink funnel drop-offs. Location-based dynamic discounting aligns unsold inventory with nearby demand in real time, boosting occupancy without rate erosion. OTA mobile super-apps aggregate transport, experiences, and financial services, embedding accommodation inside broader lifestyle ecosystems that elevate retention. Developers integrate smartphone cameras for visual search, allowing users to scan landmarks and surface proximate lodging options, a feature absent on conventional web platforms. As 5G broadens bandwidth, high-resolution immersive room tours will become table stakes for mobile listings, raising content-creation costs but enhancing trust.
Desktop websites, despite slower growth, remain relevant for large travel management corporations requiring integration with expense systems. They also appeal to longer-lead wedding and MICE bookings that need advanced filters unavailable on mobile. While web traffic as a share of total sessions contracts, its absolute volume edges up due to overall market expansion. OTAs, therefore, pursue responsive design so that hotel partners can manage inventory from any device, minimizing operational friction. Cross-channel user-identifier stitching lets platforms recognize the same traveler moving between mobile and desktop, preserving personalization continuity. The interplay among screen sizes underlines the omnichannel imperative even in a mobile-first nation.


By Mode of Booking: Direct Channels Gain Momentum
Third-party portals retained a 58.66% share of the India online accommodation market in 2025, yet direct portals outpace them with a 21.65% CAGR to 2031 as properties chase commission savings. The India online accommodation market size attributable to direct reservations is forecast to widen as ONDC’s open protocols democratize visibility for small hotels on multiple buyer apps without paying discovery fees. Brands introduce loyalty wallets that recycle cashback into future stays, partially replicating OTA reward schemes. Meta-search engines funnel prospective guests toward brand.com pages by displaying lower “member-exclusive” rates, an approach validated by global majors. For properties, in-house booking engines mean richer first-party data, feeding machine-learning tools that individualize pre-stay upselling.
OTAs counteract leakage by offering irresistible bundle discounts on flights and activities that direct sites cannot match at scale. White-label widgets allow even resource-starved homestays to embed instant UPI collections and verified guest reviews directly on their micro-sites. Chatbots powered by large-language models handle multilingual inquiries, making direct channels operationally feasible for single-property owners. While total third-party volume continues to rise, the proportional shift toward owned channels pressures OTA take rates, compelling them to diversify revenue through advertising and fintech products.
By Property Type: Vacation Rentals Reshape Hospitality
Hotels and resorts accounted for 47.58% of the India online accommodation market size in 2025, but their share edges downward as vacation rentals gallop at an 17.66% CAGR. Urban millennials opt for villas, farm-stays, and heritage bungalows that promise privacy, space, and local flavor absent in chain properties. The India online accommodation market share for hostels rebounds alongside backpacker tourism, with operators such as Zostel reopening dorms equipped with co-working zones. Alternative lodgings—ranging from glamping pods to tree-houses—leverage Instagrammable design to secure premium nightly rates despite modest amenity lists.
Chains respond by launching soft brands that embrace boutique aesthetics within global loyalty umbrellas, blurring the line between hotel and vacation rental. Professional managers bring standardized housekeeping and 24-hour helplines to luxury villas, closing historical quality gaps. Regulatory ambiguity persists, as municipalities wrestle with safety compliance for non-hotel structures; however, clarified homestay guidelines in states like Karnataka signal regulatory tailwinds. Institutional investors investigate build-to-rent clusters in leisure corridors, foreseeing yield premia over traditional hospitality assets. OTAs curate “collections” labels to guarantee baseline service levels, soothing guest concerns over heterogeneous inventory.
Geography Analysis
West India, anchored by Maharashtra’s corporate hub and Goa’s leisure appeal, led with 24.02 of % India's online accommodation market share in 2025. Saturation in mature metros pushes operators toward premium differentiation, such as wellness-oriented boutique resorts and culinary-themed hotels. Regulatory headwinds surface as Goa mandates Category D registration for sub-10-room homestays, inflating compliance costs . South India follows closely, fueled by Bengaluru’s tech-traveler base and Kerala’s year-round eco-tourism, with Chennai’s medical-tourism corridors producing stable mid-week occupancy.
North India blends corporate demand from Delhi NCR with hill-station leisure traffic, yet grapples with seasonal strain on road infrastructure during summer peaks. Central India, once overlooked, gains visibility as monastery circuits and tiger reserves receive marketing pushes. The India online accommodation market size in the Northeast, although small relative to the West, is forecast to climb steeply with a CAGR of 15.89%, supported by World Bank-assisted road upgrades and marketing of tribal festivals . Travel influencers play a role in spotlighting unexplored locales like Ziro Valley, unlocking social-media-driven demand spikes. As flight capacity to Guwahati and Agartala expands, average daily rates uplift owing to constrained room inventories, rewarding early-entry operators.
Inter-regional price disparities narrow as digital discovery levels information asymmetries, prompting travelers to evaluate Shillong or Coorg as substitutes for over-crowded staples. OTA dashboards reveal rising search queries for community-based eco-stays, signaling a pivot toward sustainability-led itineraries. State tourism boards now co-fund influencer trips, accelerating international awareness without large advertising budgets. Collectively, geographic diversification cushions platform revenue against localized regulatory shocks and weather-related disruptions.
Regulatory Landscape
India online accommodation operates within a fragmented, multi-clearance hospitality regime that cuts across central, state, and municipal requirements. This affects how quickly accommodation supply can be added and how OTAs contract with properties. The Ministry of Tourism (Government of India) anchors national frameworks through voluntary hotel and resort star-classification guidelines and runs the National Integrated Database of Hospitality Industry (NIDHI+) for registration and related compliance workflows. Local bodies determine operational permissions such as health trade and liquor licenses, which is a common driver of the long establishment timelines often cited in policy discussions (36 to 48 months). OTAs also work within Ministry of Tourism guidance on approvals and standards as part of the broader tourism services ecosystem.
Reform momentum became clearer in 2026, when NITI Aayog released the report "Unlocking Growth in Tourism and Hospitality Sector" (July 2026). It recommended non-financial regulatory simplification, including single-window style clearances and rationalized licensing, with the aim of reducing approval timelines from 36 to 48 months toward 12 to 18 months. In parallel, the Ministry of Tourism convened industry consultations in June 2026 on ease-of-doing-business measures, including greater digitization and potential self-declaration mechanisms for certain compliance processes. If carried through via notifications and state adoption, these steps can reduce compliance friction for accommodation suppliers and distribution platforms.
Value Chain Analysis
The value chain starts with accommodation supply creation and onboarding (independent hotels, chains, homestays, and alternative stays). It then moves to digitized listing, content, pricing, and inventory management through property systems and platform extranets. Distribution follows via third-party portals (OTAs and meta-discovery), direct and captive brand channels, and emerging open-network rails. Conversion is supported by India-specific payments, notably UPI, and by post-booking operations such as customer support, cancellations and refunds, and reviews. Government digitization initiatives add an institutional layer to supplier onboarding and verification, including the Ministry of Tourism launching NIDHI+ (December 2025) for online processing and approvals for hospitality units and tourism service providers.
Upstream and midstream modernization is also driven by consolidation and targeted capability additions. In June 2026, Ixigo approved the acquisition of a 54.66% stake in Brevistay Hospitality to broaden hotel-booking reach and flexible-stay inventory, reflecting how platforms add specialized supply and contracting depth beyond broad marketplace aggregation. On procurement and operations, hotels are shifting from relationship-led sourcing toward digital discovery and structured RFQ-based buying. Government programs promoting direct procurement from Farmer Producer Organisations (FPOs) (announced in November 2025) point to a parallel effort to formalize cost inputs and reduce intermediary layers. Key bottlenecks remain multi-layer compliance, including license requirements and GST interpretations by state, along with trust-and-safety controls that raise platform costs across fraud prevention, dispute resolution, and host verification.
Competitive Landscape
In 2024, the Indian online travel market remained dominated by the top five players, forming an oligopoly that still leaves space for niche players to innovate. MakeMyTrip and OYO continue to lead the market, leveraging powerful network effects, expansive loyalty ecosystems, and marketing budgets that far surpass those of smaller rivals. OYO’s acquisition of G6 Hospitality for USD 525 million in December marked a major strategic move, expanding its North American presence and enhancing its technology infrastructure. Meanwhile, MakeMyTrip is rapidly deploying vernacular-language chatbots and AI-powered dynamic travel packaging to stay competitive amid rising digital advertising costs. These investments reflect a shift toward platform intelligence and localized user engagement. Despite their dominance, emerging players are finding room to grow by targeting underserved customer segments.
New entrants are focusing on ultra-localized inventory and sustainability-driven experiences to avoid confrontation with market leaders. These platforms are differentiating through curated offerings that highlight local culture, eco-conscious stays, and hyper-personalized service. India’s Open Network for Digital Commerce (ONDC) introduces a new dynamic, as its open APIs allow inventory to be distributed across multiple buyer apps without platform exclusivity. While ONDC’s potential to disrupt the OTA landscape is clear, it still faces early-stage adoption challenges. Traditional hotel brands are also adapting by investing in direct booking platforms and revamping loyalty programs to regain customer control. Some are even trialing subscription-based stay models to encourage repeat bookings and reduce dependency on OTAs.
As digital infrastructure matures, capital requirements are rising, especially in areas like AI, cybersecurity, and data analytics—now considered baseline rather than competitive advantages. The growing threat of cyber fraud has led platforms to implement advanced behavioral analytics to detect and prevent suspicious booking activity. Trust and safety have become central to maintaining user loyalty and brand integrity. At the same time, travel platforms are forming deeper marketing alliances with airlines, credit card companies, and tourism boards to gain broader access to customer data and ownership. With pressure mounting on traditional take rates, companies are diversifying into adjacent revenue streams such as advertising, buy-now-pay-later (BNPL) financing, and event ticketing. These initiatives help sustain top-line growth even as accommodation margins become increasingly compressed.
India Online Accommodation Industry Leaders
MakeMyTrip
OYO Rooms
Goibibo
Airbnb
Booking.com
- *Disclaimer: Major Players sorted in no particular order

Market Opportunities and Future Outlook
A sizable conversion and digitization whitespace remains because a high share of hotel bookings still happens offline in India as of 2026. That creates room for platforms to capture first-time digital bookers using vernacular UX, low-friction UPI checkout, and tightly managed supply quality. Platform moves in 2026 also show a push toward deeper inventory access and flexibility-led use cases. Ixigo approved the acquisition of a majority stake (54.66%) in Brevistay in June 2026 to expand directly contracted hotel inventory and flexible stays, reinforcing the case for short-duration and non-standard check-in and check-out demand that traditional distribution can underserve.
Policy and ecosystem digitization create additional opportunity around faster supplier onboarding and better visibility of compliant inventory. NITI Aayog (July 2026) recommended single-window clearances and license rationalization to reduce hotel project approval timelines from 36 to 48 months toward 12 to 18 months. The Ministry of Tourism has also been advancing national digitization through NIDHI+ (launched December 2025) for approvals and registrations. On the demand side, the Ministry of Tourism and Google India signed an MoU (June 2026) focused on AI and data-driven promotion and training, supporting higher-quality destination discovery and content workflows that feed accommodation search and packaging. At the same time, travel-fintech investment and credit-linked booking activity, including Scapia raising funding in May 2026, points to an opportunity to integrate payments, credit, and loyalty to lift conversion and repeat rates, particularly where card penetration is lower than UPI familiarity.
Recent Industry Developments
- July 2026: MakeMyTrip India pre-filed a confidential Draft Red Herring Prospectus (DRHP) with SEBI, BSE, and NSE for a proposed India IPO. The filing indicates a shift toward accessing domestic capital markets and can support ongoing investment in accommodation supply partnerships, marketing, and product capabilities.
- June 2026: OYO's parent Prism (formerly Oravel Stays) filed an updated draft prospectus with SEBI for an IPO comprising a fresh issue of shares worth up to INR 6,650 crore. The capital-raise plan improves balance-sheet flexibility for asset-light expansion, technology upgrades, and partner programs that influence online room supply and quality consistency.
- August 2025: OYO partnered with IBS Software to deploy the iStay platform across its global portfolio, including Motel 6 and Studio 6, adding real-time content management and pricing optimization capabilities. The rollout tightens operational control and rate management, which can improve listing accuracy and yield outcomes across online channels.


Research Methodology Framework and Report Scope
Market Definition and Coverage
This market covers the value of accommodation bookings made through online channels in India, where a digital platform is used to discover, compare, and reserve stays, and revenue is linked to booking transactions.
Scope exclusions: Excludes offline-only hotel bookings, transport-only travel bookings, and non-accommodation travel services such as activities or insurance.
Segmentation Overview
- By Platform
- Mobile Application
- Website
- By Mode of Booking
- Third-party Online Portals
- Direct/Captive Portals
- By Property Type
- Hotels & Resorts
- Vacation Rentals
- Hostels & Budget Accommodations
- Alternate Lodgings (Glamping, Farm-stays)
- By Geography
- North India
- South India
- East India
- West India
- Central India
- Northeast India
Data Sources, Market Sizing, and Validation
Desk Research
Desk work starts by building the demand and supply context for paid stays in India, then mapping what portion moves through digital booking. We lean on public, non-paywalled sources such as Ministry of Tourism statistics, RBI releases on travel-related flows, MOSPI macro series, and, where relevant, airport or rail passenger traffic dashboards as travel signals.
We also review company annual reports, investor presentations, and credible press coverage to understand channel mix, take rates, and product focus (for example, hotel stays versus alternative stays). To reduce gaps, we use paid subscriptions for company financials and intelligence, news and financials, and a patent database to track innovation cues tied to booking and payments. The desk sources noted above are illustrative rather than exhaustive, and additional references were used to collect data, validate assumptions, and clarify definitions.
Primary Interviews and Surveys
Primary work is used to pressure test assumptions that desk sources do not spell out clearly, especially the online share of total accommodation spending and the typical commission or margin structures across booking paths. We speak with a mix of online booking intermediaries, accommodation operators, and allied travel distribution participants, then validate differences across metro versus leisure destinations and across domestic versus inbound traveler mixes.
Distribution of primary research fieldwork respondents
| Company type | Respondent position |
|---|---|
| Top tier: 29% | CXOs: 12% |
| Mid tier: 53% | Functional/Unit leaders: 31% |
| Smaller Players: 18% | Managers: 57% |
Market-Sizing & Forecasting
Sizing is built with a top-down and bottom-up combination, where India travel and lodging spend signals are converted into an online-booked accommodation pool using observed online adoption and booking mix patterns, then translated into market value for the study definition. The totals are checked with selective bottom-up approximations, such as sampled booking volumes by stay nights and indicative average booking values, plus channel checks on take rates to see if the outcome looks realistic.
Key inputs used in the model include domestic and inbound travel intensity, smartphone and mobile internet adoption as a booking enabler, seasonality of leisure and business travel, average daily rate movement in key cities and leisure corridors, and the share shift between direct and intermediary booking paths. Where bottom-up checks are incomplete, gaps are handled through calibrated ranges by accommodation type and traveler purpose, then tightened through follow-up primary calls.
For forecasting, we use scenario analysis supported by trend smoothing, since near-term outcomes can swing with demand shocks and pricing cycles. Growth paths are adjusted using expert views on online penetration, supply additions in organized stays, and expected pricing changes, before the final time series is locked.
Data Validation & Update Cycle
Validation happens through multiple cross-checks that connect the final totals to real-world signals, including travel demand indicators, lodging pricing direction, and observed online booking behavior from interviews. Outliers are investigated by rechecking source notes, currency timing, and assumptions on booking mix, after which the model is reviewed in steps by another analyst before sign-off.
Reports are refreshed annually, and interim updates are done when material events are seen that can change demand, supply, or booking economics. Before delivery, we run a last pass to capture the latest publicly available updates and any new primary feedback that can shift key inputs.
Mordor Intelligence's India Online Accommodation Market Size Compared With Other Published Estimates
Published market sizes for India online accommodation can vary because people do not always count the same booking flows, and because pricing and currency timing choices are handled differently. The year used, whether the value reflects gross bookings or net revenue, and how direct bookings are treated can all move the number.
The table shows a clear spread across 2024 to 2026 values, and in the Mordor Intelligence model the market is counted as online accommodation booking value tied to digital reservation activity in India, instead of including transport-led online travel spending or non-accommodation add-ons that sit outside the market.
Benchmark comparison
| Source | Market Size | Gaps in Research Methodology |
|---|---|---|
| Mordor Intelligence | USD 8.95 B (2025) | |
| Industry Report A | USD 8.24 B (2024) | Uses a different base year and may apply a narrower capture of booking value by focusing on select online channels, which can understate totals when direct digital bookings and wider stay formats are not consistently counted. |
| Industry Report B | USD 11.42 B (2026) | Starts from a later-year estimate and can reflect a faster assumed online penetration and price progression, which tends to lift the value when adjacent travel services are also blended into the accommodation total. |
Across the three figures, most of the gap is explained by year alignment, what is included under accommodation-only online value, and how booking value is translated into USD. Our approach stays traceable because the totals are rebuilt from demand signals and booking mix assumptions that can be checked and rechecked as market conditions change.


Key Questions Answered in the Report
How big is the India online accommodation market in 2026?
It is valued at USD 9.85 billion and forecast to climb to USD 15.94 billion by 2031.
What is the projected growth rate through 2031?
The sector is expected to post a 10.09% CAGR, propelled by mobile adoption and UPI payments.
Which platform type leads bookings?
Mobile applications dominate with 64.84% share in 2025 thanks to affordable data and voice-search interfaces.
Why are vacation rentals growing faster than hotels?
Millennials seek experiential, private stays, pushing vacation rentals at an 17.66% CAGR to 2031.
Which region offers the strongest future growth?
The Northeast leads with a projected 15.89% CAGR due to new tourism circuits and infrastructure upgrades.
How are commission pressures affecting property owners?
Rising OTA fees motivate hotels to invest in direct portals and explore ONDC’s zero-commission model for better margins.
Page last updated on:


 Your data is secure and never sold or shared.


