
Market Overview
| Study Period | 2021 - 2031 |
|---|---|
| Forecast Data Period | 2026 - 2031 |
| Base Year Market Size (2025) | USD 5.11 Billion |
| Market Size (2026) | USD 5.36 Billion |
| Market Size (2031) | USD 6.81 Billion |
| Growth Rate (2026 - 2031) | 4.89 % |
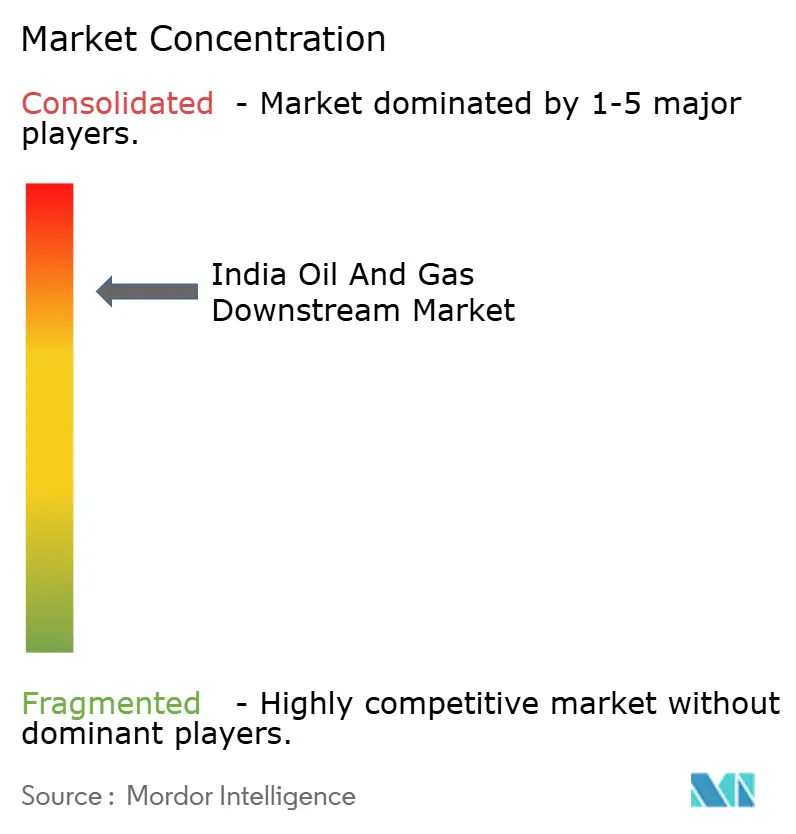
| Market Concentration | High |
Major Players *Disclaimer: Major Players sorted in no particular order Image © Mordor Intelligence. Reuse requires attribution under CC BY 4.0. | |
India Oil And Gas Downstream Market Analysis by Mordor Intelligence
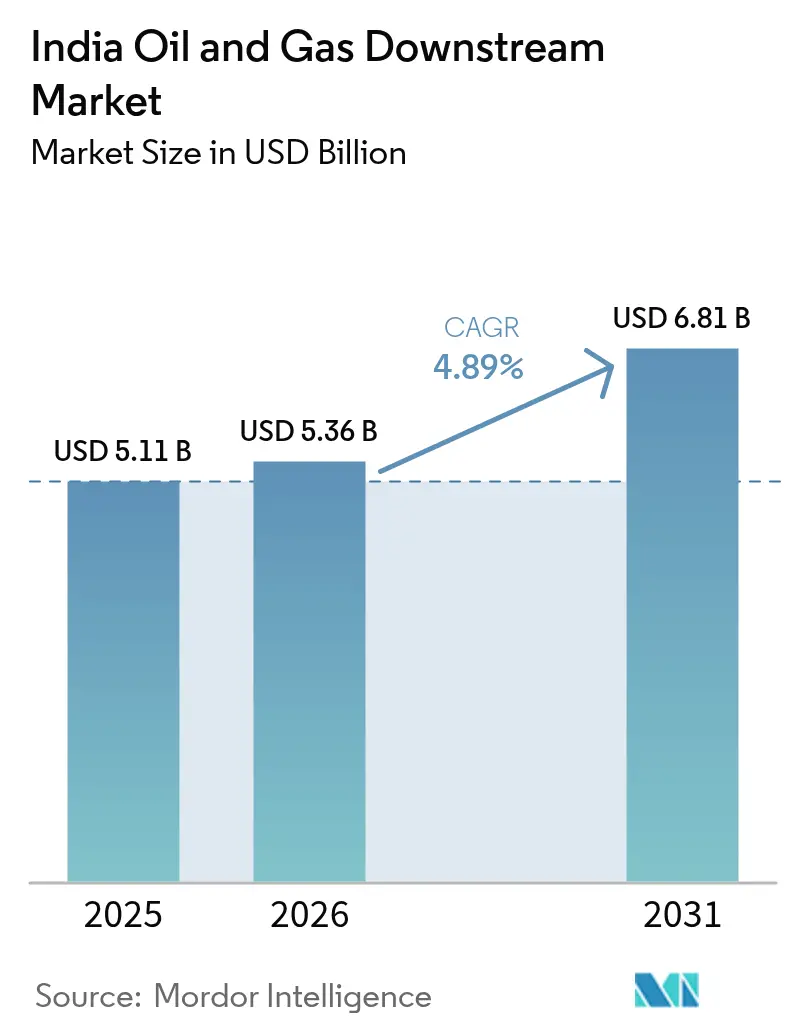
The India Oil And Gas Downstream Market size was valued at USD 5.11 billion in 2025 and estimated to grow from USD 5.36 billion in 2026 to reach USD 6.81 billion by 2031, at a CAGR of 4.89% during the forecast period (2026-2031).
Robust public- and private-sector investments, expanding petrochemical demand, and ongoing refinery modernizations keep the growth engine well-oiled, despite the energy transition's headwinds. Capacity additions totaling 652,000 barrels per day scheduled by 2027 reinforce India's ambition to serve both domestic consumption and regional export needs. Regulatory catalysts, such as the Bharat Stage-VI (BS-VI) fuel norms, the 20% ethanol-blending mandate, and the national hydrogen roadmap, are accelerating technology upgrades, operational digitalization, and feedstock diversification. Integrated refinery–petrochemical complexes, exemplified by Reliance's Jamnagar hub, illustrate how operators are hedging gasoline-demand uncertainty by tilting toward higher-margin chemicals. Meanwhile, retail fuel distribution is undergoing a digital makeover—routine deployment of IoT sensors, mobile payments, and AI-driven inventory tools is redefining last-mile efficiency and customer engagement.
Key Report Takeaways
- By type, refineries led with 65.12% of India's oil and gas downstream market share in 2025, while petrochemical plants are projected to register a 7.22% CAGR through 2031—the fastest growth within the market.
- By product type, refined petroleum products accounted for 67.54% share of the India oil and gas downstream market size in 2025, while petrochemicals are set to expand at a 6.94% CAGR to 2031.
- By distribution channel, retail fuel outlets captured a 59.92% share of the India oil and gas downstream market size in 2025 and are expected to advance at a 5.56% CAGR through 2031.
Note: Market size and forecast figures in this report are generated using Mordor Intelligence’s proprietary estimation framework, updated with the latest available data and insights as of 2026.
India Oil And Gas Downstream Market Trends and Insights
Drivers Impact Analysis*
| Driver | (~) % Impact on CAGR Forecast | Geographic Relevance | Impact Timeline |
|---|---|---|---|
| Rising middle-class fuel demand | +1.2% | Tier-2 cities nationwide | Medium term (2-4 years) |
| BS-VI compliance capex | +0.8% | Major refining hubs | Short term (≤2 years) |
| Petrochemicals demand growth | +0.6% | Gujarat–Maharashtra corridor | Long term (≥4 years) |
| Hydrogen & bio-fuels blending push | +0.4% | Select pilot states | Long term (≥4 years) |
| Digital refinery OPEX optimization | +0.3% | Pan-India refineries | Medium term (2-4 years) |
| Aviation traffic rebound | +0.2% | Metro airports | Short term (≤2 years) |
| Source: Mordor Intelligence | |||
Rising Middle-Class Fuel Demand
Vehicle ownership in Tier-2 and Tier-3 cities is increasing at a rate of 12% annually, outpacing the plateauing metros and creating dispersed demand nodes across the India oil and gas downstream market.[1] Indian Oil Corporation plans to establish 5,000 new rural retail outlets by 2026, targeting these growth centers. Middle-class purchasing power is also driving the consumption of premium lubricants and specialty products, thereby boosting per-unit margins for retailers. Aviation turbine-fuel demand mirrors this trend as passenger numbers are set to double by 2030, further underpinning jet-fuel cracks. Together, these dynamics strengthen revenue visibility for refiners and marketers, supporting fresh investments in storage, logistics, and customer-facing technologies.
Bharat Stage-VI Compliance Capex
Sector-wide capex topping USD 15 billion has upgraded hydrotreaters, catalytic reformers, and blending systems to comply with BS-VI sulfur limits. Hindustan Petroleum’s Vizag refinery alone invested USD 1.2 billion, completing upgrades ahead of peers and freeing funds for capacity growth in the India oil and gas downstream market.[2] Early movers now sell premium BS-VI fuels domestically and export to sulfur-stringent markets, widening gross-refining margins. Smaller refiners face a capital-access squeeze and are considering joint ventures or mergers to dilute compliance costs. The regulatory milestone consequently accelerates industry consolidation and the diffusion of technology.
Hydrogen & Bio-Fuels Blending Push
India’s 20% ethanol mandate, effective 2025, drives the creation of storage, blending, and quality-control assets compatible with higher biofuel ratios.[3] Indian Oil Corporation has earmarked USD 2 billion for 1,000 compressed-biogas plants by 2027, positioning the company as a multi-fuel supplier. The National Green Hydrogen Mission aims to achieve 5 million tonnes of annual production by 2030, creating opportunities for refiner-run electrolysis units that leverage captive renewables and desalinated water. While feedstock pricing remains volatile, government purchase incentives and global interest in green ammonia offtake provide revenue certainty and diversify the India oil and gas downstream market.
Digital Refinery OPEX Optimization
Partnerships such as HPCL-Mittal Energy and AVEVA deploy AI-enabled digital twins to reduce unplanned downtime and cut operating costs by 15%.[4] Predictive maintenance applications extend equipment life, while advanced process controls maximize energy efficiency, shaving several dollars per barrel off manufacturing cost. Blockchain pilots are enhancing product traceability, a growing requirement for aviation-grade fuel and petrochemical exports. Consequently, digital spend is being capitalized as a competitive edge rather than pure overhead, accelerating ROI cycles and attracting investor attention toward technologically mature players.
Restraints Impact Analysis*
| Restraint | (~) % Impact on CAGR Forecast | Geographic Relevance | Impact Timeline |
|---|---|---|---|
| Capex overruns & delays | -0.70% | National, affecting major expansion projects | Medium term (2-4 years) |
| Margin volatility vs crude prices | -0.50% | National, with higher impact on smaller refiners | Short term (≤ 2 years) |
| ESG / net-zero capital flight | -0.40% | National, with focus on coal-dependent regions | Long term (≥ 4 years) |
| EV adoption biting gasoline demand | -0.30% | Metro cities and EV adoption corridors | Long term (≥ 4 years) |
| Source: Mordor Intelligence | |||
Capex Overruns & Delays
Project delays averaging 18–24 months and cost overruns up to 40% plague greenfield and expansion schemes, straining balance sheets and diluting forecast capacity additions in the India oil and gas downstream market. Environmental clearances, land acquisition disputes, and skilled labor shortages emerge as the primary bottlenecks. Bharat Petroleum’s Bina expansion, for instance, slipped 30 months and ballooned to USD 4.1 billion, eroding IRR assumptions. Financing costs rise with each schedule slippage, curtailing dividend flexibility and nudging boards toward more conservative investment pacing or asset-light partnerships.
Margin Volatility vs. Crude Prices
Rapid crude swings compress refinery gross-processing spreads, especially for simple refineries lacking residue-conversion units. Smaller players with limited trading desks struggle to hedge effectively, leading to cash-flow shocks and inventory-loss accounting when prices whipsaw. Integrated operators counter this risk through petrochemical-linked offtake contracts and hedging strategies, but volatility remains a drag on sector-wide profitability.
*Our forecasts treat driver/restraint impacts as directional, not additive. The impact forecasts reflect baseline growth, mix effects, and variable interactions.
Segment Analysis
By Type: Capacity Dominated by Refineries While Petrochemicals Accelerate
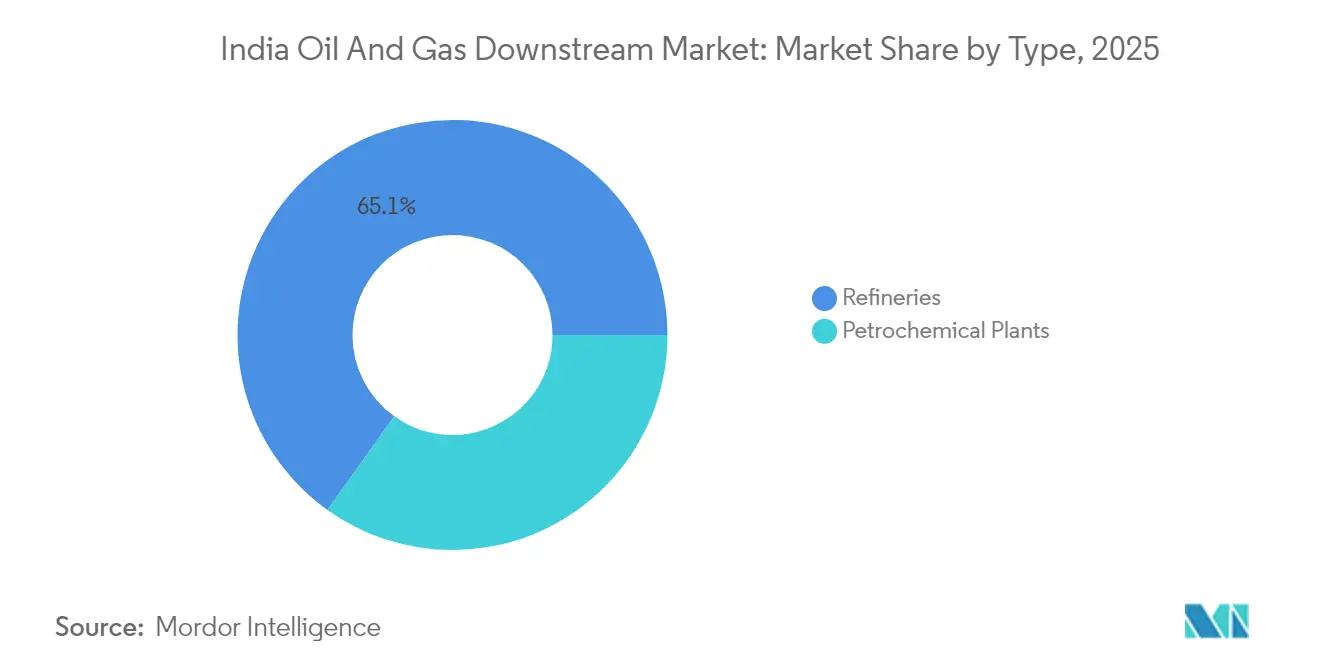
Refineries account for 65.12% of India's oil and gas downstream market share in 2025, reflecting the long-standing government emphasis on energy security through import-substitution refining. Jamnagar alone processes more than 1.3 million barrels per day, underpinning India's status as a net product exporter. This segment benefits from additional residential upgrading investments that increase diesel and jet-fuel yields and support lucrative exports to Europe and Africa. However, petrochemical plants—though smaller in base—are set to log a 7.22% CAGR to 2031, driving the fastest volumetric expansion across the India oil and gas downstream market.
The push toward integrated O2C complexes allows operators to toggle feedstocks between fuels and chemicals based on margin signals. ONGC Petro Additions Limited's Dahej complex exemplifies such flexibility, channeling refinery naphtha into polymer chains that command higher spreads compared to simple distillates. Technology upgrades under the Petroleum and Explosives Safety Organisation framework improve process safety, further strengthening investor confidence in new chemical units adjacent to legacy refineries.

By Product Type: Refined Fuels Dominate as Petrochemicals Surge
Refined petroleum products held 67.54% share of the India oil and gas downstream market size in 2025, led by diesel for freight transport and gasoline for a growing vehicle fleet. BS-VI premium fuel sales and middle-class lubricant upgrades buoy the segment even as efficiency gains temper volume trajectories. In contrast, petrochemicals’ 6.94% CAGR through 2031 positions chemicals as the structural growth pillar, reflecting the manufacturing renaissance spurred by domestic value-addition incentives.
Polymer-grade propylene and specialty aromatics gain prominence as plastic-processing, textile, and automotive clusters proliferate. Reliance’s O2C strategy secures feedstock integration, enabling seamless naphtha transfer from the CDU to the cracker, thereby maximizing margin capture. Meanwhile, ESG frameworks stimulate investment in cleaner production methods such as low-emission ethane crackers and carbon-capture-ready aromatics units.
By Distribution Channel: Retail Dominance With Digital Evolution
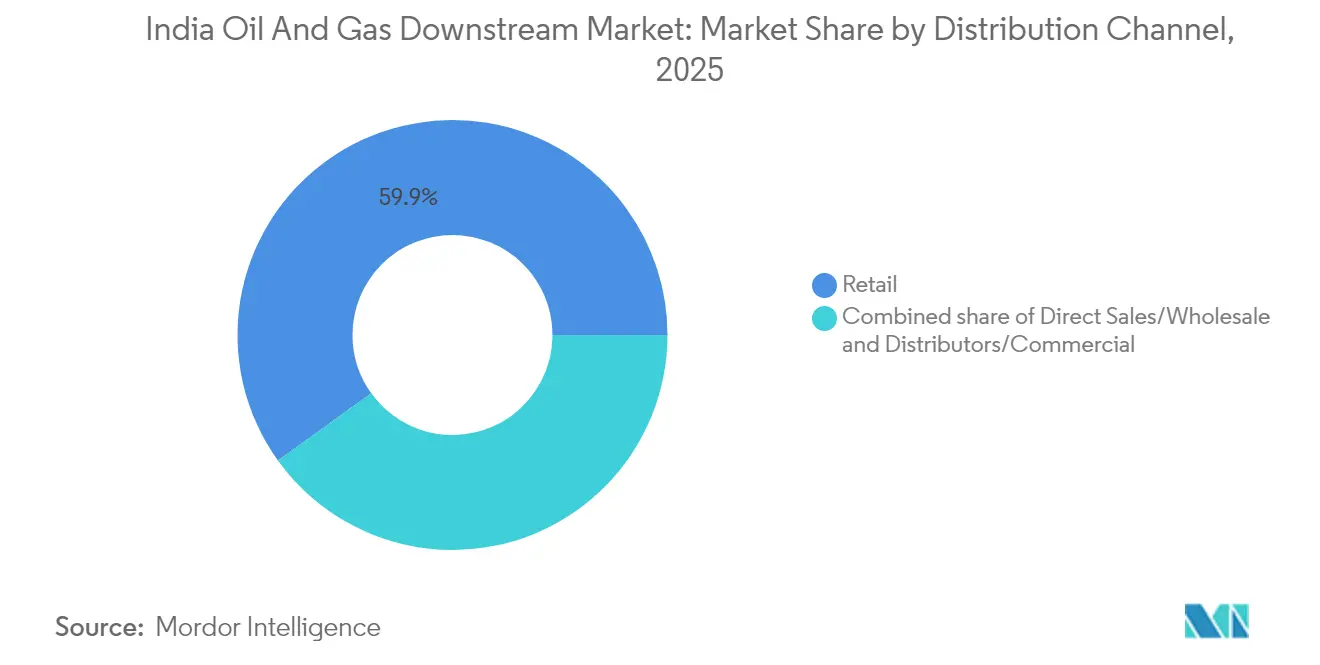
Retail fuel outlets captured 59.92% share of the India oil and gas downstream market size in 2025, a testament to the country’s sprawling highway network and dispersed urbanization. Direct-sales contracts service large industrial accounts, whereas independent dealers sustain hinterland availability. Digital transformation is elevating operational efficiency—Indian Oil’s nationwide rollout of IoT-enabled dispensers provides real-time inventory and quality monitoring, reducing shrinkage and enhancing billing transparency. Retail sites increasingly bundle compressed natural gas, EV charging, and biofuel blends, future-proofing forecourt relevance.
Wholesale channels navigate thinner margins but benefit from volume stability through contract markets, such as railways, defense, and state transport units. Distributor-led secondary logistics remain crucial for remote districts, though their margin stack is under pressure from rising fuel logistics costs and increasing digital disintermediation.
Geography Analysis
Gujarat leads the India oil and gas downstream market with more than 2 million barrels per day refining capacity anchored by the coastal Jamnagar and Vadinar complexes. Maharashtra follows, leveraging the Mumbai–Pune petrochemical corridor that supports the demand for specialty chemicals in automotive and consumer goods manufacturing. Northern belt states consume substantial volumes of diesel for agriculture and trucking, thereby sustaining refinery output from Mathura, Panipat, and Bathinda.
Southern states—including Tamil Nadu, Karnataka, and Telangana—are emerging as petrochemical hotspots, propelled by electronics, textile, and pharma clusters. This shift drives storage-terminal development at Ennore and Krishnapatnam ports, which shortens supply lead times and lower domestic freight costs. Eastern India’s downstream template is evolving; Assam’s crude output and Numaligarh Refinery’s expansion promise regional self-sufficiency, while West Bengal’s industrial base presents demand opportunities despite infrastructural gaps.
The geographically varied environmental regulations shape investment behavior; coastal refineries face stringent marine-emission norms, whereas inland units confront air-quality directives targeting particulate matter. Consequently, capital-budget allocation differs by state, introducing complexity to cross-portfolio optimization strategies for multi-location refiners.
Regulatory Landscape
India's downstream oil and gas activity is governed by a mix of central policy and statutory regulation, led by the Petroleum and Natural Gas Regulatory Board (PNGRB) under the PNGRB Act, 2006. This covers transportation, distribution, marketing, and sale of petroleum products and natural gas (excluding upstream crude production). Compliance requirements continue to tighten across product quality, pipeline/CGD technical standards, and customer-facing service obligations. PNGRB (Consumer Protection) Regulations, 2025, formalize grievance redressal, escalation, and turnaround times, pushing oil marketing companies and gas distributors to strengthen customer service systems and digital monitoring.
Recent updates also steer fuel specifications, safety, and approvals that feed through to refinery and marketing operations. E20 (20% ethanol-blended motor spirit) became mandatory nationwide in April 2026 with a minimum 95 RON requirement, increasing blending, storage, and quality-control demands across the supply chain. Safety compliance also saw updates through PESO notifications in March 2026, including revised handling norms for PDS SKO at designated service stations. In parallel, PNGRB has continued to amend its rulebook for network authorizations and tariffs through 2025 amendments (CGD and natural gas pipeline regulations), shaping the economics and timelines for last-mile fuel and gas infrastructure additions supporting downstream distribution.
Competitive Landscape
Market concentration is at a moderate level, with Indian Oil, Bharat Petroleum, Hindustan Petroleum, and Reliance Industries controlling the majority of refining and retail assets. State-owned enterprises safeguard national energy security through broad depot and pipeline coverage, whereas Reliance pushes the envelope in terms of process complexity and export orientation. Nayara Energy and HPCL-Mittal Energy bring private-sector dynamism, scaling capacity through brownfield expansions and technology partnerships.
Differentiation now hinges on integration depth, digital maturity, and carbon transition readiness, rather than mere throughput. AI-driven predictive maintenance, blockchain-powered supply chain validation, and customer experience applications weigh heavily in investment narratives. Niche players exploit whitespace in specialty chemicals, biofuels, and green-hydrogen off-take agreements, circumventing head-to-head competition with incumbents. The Petroleum and Natural Gas Regulatory Board’s transparent pipeline tariff regime and open-access rules facilitate new entrant participation without compromising system integrity.
India Oil And Gas Downstream Industry Leaders
-
Indian Oil Corporation Limited
-
Bharat Petroleum Corporation Limited
-
Hindustan Petroleum Corporation Limited
-
Reliance Industries Limited
-
Nayara Energy Limited
- *Disclaimer: Major Players sorted in no particular order
Market Opportunities and Future Outlook
A core opportunity is the build-out of integrated refinery-cum-petrochemical capacity, along with the logistics needed to move higher volumes of fuels and chemical feedstocks across regions. A concrete signal is the July 2026 dedication of HPCL Rajasthan Refinery Limited's 9 MMTPA greenfield integrated refinery-cum-petrochemical complex at Pachpadra, which points to a shift toward value-added molecules beyond transport-fuel growth. Alongside new complexes, brownfield expansion programs create demand for debottlenecking, turnaround services, catalysts, utilities, and tankage. Indian Oil Corporation is also signaling a multi-site expansion program across Panipat, Vadodara, and Barauni, targeting a combined refining capacity of 98.05 MMTPA by late 2026.
In distribution and market access, pipeline-connected terminals and multi-product pipelines support whitespace for storage, secondary logistics, and digitally enabled retail replenishment models. For instance, Indian Oil's commissioning of the Malkapur pipeline terminal in Telangana (linked to the Paradip-Hyderabad pipeline) reflects continued investment in inland evacuation and supply security for both retail and bulk customers. Nationwide E20 implementation (effective April 2026) increases demand for ethanol-compatible blending infrastructure and quality systems at depots and outlets. At the same time, government interventions such as refinery margin caps shape an operating environment where integrated players, higher conversion complexity, and flexible product slates can help protect downstream cash generation.
Recent Industry Developments
- July 2026: Indian Oil Corporation Limited reaffirmed commissioning plans for major capacity expansion projects at its Panipat, Vadodara, and Barauni refineries by November-December 2026, targeting total refining capacity of 98.05 MMTPA. The program concentrates new throughput in established hubs, supporting domestic supply security and strengthening the export optionality of refined products.
- June 2026: Hindustan Petroleum Corporation Limited restarted the crude distillation unit at HPCL Rajasthan Refinery Limited after repairs following a localized fire in April 2026. The restart restored a key processing step at a strategically important integrated complex as new capacity ramps up.
- October 2025: Shipping Corporation of India Limited signed an MoU with BPCL, HPCL, and IOCL to jointly acquire, own, and operate crude oil tankers for transporting petroleum and petrochemical cargo internationally and along the Indian coast. This collaboration targets tighter control over maritime logistics for crude and products, reducing exposure to freight volatility for large refiners and marketers.
Research Methodology Framework and Report Scope
Market Definition and Coverage
For this methodology, the India oil and gas downstream market covers revenue linked to refining and the marketing and distribution of petroleum products, plus downstream petrochemical output within India, tracked in current USD.
Scope exclusions: We exclude upstream production value and midstream-only pipeline transmission revenue unless it is bundled into downstream marketing and distribution services.
Segmentation Overview
- By Type
- Refineries
- Petrochemical Plants
- By Product Type
- Refined Petroleum Products
- Petrochemicals
- Lubricants
- By Distribution Channel
- Direct Sales/Wholesale
- Distributors/Commercial
- Retail
Data Sources, Market Sizing, and Validation
Desk Research
Desk research started by laying out how India downstream activity moves from refinery throughput into wholesale and retail supply, and then linking it to public indicators that can be updated each year. We relied on sources such as the Ministry of Petroleum and Natural Gas and the Petroleum Planning and Analysis Cell for sector statistics, product demand signals, and price reference series, which help keep the model grounded.
To cross-check capacity and operational context, we also used sources such as the Oil Industry Safety Directorate, Open Government Data portals, customs trade statistics for imports and exports of refined products, and peer reviewed energy journals for policy and technology impacts (such as fuel-quality upgrades). Company annual reports, investor presentations, and reputed press were used to confirm project timing and operating changes, and selected paid subscriptions for company financials, news and financials, and shipment-level import or export checks helped fill disclosure gaps. These examples are indicative only, and many other sources were also referred to for collection, validation, and clarification.
Primary Interviews and Surveys
Primary interviews and surveys were used to confirm how much capacity is actually utilized, how the product slate shifts between transport fuels and petrochemical feedstocks, and how channel mix changes the realized downstream value. We spoke with a mix of refinery and marketing-side stakeholders, distributors and logistics-linked participants, and downstream buyers across key consumption corridors in India, and their inputs were then used to verify assumptions and close data gaps.
Distribution of primary research fieldwork respondents
| Company type | Respondent position |
|---|---|
| Top tier: 26% | CXOs: 12% |
| Mid tier: 55% | Functional/Unit leaders: 37% |
| Smaller Players: 19% | Managers: 51% |
Market-Sizing & Forecasting
Sizing used a top-down and bottom-up blend, where India-level downstream value is reconstructed from refinery capacity and utilization signals, refined product demand, and observed pricing and margin movement, and then expressed in current USD. The total was then corroborated with selective bottom-up approximations, such as sampled roll-ups from public financial disclosures and channel checks that combine indicative volumes with practical average price assumptions.
Key inputs included refinery throughput and capacity additions, demand indicators for major fuels, crude and product price spreads that influence realized downstream value, the timing of fuel quality and blending shifts that change product mix, and the import-export balance for refined products that can swing domestic availability. For forecasting, scenario analysis was used so different demand and margin environments could be reflected, and the final path was aligned to expert expectations on utilization, product mix, and policy timing. Where bottom-up visibility was limited for smaller operators, gaps were handled through ratio-based scaling using observable capacity, outlet counts, and channel intensity, and then re-checked against national totals for reasonableness.
Data Validation & Update Cycle
Outputs were checked against independent signals such as changes in refining capacity, direction of fuel demand, and trade flows, and then anomalies were reviewed before numbers were finalized. If the model showed sharp year-on-year changes, assumptions were revisited and respondents were re-contacted when needed so the shift could be confirmed as operational or corrected.
A multi-step internal review is followed so units, conversions, and series links stay consistent across years, and sign-off happens only after variance checks are cleared. Reports are refreshed annually, with interim updates for material events, and a final pre-delivery pass is completed so clients receive the latest updated view.
Mordor Intelligence's India Oil and Gas Downstream Market Size Compared With Other Published Estimates
Published numbers for India oil and gas downstream can look far apart because firms often include different activities, and because volume and pricing assumptions are not always built from the same operational signals. Differences also come from whether totals are tied to utilization and product demand indicators, or whether they lean more on broad value-chain spending and full fuel sales value.
The main gap comes from whether downstream is treated as a focused pool around refining, marketing, and petrochemical output, or whether large pass-through fuel sales value and adjacent infrastructure is counted in full. In Mordor Intelligence modeling, refinery capacity utilization and product demand checks are used to keep the value tied to operating activity, and items like upstream production value sit outside scope.
Benchmark comparison
| Source | Market Size | Gaps in Research Methodology |
|---|---|---|
| Mordor Intelligence | USD 5.11 B (2025) | |
| Industry Publisher A | USD 347.00 B (2024) | This figure appears to treat downstream closer to the full value of refined fuels and related activity, which can inflate totals when pass-through sales value and wider infrastructure coverage are included. |
| Global Publisher B | USD 282.40 B (2026) | The estimate uses a wider downstream definition and a longer horizon, and it likely applies different price and margin progression assumptions, which can shift the modeled value upward even when core volumes are similar. |
The comparison shows that scope and value construction choices drive most of the spread, especially whether pass-through fuel sales value is counted or whether the model stays anchored to utilization and demand signals. By keeping steps traceable to capacity, product mix, and consistent currency timing, the sizing remains repeatable and easier to review when new operating data is released.
Key Questions Answered in the Report
How large is the India oil and gas downstream market in 2026?
The India oil and gas downstream market size is USD 5.36 billion in 2026, projected to reach USD 6.81 billion by 2031.
What CAGR is expected for India's downstream sector between 2026 and 2031?
The market is forecast to post a 4.89% CAGR over 2026-2031.
Which segment is growing fastest within India's downstream value chain?
Petrochemical plants are expected to grow at 7.22% CAGR through 2031, outpacing traditional fuel refining.
What role does BS-VI fuel compliance play in market growth?
BS-VI regulations triggered over USD 15 billion in refinery upgrades, enabling higher-quality fuel output and spurring efficiency gains.
How is rising EV adoption affecting gasoline demand?
EV penetration could displace up to 20% urban gasoline demand by 2031, prompting refiners to shift focus toward jet fuel, marine bunkers and petrochemicals.
Which states house the largest refining capacities in India?
Gujarat leads with Jamnagar and Vadinar complexes, followed by Maharashtra and northern belt facilities such as Mathura and Panipat.