
Market Overview
| Study Period | 2020 - 2031 |
|---|---|
| Forecast Data Period | 2026 - 2031 |
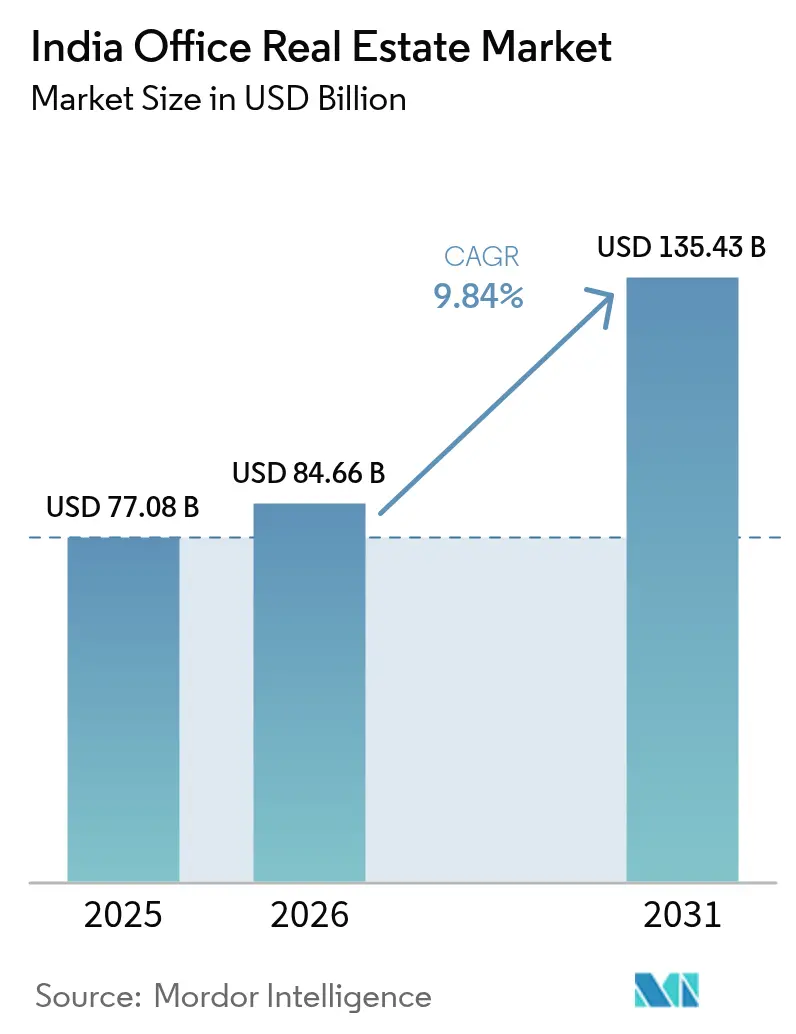
| Base Year Market Size (2025) | USD 77.08 Billion |
| Market Size (2026) | USD 84.66 Billion |
| Market Size (2031) | USD 135.43 Billion |
| Growth Rate (2026 - 2031) | 9.84 % |
| Market Concentration | Medium |
Major Players *Disclaimer: Major Players sorted in no particular order Image © Mordor Intelligence. Reuse requires attribution under CC BY 4.0. | |
India Office Real Estate Market Analysis by Mordor Intelligence
India office real estate market size in 2026 is estimated at USD 84.66 billion, growing from 2025 value of USD 77.08 billion with 2031 projections showing USD 135.43 billion, growing at 9.84% CAGR over 2026-2031. Healthy demand from Global Capability Centers (GCCs), an institutional investment surge to USD 8.9 billion in 2024, and supportive programs such as the Smart Cities Mission together underscore an ecosystem that rewards Grade A development and flexible leasing formats. Multinational corporations continue to anchor growth by favoring sustainability-certified, tech-enabled buildings that align with decarbonization goals. The government’s national corridor program and metro expansions are elevating inter-city connectivity, while the rapid spread of PropTech platforms is streamlining leasing and asset management.
Key Report Takeaways
- By building grade, Grade A stock commanded 60.75% of the India office real estate market share in 2025 and is forecast to post a 10.63% CAGR through 2031.
- By transaction type, rental models held an 82.10% share of the India office real estate market size in 2025 and are projected to expand at a 10.79% CAGR between 2026 and 2031.
- By end use, IT/ITeS accounted for 37.15% of 2025 demand, while the Other Services cluster is advancing at an 11.01% CAGR to 2031.
- By city, Bengaluru led with 22.55% of 2025 absorption; Hyderabad is the fastest-growing market, set for an 11.41% CAGR to 2031.
Note: Market size and forecast figures in this report are generated using Mordor Intelligence’s proprietary estimation framework, updated with the latest available data and insights as of 2026.
India Office Real Estate Market Trends and Insights
Drivers Impact Analysis*
| Drivers | (~) % Impact on CAGR Forecast | Geographic Relevance | Impact Timeline |
|---|---|---|---|
| Expansion of IT/ITeS, BFSI, and GCCs | +2.8% | Bengaluru, Hyderabad, Mumbai, Chennai | Medium term (2-4 years) |
| Multinational demand backed by talent and cost edge | +2.1% | Major metros and emerging tier-2 hubs | Medium term (2-4 years) |
| Growth of Grade A stock in key metros | +1.9% | Tier-1 cores, spillover to NCR & South | Long term (≥ 4 years) |
| Shift to sustainability-certified, tech-enabled offices | +1.4% | Early adoption in Mumbai, Bengaluru, NCR | Long term (≥ 4 years) |
| Smart Cities & corridor infrastructure | +1.2% | Designated smart cities & industrial corridors | Long term (≥ 4 years) |
| Source: Mordor Intelligence | |||
Growth of Grade A Office Stock in Bengaluru, Hyderabad, and Gurugram
Institutional landlords injected a 33% YoY lift in new Bengaluru completions during Q3 2024, even as Hyderabad deliveries fell 25% amid a cautious recalibration. Delhi-NCR saw a 360% supply spike linked to expressway upgrades, accelerating Gurugram’s appeal for global tenants. Grade A space increasingly bundles wellness zones, renewable energy systems, and smart access control, features that command rental premiums sufficient to offset USD 33.5 per sq ft construction costs. The long-cycle supply pipeline embedded in these metros should keep vacancy tight in prime corridors yet intensify land-parcel competition for developers.
Strong Demand from Multinationals Supported by Cost Edge and Talent
Google’s 1.6 million sq ft Ananta campus in Bengaluru demonstrates how foreign firms now treat India as a strategic R&D base rather than a back-office node. Embassy REIT’s 800,000 sq ft lease with Commonwealth Bank, plus a 600,000 sq ft expansion option, underlines sustained faith in local growth prospects. MNCs increasingly chase talent specializing in AI, cybersecurity, and blockchain, spurring purpose-built assets across Jaipur, Coimbatore, and other tier-2 locales. Government upskilling schemes reinforce the supply of niche skills, narrowing the capability gap with OECD peers. The confluence of talent and cost economics adds 2.1 percentage points to the long-term growth curve.
Increasing Adoption of Sustainability-Certified and Tech-Enabled Offices
India ranked third worldwide for LEED certification in 2023, with more than 5,155 projects spanning 3.18 billion sq ft. Lodha Group’s One Lodha Place, run entirely on renewable energy, signals that ESG credentials have shifted from nice-to-have to must-have for anchor tenants. The Bureau of Energy Efficiency’s updated Star Rating index now covers 250+ buildings, raising transparency on operational performance. Occupancy analytics, IoT sensors, and predictive maintenance tools increasingly appear in lease RFPs, sharpening PropTech’s addressable opportunity toward USD 1 trillion by 2030. These factors contribute roughly 1.4 percentage points to aggregate CAGR[1]Siddheshwar Prasad, “2024 Building Energy Performance Standards for Office Buildings,” Bureau of Energy Efficiency, beeindia.gov.in.
Government Initiatives Elevating Demand
The Smart Cities Mission completed more than 3,800 projects worth USD 17.1 billion by 2024, layering urban amenities that reinforce office demand nodes. Thirty-two trunk-infrastructure corridors promise smoother freight and commuter flows across 11 routes nationwide, shrinking travel time between industrial hubs. Faster permits under the National Single-Window System and special incentives for data-center clusters have narrowed execution risk for developers. Such policy scaffolding lifts demand outlook by an estimated 1.2 percentage points over the forecast horizon[2]Hardeep Singh Puri, “Smart Cities Mission Project Status Report 2024,” Ministry of Housing & Urban Affairs, smartcities.gov.in.
Restraints Impact Analysis*
| Restraints | (~) % Impact on CAGR Forecast | Geographic Relevance | Impact Timeline |
|---|---|---|---|
| Regulatory delays & land acquisition hurdles | -2.1% | Maharashtra, Telangana, pan-India | Medium term (2-4 years) |
| Supply-demand mismatch in select submarkets | -1.8% | Hyderabad, pockets of Bengaluru & Pune | Short term (≤ 2 years) |
| Rising construction & financing costs | -1.6% | Tier-1 cores | Short term (≤ 2 years) |
| Source: Mordor Intelligence | |||
Regulatory Delays and Land Acquisition Challenges
Legal disputes on small land parcels delayed the Delhi-Dehradun Expressway, spotlighting how fragmented title records can stall large-scale projects. Metro 5 in Mumbai has secured just 40% of the 27 hectares required, illustrating acquisition hurdles that ripple into office supply timetables. The nationwide Registration Bill 2025 aims to digitize records, but transition friction may initially slow approvals. Sudden guideline shifts, such as a 100-400% revision in Telangana guidance values, alter feasibility math mid-project. These layers of uncertainty trim roughly 2.1 percentage points off forecast growth.
Rising Construction and Financing Costs
Average build cost escalated 39% in four years to USD 33.5 per sq ft, propelled by a 25% jump in labor charges in 2024 alone. Risk-adjusted returns have narrowed as benchmark lending rates hover above 9%, pushing some developers to postpone or phase out big-ticket ventures. Premium specifications such as triple-glazed façades and smart HVAC widen cost spreads between Grade A and legacy stock, reinforcing affordability issues for smaller occupiers. These pressures are expected to subtract 1.6 percentage points from near-term CAGR until cost inflation moderates[3]Nikhil Sawhney, “Construction Cost Inflation Tracker 2024,” Construction Industry Development Council, cidc.in.
*Our forecasts treat driver/restraint impacts as directional, not additive. The impact forecasts reflect baseline growth, mix effects, and variable interactions.
Segment Analysis
By Building Grade: Premium Specifications Drive Market Leadership
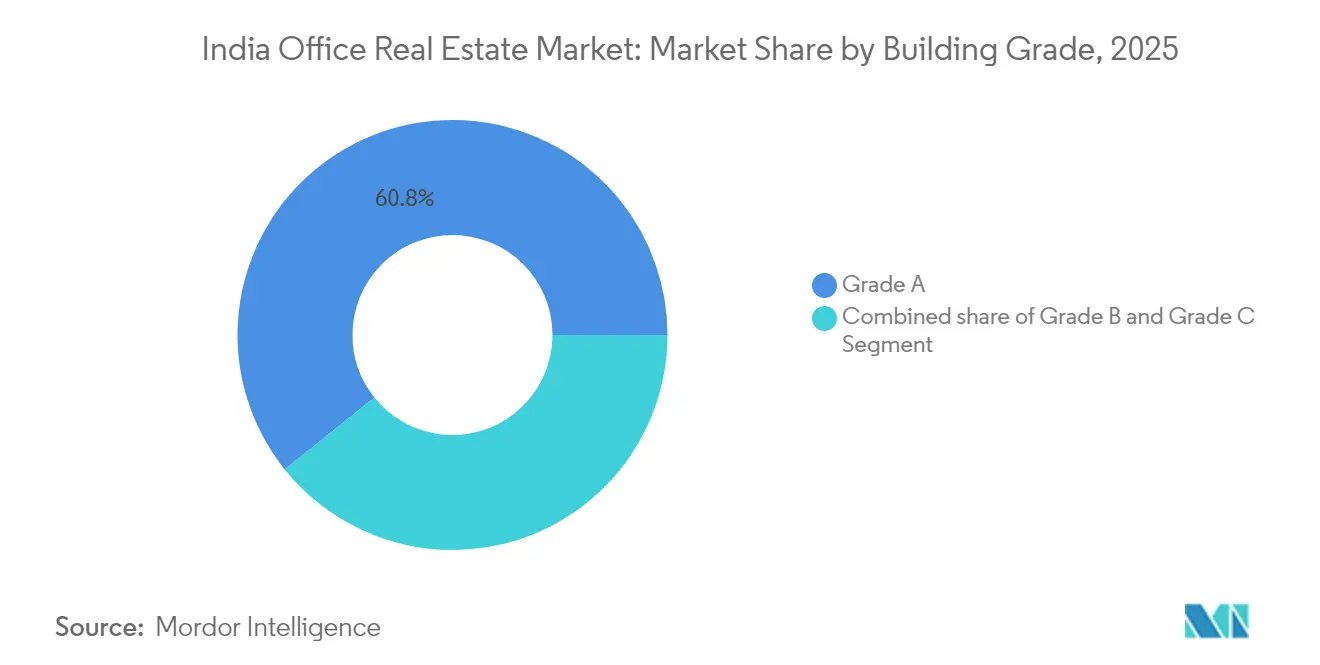
Grade A buildings held 60.75% of India's office real estate market share in 2025 and are expected to register a 10.63% CAGR, underpinning the India office real estate market size for high-spec assets through 2031. Institutional investors prefer buildings that meet LEED Platinum or BEE Star ratings, because such assets attract long-duration tenancy and compress vacancy risk. Embassy REIT’s lease of 800,000 sq ft to Commonwealth Bank and Google’s Ananta campus exemplifies tenant appetite for integrated campuses featuring renewable energy, advanced building management systems, and wellness amenities. Over time, the popularity of these features is likely to widen the rent gap between new Grade A and non-certified buildings, encouraging brownfield retrofits across older stock.
The India office real estate market benefits from a virtuous cycle in which premium rents justify higher development outlays, allowing developers to incorporate IoT sensors, smart access controls, and predictive maintenance. At the same time, smaller occupiers that cannot absorb rental premiums are migrating to managed flexible-workspace centers, expanding the sub-leasing ecosystem. If labor costs stabilize in 2026, conversion of select Grade B properties into quasi-Grade A spaces could emerge as a parallel strategy to meet mid-market demand without fresh land intake.


By Transaction Type: Rental Models Dominate Corporate Strategies
Rental contracts captured 82.10% of the India office real estate market size in 2025 and are forecast to grow at a 10.79% CAGR as companies safeguard capital flexibility in a volatile macro backdrop. REITs play a catalytic role, offering professionally managed stock with transparent governance that institutional occupiers favor. Occupancy in the largest listed vehicle averaged 95% across Bengaluru, Mumbai, and Chennai assets in 2024, underscoring limited frictional vacancy for premium space. Flexible lease provisions—shorter lock-ins, expansion options, and step-up clauses- are now standard, accelerating deal velocity.
Sales transactions remain relevant for owner-occupiers in highly regulated sectors that value control over building specs and data security. However, elevated land prices and the illiquidity premium attached to outright ownership limit the segment to niche requirements. Pending REIT listings worth USD 578 million should enlarge the stabilized rent-yield universe, further reinforcing the rental tilt of the India office real estate market.
By End Use: Technology Sector Leadership Faces Diversification Pressure
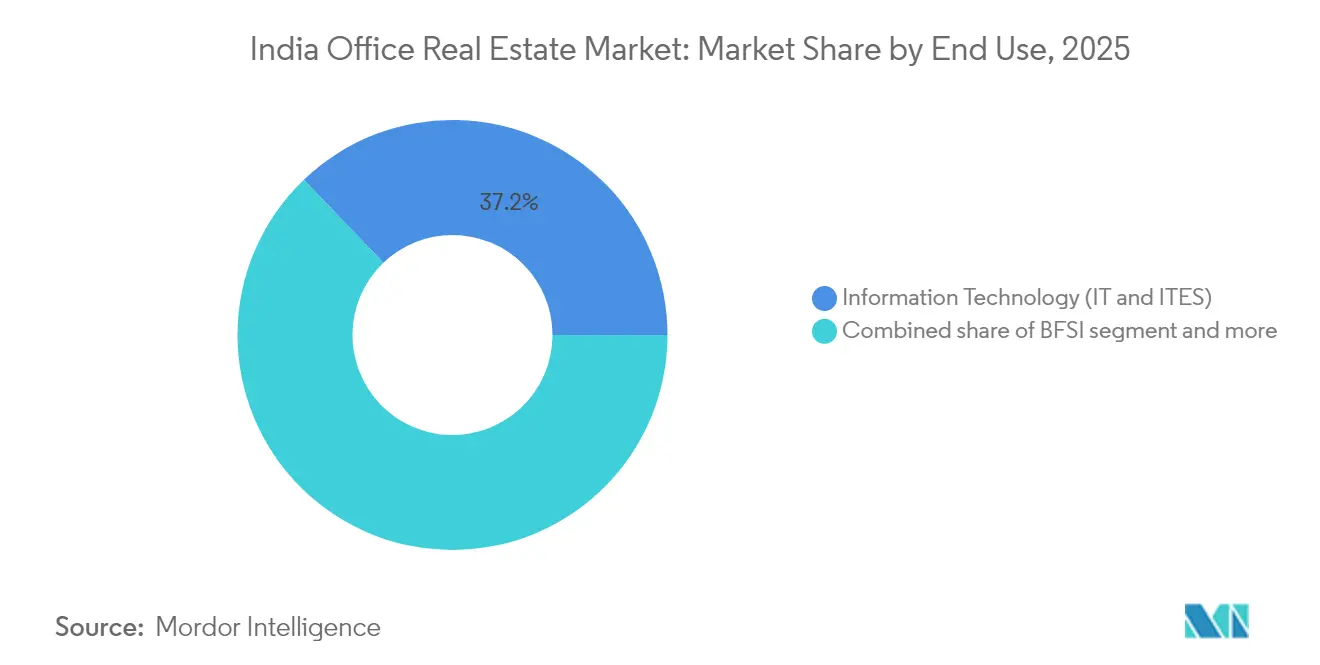
IT/ITeS still anchors 37.15% of 2025 demand for the India office real estate market, but its share is gradually being diluted by BFSI, consulting, and life-science tenants that require compliance-ready environments. The Other Services cluster is projected to advance at an 11.01% CAGR, supported by GCCs focused on AI, analytics, and cybersecurity. Sophisticated tenants seek buildings with redundant power, SCADA networks, and Tier III or better data resilience, standards traditionally associated with critical operations.
Technology players are upgrading from brownfield complexes to built-to-suit campuses that integrate collaboration zones, low-carbon materials, and employee well-being measures. Meanwhile, BFSI tenants often prioritize disaster-recovery proximity and higher floor-plate efficiency ratios. This segmentation shift prompts developers to adopt universal floor-core layouts and modular interior grids that permit rapid reconfiguration, preserving asset relevance over multi-cycle leasing horizons.
Geography Analysis
Bengaluru retained a 22.55% share of the India office real estate market in 2025, with premium corridors in Outer Ring Road and Whitefield operating at near-full capacity. The city delivered a 33% YoY lift in new stock during Q3 2024 yet maintained rent stability, illustrating strong tenant absorption. Infrastructure gaps, such as traffic congestion, are prompting municipal programs to widen arterial roads and expedite Metro-Phase II completion. High LEED adoption and renewable-energy procurement underscore the city’s ESG orientation, an increasingly critical selection criterion for multinationals.
Hyderabad is set to clock the fastest 11.41% CAGR, driven by proactive state policy, a maturing HITEC ecosystem, and lower rentals relative to Bengaluru. Infosys’ USD 90 million expansion in Pocharam and Amazon’s continued back-office scaling testify to occupier confidence. Yet, vacancy could touch 24% in 2025 as a supply bulge meets tempered net take-up, likely triggering modest rent corrections concentrated in older inventory. The state’s decision to re-rate property values upward by up to 400% may compress developer margins in the short term but signals belief in sustained demand.
Mumbai Metropolitan Region’s constrained 7.4 million sq ft pipeline sustains its premium, with CBD vacancy below 8% as of 2024. Delhi-NCR recorded a 360% jump in new supply thanks to expressway commissioning, but absorption pace will determine whether vacancy stabilizes below the 18% mark. Ahmedabad, Kochi, and Jaipur are emerging beneficiaries of geographic diversification, aided by the National Industrial Corridor Development Programme’s 32 projects that will integrate logistics nodes, reduce drive times, and feed future office clusters.
Regulatory Landscape
Office real estate development and leasing in India operates under a multi-layer regulatory framework led by the Real Estate (Regulation and Development) Act, 2016 (RERA), implemented through state Real Estate Regulatory Authorities (for example, MahaRERA, Punjab RERA, and Tamil Nadu RERA). For developers and intermediaries, state-level registration, prescribed disclosures, and continuing compliance filings shape project launch timelines and marketing practices. SEBI regulations govern listed REITs and institutional participation, reinforcing disclosure and governance standards for Grade A office portfolios.
Recent state actions point to tighter compliance and more digitized transparency. MahaRERA Order No. 46C/2025 (April 8, 2025) set specific norms for QR codes and registration-number display in advertisements. Punjab RERA also tightened documentation discipline in 2025 by requiring NOC-status submissions for revisions and extensions (effective July 1, 2025), along with Form 5 upload deadlines for FY 2024-25 (September 30, 2025). Alongside this, MoHUA programs such as PMAY-U 2.0 (implemented from September 1, 2024) and central policy workstreams referenced by NITI Aayog (2026) influence broader urban planning and infrastructure priorities that affect office-market catchments, even when they are primarily oriented toward housing outcomes.
Value Chain Analysis
The India office real estate value chain covers land aggregation and due diligence, planning and approvals, design and engineering, construction and fit-outs, leasing and transaction execution (including brokerage and flexible workspace operators), and ongoing facility management and asset operations (including energy management and tenant experience). REIT platforms and institutional landlords increasingly act as the center of stabilized Grade A supply, while occupiers (notably GCCs and large services firms) shape specifications around resilience, smart building systems, and sustainability certifications that then feed into design, procurement, and O&M requirements.
Execution certainty depends on (1) approvals and title clarity, (2) construction input and labor availability, and (3) leasing velocity in prime corridors. Demand pull shows up in large, long-tenor commitments and campus-scale developments, such as HSBCs 20-year pre-lease for 1.2 million sq ft at Prestige Groups JRC Signature Towers in Bengaluru (July 2026) and Embassys plan to build 3 million sq ft of office space in Bengaluru (June 2026). Digitalization is also moving upstream and downstream across the chain, with PropTech tools supporting site selection, project controls, and post-handover operations, aligning with the broader push for standardized transparency and lifecycle performance in Grade A assets.
Competitive Landscape
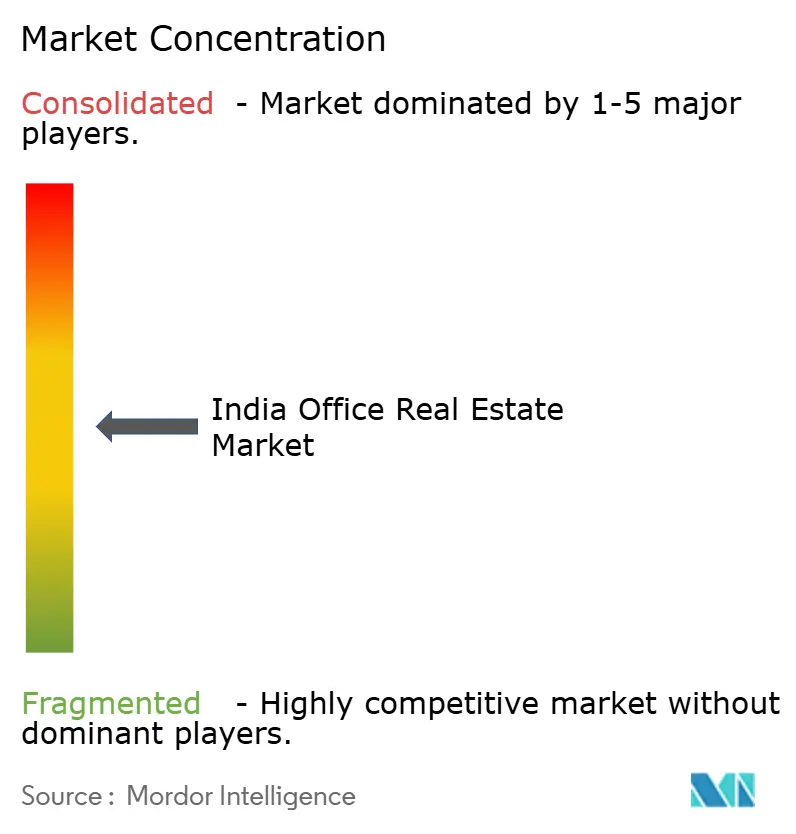
The India office real estate market is moderately fragmented, with a handful of large REIT platforms dominating at the national level while many regional developers continue to operate with city-focused portfolios. Market concentration is gradually increasing as major sponsors use their brand strength and access to low-cost capital to acquire stabilized assets and pursue platform-level consolidations. Embassy Group’s NCLAT-approved merger with Equinox India adds a USD 3.88 billion pipeline in Mumbai and NCR, moving the sponsor closer to a pan-India footprint.
Strategic playbooks emphasize platform scalability; for instance, Mindspace REIT is developing a 1 million sq ft data-center campus in Navi Mumbai, diversifying into digital infrastructure. Co-working operators are filing for IPOs, betting on rising hybrid-work penetration in tier-2 cities where supply of Grade A core space lags demand. PropTech startups aid incumbent landlords with space-planning algorithms and tenant-experience apps, but entrenched owner-developers still command the land banking advantage.
Regulation acts as both a gatekeeper and a moat. SEBI’s REIT norms enforce disclosure rigor, while RERA adds a compliance layer that deters under-capitalized entrants. As the next listing cycle unfolds, led by the USD 578 million Knowledge Realty Trust issue, the competitive canvas will likely polarize: institutional capital will coalesce around stabilized Grade A platforms, and niche developers will focus on adaptive-reuse or specialized assets such as life-science parks.
India Office Real Estate Industry Leaders
Indiabulls Real estate
DLF Limited
Prestige Estate Projects Ltd
Panchshil Realty
Cushman & Wakefield
- *Disclaimer: Major Players sorted in no particular order

Market Opportunities and Future Outlook
Demand-side whitespace is concentrated in large-format, compliance-ready Grade A campuses that support GCC expansion, long-tenor enterprise leases, and higher building-performance standards. Recent transactions show the scale of occupier requirements and provide anchors for campus-style supply planning: HSBC signed a 20-year pre-lease for over 1.2 million sq ft at Prestige Groups JRC Signature Towers in Bengaluru (July 2026), and Q2 2026 gross leasing reached 24.6 million sq ft (April-June), a record quarterly absorption figure. Together, these signals allow developers and landlords with land banks and permitting readiness in prime micro-markets to secure pre-leases and structure phased delivery, helping manage cost inflation and absorption risk.
On the supply and capital side, institutionalization is also creating room across the build-own-operate ecosystem, including REIT-suitable assets, brownfield upgrades that bring older stock closer to institutional-grade standards, and operating platforms that monetize energy and occupancy analytics. By end-2025, India had approximately 900 million sq ft of Grade A office stock, with about 141 million sq ft (around 17%) housed in REIT structures, leaving scope for additional stabilization, aggregation, and professional operations across non-REIT Grade A assets. Flexible and managed office formats continue to scale for mid-sized occupiers and as swing space, illustrated by IndiQubes 390,000 sq ft lease in Sector 142, Noida for its largest NCR campus (July 2026), which supports landlord leasing velocity and increases the appeal of plug-and-play, standardized tenant-experience inventory.
Recent Industry Developments
- July 2026: Prestige Estates Projects Ltd acquired a 50% stake in Advent Convention and Hotels International Ltd for INR 504 crore to develop a 1.5 million sq ft commercial project in Andheri East, Mumbai. The move deepens Prestiges commercial development pipeline in Mumbai Metropolitan Region, where high-quality office supply is constrained and well-located land parcels are difficult to secure.
- August 2025: Knowledge Realty Trust unveiled a USD 578 million REIT IPO covering a 46.3 million sq ft portfolio across six cities. The filing adds depth to Indias listed office-landlord universe and supports more transparent price discovery for stabilized Grade A assets and long-duration leases.
- March 2025: Cognizant divested its 13.68-acre headquarters site in Chennai to Bagmane Constructions for USD 73.7 million, with plans to redevelop into a 3 million sq ft office park. The transaction shifts a large corporate-owned parcel into a specialist developer pipeline, adding future Grade A supply potential in a major southern office market.


Research Methodology Framework and Report Scope
Market Definition and Coverage
For this study, we size India office real estate as the value generated from office buildings and office space transactions in India, covering rentals and sales activity across major office hubs and other active office locations.
Scope exclusions: We exclude residential, retail, hospitality, industrial and warehousing assets, along with land-only deals that are not tied to an office building.
Segmentation Overview
- By Building Grade
- Grade A
- Grade B
- Grade C
- By Transaction Type
- Rental
- Sales
- By End Use
- Information Technology (IT & ITES)
- BFSI (Banking, Financial Services and Insurance)
- Business Consulting & Professional Services
- Other Services (Retail, Life-science, Energy, Legal)
- By City
- Mumbai Metropolitan Region
- Delhi NCR
- Pune
- Bengaluru
- Hyderabad
- Chennai
- Kolkata
- Rest of India
Data Sources, Market Sizing, and Validation
Desk Research
Desk research started with building the demand and supply picture for office space in key Indian cities and mapping it to value. We relied on public, repeatable references such as Ministry of Statistics and Programme Implementation macro series, Reserve Bank of India releases, and Government of India infrastructure and urban transport updates (for corridors, metro additions, and business district access).
To anchor market signals, we also reviewed sources such as SEBI and stock exchange filings for listed developers and REITs, annual reports and investor decks, and published market notes from industry bodies such as CREDAI and RICS. Where trade flows or fit-out intensity were relevant as directional checks, we used an import-export shipment-level database as a secondary indicator, and we also referenced a paid company financials and news database to standardize revenues and cross-check timelines. These sources are illustrative, and many other public documents and datasets were also referred to for data collection, validation, and clarification.
Primary Interviews and Surveys
Primary interviews and surveys were used to confirm what the desk numbers could not show clearly, mainly effective rents, typical lease structures, tenant incentives, absorption pace, and how Grade A, B, and C buildings are being priced across cities. We spoke with developers, leasing teams, occupiers, brokers, facility managers, and investment participants across India, so the assumptions could be corrected city by city and then stitched back into one national view.
Distribution of primary research fieldwork respondents
| Company type | Respondent position |
|---|---|
| Top tier: 30% | CXOs: 15% |
| Mid tier: 54% | Functional/Unit leaders: 32% |
| Smaller Players: 16% | Managers: 53% |
Market-Sizing & Forecasting
Sizing was built using top-down and bottom-up logic, so we could stay consistent with public signals while keeping the model close to deal reality for Indian office space. In the top-down build, office stock and completions by key cities were combined with vacancy and absorption patterns to reconstruct the occupied area over time, which was then translated into value using effective rent levels and typical sale pricing for office assets.
To keep the model grounded, results were checked using selective bottom-up approximations such as sampled city-level rent roll ups, observed leasing volumes, and sanity checks on revenue pools visible through listed developer and REIT disclosures. Inputs used in the model included Grade A, B, and C mix by city, net absorption and vacancy movements, effective rents (after incentives), share of pre-leasing in new supply, and shifting occupier demand from segments like IT and IT-enabled services and BFSI. Where city data was missing for a smaller location, we filled gaps using corridor-level proxies from comparable cities, and then re-tested the output with interview feedback.
For forecasting, scenario analysis was applied around new supply pipelines and absorption speed, followed by an exponential smoothing pass on rent and vacancy series so short-term spikes did not overstate long-term trends. The final forecast path was adjusted only when multiple primary inputs consistently pointed to a different rent or occupancy trajectory.
Data Validation & Update Cycle
We validate outputs by triangulating the modeled value against independent signals, such as changes in office stock, leasing volumes, vacancy shifts, and disclosed rent realizations where available. Outliers are flagged, and the assumptions behind them are revisited before the model is signed off through more than one analyst review.
If the model shows unusual jumps in rent, absorption, or pricing that are not supported by public indicators, respondents are re-contacted and the city-level build is reworked until the variance is explainable. Reports are refreshed annually, with interim updates when material events change market direction, such as policy shifts, major pipeline revisions, or sharp financing moves. Before delivery, we do a fresh final pass so clients receive the latest updated view.
Mordor Intelligence's India Office Real Estate Market Size Compared With Other Published Estimates
Published estimates for India office real estate can differ even when they cover the same country, because the value is highly sensitive to what is counted as office, which cities are included, and whether the number is built from leasing flows, asset transaction values, or a mix of both.
The biggest gaps usually come from scope choices, like including only Grade A space in top cities versus including wider Grade B and C stock, and from how effective rents are treated (headline rents versus net rents after incentives). Currency conversion timing, base-year selection, and how quickly assumptions are refreshed after large leasing years can also move the total.
Benchmark comparison
| Source | Market Size | Gaps in Research Methodology |
|---|---|---|
| Mordor Intelligence | USD 77.08 B (2025) | |
| Global Consultancy A | USD 68.40 B (2025) | Often modeled mainly from prime Grade A leasing in a smaller set of top cities, with conservative vacancy and rent assumptions that can undercount wider city coverage and non-prime stock. |
| Industry Association B | USD 92.10 B (2025) | May blend office market activity metrics with broader commercial real estate value, and can apply higher effective rent or pricing uplifts without fully adjusting for incentives and vacancy differences by city. |
The table shows a clear spread, and in Mordor Intelligence's model the value is tied to rentals and sales across Grade A, B, and C office stock within the defined India city coverage, which avoids mixing in non-office assets while still capturing non-prime offices that contribute meaningful occupied area. When the same stock, occupancy, and effective rent logic is applied consistently across cities, the total becomes easier to trace and repeat, even as yearly leasing conditions shift.


Key Questions Answered in the Report
What was the value of the India office real estate market in 2026?
The market stood at USD 84.66 billion in 2026.
How fast will the India office market grow through 2031?
It is projected to expand at a 9.84% CAGR, reaching USD 135.43 billion by 2031.
Which city currently commands the largest share of office absorption?
Bengaluru leads with 22.55% of national absorption in 2025.
Why do multinational corporations prefer Grade A buildings?
Grade A assets offer sustainability certifications, advanced technology infrastructure, and low vacancy risk, aligning with ESG and talent objectives.
Page last updated on:


 Your data is secure and never sold or shared.


