
Market Overview
| Study Period | 2021 - 2031 |
|---|---|
| Forecast Data Period | 2026 - 2031 |
| Base Year Market Size (2025) | 77.40 Thousand MMSCM |
| Market Volume (2026) | 81.47 Thousand MMSCM |
| Market Volume (2031) | 105.28 Thousand MMSCM |
| Growth Rate (2026 - 2031) | 5.26 % |
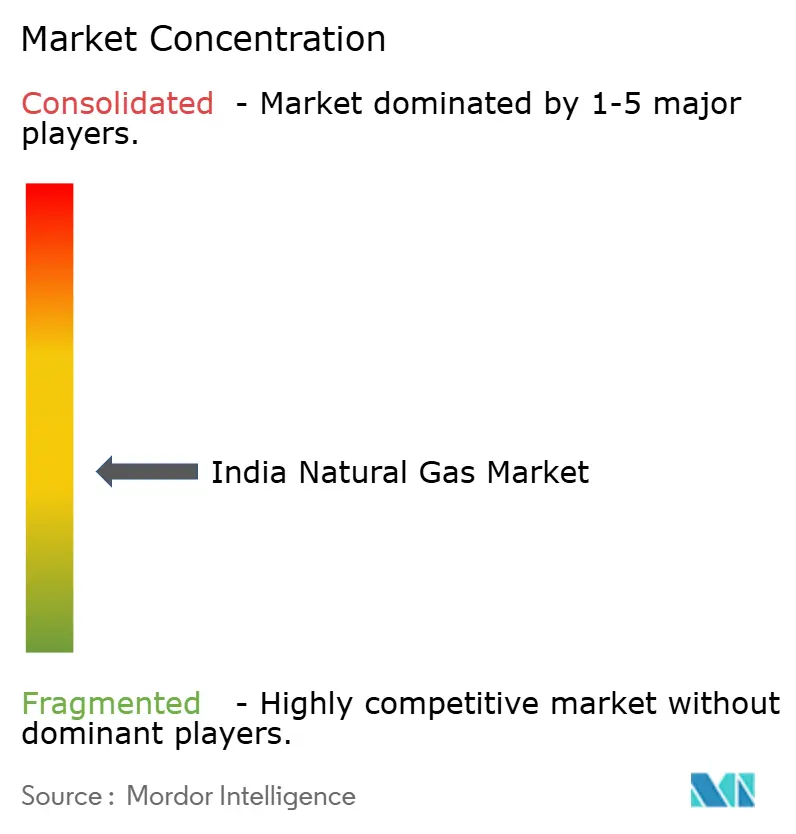
| Market Concentration | Medium |
Major Players *Disclaimer: Major Players sorted in no particular order Image © Mordor Intelligence. Reuse requires attribution under CC BY 4.0. | |
India Natural Gas Market Analysis by Mordor Intelligence
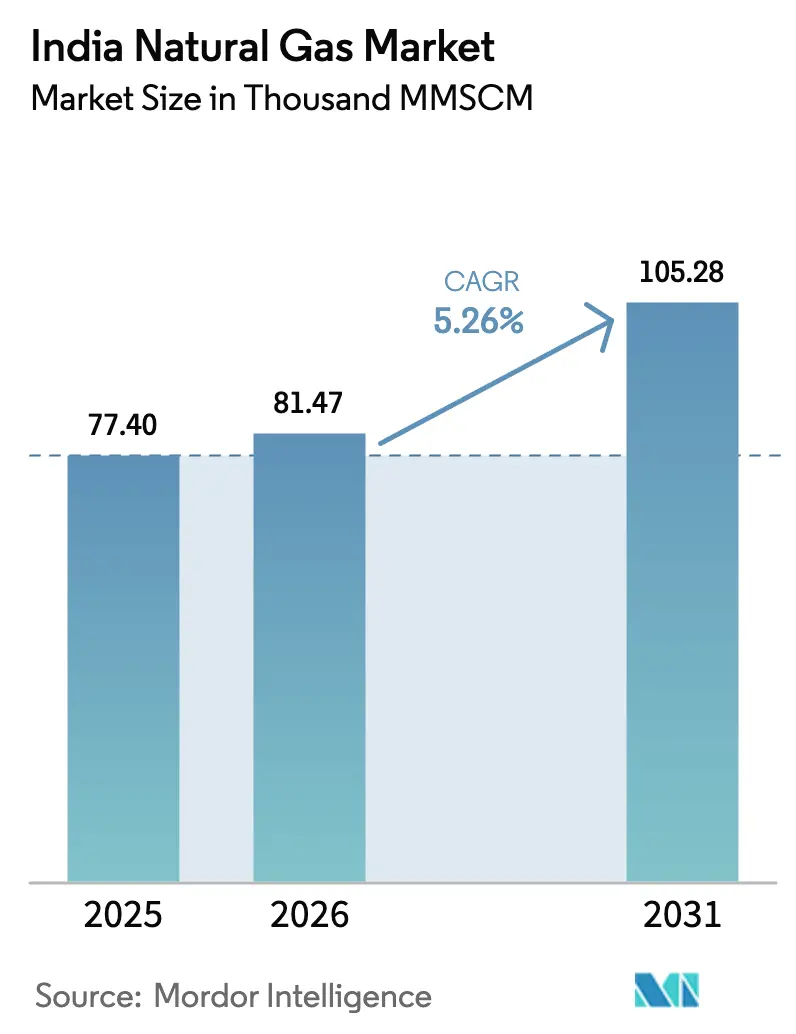
The India Natural Gas Market size was valued at 77.40 Thousand MMSCM in 2025 and estimated to grow from 81.47 Thousand MMSCM in 2026 to reach 105.28 Thousand MMSCM by 2031, at a CAGR of 5.26% during the forecast period (2026-2031).
Government plans to raise the fuel’s share in the primary energy mix from 6.7% to 15% by 2030 underpin this outlook, supported by USD 67 billion in trunk pipelines, LNG import terminals, and city-gas projects over the next six years [1]. Unified tariff adoption at INR 80.97/MMBTU, accelerated city-gas roll-outs across 307 geographical areas, and widening bio-CNG blending mandates add institutional momentum. LNG import capacity nearly doubling by 2026, an east-coast pipeline build-out, and industrial decarbonization incentives for steel, refining, and petrochemicals further broaden demand. Heightened exposure to global LNG prices, declining output from legacy domestic fields, and right-of-way delays on forest corridors moderate near-term growth, prompting industry players to diversify feedstock, restructure LNG contracts toward hub-based indices, and invest in storage as defensive strategies.
Key Report Takeaways
- By end-use sector, fertilizer production retained 28.60% of the India natural gas market share in 2025, while transportation is forecast to grow at a 6.78% CAGR through 2031.
- By type, compressed natural gas (CNG) accounted for 47.10% of the India natural gas market size in 2025 and is expected to expand at a 5.83% CAGR to 2031.
- By source, LNG imports captured 48.00% of the India natural gas market share in 2025 and will post a 5.86% CAGR over the forecast period.
- By geography, Gujarat and Maharashtra jointly contributed 35.70% of the India natural gas market size in 2025, while eastern states are set to register the highest 7.95% CAGR to 2031.
- By company concentration, GAIL, Petronet LNG, Gujarat Gas, Indraprastha Gas and Adani Total Gas together operated major share of pipeline and CGD assets in 2024.
Note: Market size and forecast figures in this report are generated using Mordor Intelligence’s proprietary estimation framework, updated with the latest available data and insights as of 2026.
India Natural Gas Market Trends and Insights
Drivers Impact Analysis*
| Driver | (~) % Impact on CAGR Forecast | Geographic Relevance | Impact Timeline |
|---|---|---|---|
| Expanding City Gas Distribution Network in Tier-2 & Tier-3 Cities | +1.2% | Gujarat, Maharashtra, Uttar Pradesh and other emerging urban centers | Medium term (2-4 years) |
| Fertilizer Sector’s Shift to Gas-Based Feedstock under Nutrient-Based Subsidy Reforms | +0.8% | Major fertilizer hubs nationwide | Short term (≤ 2 years) |
| LNG Contract Restructuring Linking Prices to Emerging Domestic Gas Hub | +0.6% | Coastal LNG terminals and national trade hubs | Long term (≥ 4 years) |
| Industrial Decarbonization Mandates for Steel & Refining Clusters | +0.7% | Odisha, Jharkhand, Gujarat industrial belts | Medium term (2-4 years) |
| Interstate Pipeline Connectivity via “One Nation, One Gas Grid” Policy | +0.9% | Eastern and northeastern states | Long term (≥ 4 years) |
| Emergence of Bio-CNG Blending Targets for CGD Operators | +0.4% | Rural agricultural states | Medium term (2-4 years) |
| Source: Mordor Intelligence | |||
Expanding City Gas Distribution Network in Tier-2 & Tier-3 Cities
Roll-outs across 307 areas aim for 12.6 crore PNG connections and 18,336 CNG stations by 2034, pushing the India natural gas market deep into smaller cities [2]. Gujarat Gas has earmarked INR 1,200 crore to hook 3.3 lakh new homes and 200 CNG outlets in FY25—an approach replicated by other distributors venturing beyond saturated metros. Urbanization trends, cleaner-fuel priorities, and standardized tariffs improve project viability, though low consumption density demands innovative last-mile models and long-term policy backing.
Fertilizer Sector’s Shift to Gas-Based Feedstock under Nutrient-Based Subsidy Reforms
The sector drew 31% of national demand in 2024 and remains insulated from LNG price swings through direct government support. Reforms channel APM and new-well gas to fertilizer plants, incentivizing a move away from naphtha and reinforcing supply security. Stable offtake from this price-inelastic segment cushions the India natural gas market against industrial fuel-switching cycles while anchoring infrastructure utilization.
LNG Contract Restructuring Linking Prices to Emerging Domestic Gas Hub
The Indian Gas Exchange has introduced delivery-based trading at Dahej, Hazira, and Odoru, enabling the discovery of transparent hub-linked prices. GAIL’s multi-supplier long-term deals and Petronet LNG’s 20-year extension with QatarEnergy illustrate diversified portfolios designed to decouple from volatile oil-indexed formulas. As liquidity builds, buyers gain leverage for flexible volumes and slope renegotiations that support downstream affordability.
Interstate Pipeline Connectivity via “One Nation, One Gas Grid” Policy
Operational length rose from 15,340 km in 2014 to 24,945 km by September 2024, with 10,805 km under construction to complete a nationwide grid that equalizes delivered prices irrespective of distance [4]. Enhanced connectivity unlocks latent demand in the underserved east and northeast, feeds new city-gas concessions, and ensures balanced capacity utilization between LNG terminals and domestic production.
Restraints Impact Analysis*
| Restraint | (~) % Impact on CAGR Forecast | Geographic Relevance | Impact Timeline |
|---|---|---|---|
| Volatility in Spot LNG Prices Driving Industrial Fuel Switching | -0.9% | National, with coastal industrial centers most affected | Short term (≤ 2 years) |
| Delays in Pipeline Right-of-Way Clearances across Forest Corridors | -0.6% | Eastern and northeastern states, tribal areas | Medium term (2-4 years) |
| Pricing Formula Caps Limiting Upstream Investment Economics | -0.5% | National, with primary impact on domestic production regions | Long term (≥ 4 years) |
| Competition from Rapidly Falling Levelized Cost of Solar-plus-Storage | -0.4% | National, with maximum impact in high solar irradiance states | Long term (≥ 4 years) |
| Source: Mordor Intelligence | |||
Volatility in Spot LNG Prices Driving Industrial Fuel Switching
Spot LNG fluctuated from USD 2/MMBTU in early 2020 to USD 30/MMBTU in late 2021, prompting price-sensitive users to revert to fuel oil or coal whenever landed costs breach viability thresholds. Reliance on spot cargoes for roughly 25% of supply exposes the India natural gas market to exogenous shocks, especially in non-subsidized industries and peaking power plants that lack hedging mechanisms.
Delays in Pipeline Right-of-Way Clearances across Forest Corridors
Complex environmental approvals extend major projects such as the Jagdishpur-Haldia-Bokaro-Dhamra line by 12-18 months. Cost overruns dampen investor appetite and defer gas penetration into eastern heartlands where coal dominance continues, thereby capping near-term throughput on new LNG capacity.
*Our forecasts treat driver/restraint impacts as directional, not additive. The impact forecasts reflect baseline growth, mix effects, and variable interactions.
Segment Analysis
By Type: CNG acceleration outpaces PNG adoption
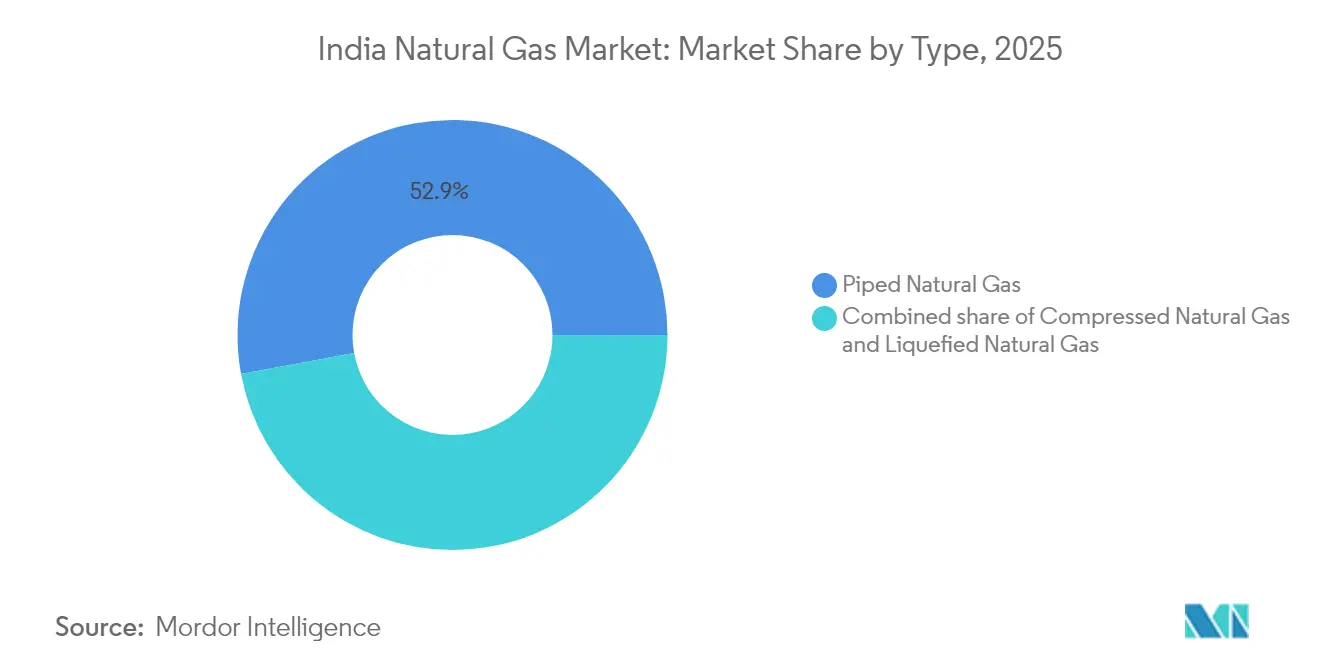
CNG delivered 47.10% of the India natural gas market size in 2025 and is forecast for a 5.83% CAGR, versus PNG’s dominant 52.90% share but slower trajectory. Rapid station build-outs—8,067 outlets operational by March 2025—and supportive transport policies make CNG an accessible decarbonization lever for commercial fleets. Bajaj Auto’s launch of CNG motorcycles and forthcoming CNG scooter platforms broadens the addressable two-wheeler universe. PNG expansion remains challenged by connection cost, subsidized LPG competition, and lower rural densities, leaving 93 geographical areas without a single household hookup, which compels CGD firms to craft pay-as-you-go and community pipeline solutions.

By Source: Import dependency intensifies despite domestic push
LNG secured 48.00% of the India natural gas market share in 2025, making it the single largest contributor to growth at a 5.86% CAGR through 2031. Planned import capacity rises from 2.1 Tcf to nearly 4 Tcf by 2026, highlighted by the east-coast Dhamra terminal that reduces shipping legs to eastern consumers. Domestic offshore gains struggle to offset decline rates in legacy basins, yet HELP acreage awards and ONGC-IOCL’s Hatta field offer localized boosts. Supplier diversification broadens; Qatar supplied 61% of cargoes in 2024, but the US share climbed to 13.5%, with room to rise toward 18% under recently signed SPAs.
By End-Use Sector: Transportation emerges as growth engine
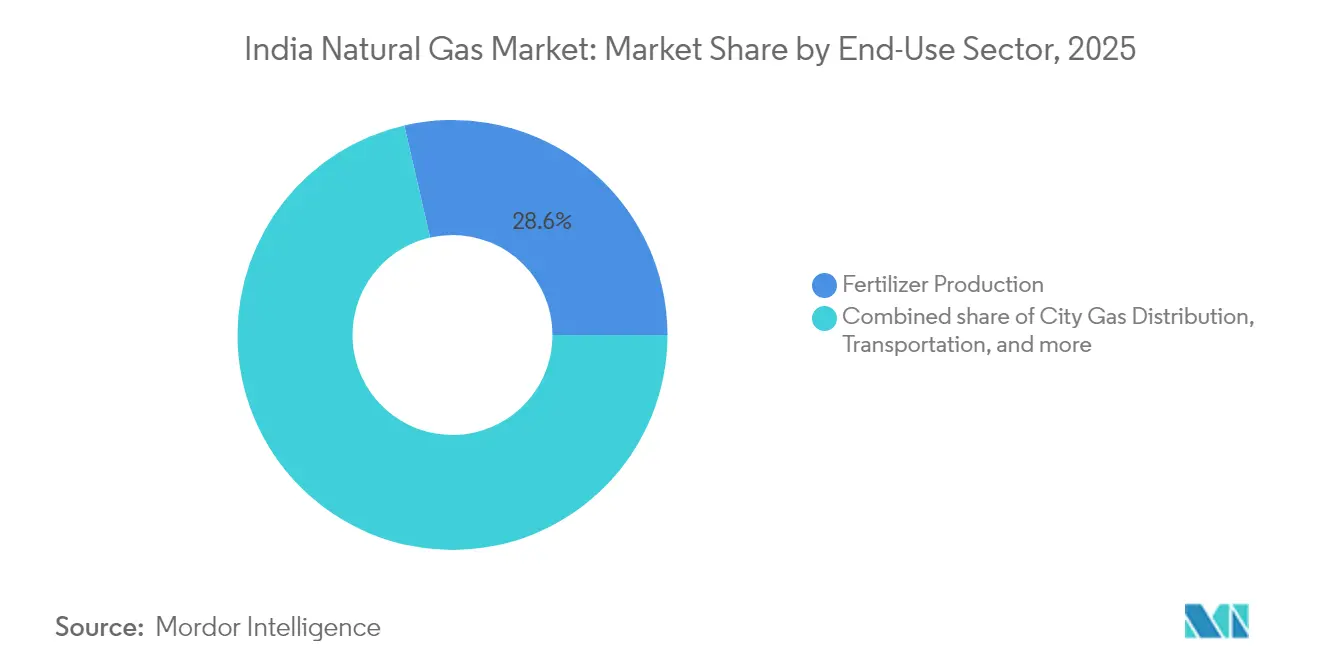
Fertilizer retained 28.60% of the India natural gas market size in 2025 through protected allocations, but transportation will outpace all other segments at 6.78% CAGR on the back of CNG autos and LNG trucking. City-gas (household and commercial) contributed 19.10%, and industrial process heat in steel, glass, and ceramics is emerging as a high-value, lower-elasticity demand pocket.
Geography Analysis
Gujarat and Maharashtra accounted for 35.70% of India's natural gas market size in 2025, benefiting from proximity to Dahej and Hazira LNG terminals, mature CGD franchises, and dense industrial clusters. Gujarat's network already serves 1.93 million homes via Gujarat Gas, underscoring how early adoption drives sustained offtake . East Coast build-outs are now balancing Western dominance. Andhra Pradesh is positioning itself as a dual LNG-and-bio-CNG hub, with Reliance Industries announcing 500 compressed bio-gas plants valued at INR 65,000 crore, yielding 4 million tons annually.
Eastern states—West Bengal, Odisha, Jharkhand, and Bihar—represent latent reservoirs of demand hindered by pipeline deficits. Completing the Jagdishpur-Haldia-Bokaro-Dhamra corridor and unified tariffs will level delivered gas prices, making natural gas competitive against coal in these coal-rich states and enabling fertilizer, steel, and CGD uptake. Bihar targets 5.3 million household PNG connections by 2030, contingent on faster clearances and last-mile build-outs.
Southern states such as Tamil Nadu and Karnataka are seeing LNG access improve via Ennore and Kochi terminals. Industrial automotive, textiles, and electronics parks are preparing to connect to trunk networks, particularly as grid reliability and decarbonization compliance gain weight in investment decisions. Northeastern terrain complicates linear pipelines, but smaller-diameter, high-pressure lines and virtual LNG trucking bridge gaps until full right-of-way approvals materialize.
Regulatory Landscape
India's natural gas sector is governed through statutory oversight and government allocation mechanisms, with the Petroleum and Natural Gas Regulatory Board (PNGRB) acting as the central regulator for pipelines and city gas distribution. The unified pipeline tariff of INR 80.97/MMBTU helps equalize delivered prices across regions, while CGD authorizations continue to expand coverage across 307 geographical areas.
In March 2026, the Government of India notified the Natural Gas and Petroleum Products Distribution Order, 2026 to streamline pipeline approvals with time-bound processes and to ease land access bottlenecks that have delayed major right-of-way corridors. Also notified in March 2026, the Natural Gas (Supply Regulation) Order, 2026 formalized priority-based allocation for critical segments including domestic PNG, CNG for transport, and fertilizers, reinforcing administered supply planning alongside market-based LNG sourcing.
Competitive Landscape
The India natural gas market is moderately fragmented. GAIL controls a major share of pipeline kilometers, underlining a quasi-natural monopoly in transmission. Petronet LNG leads regasification with Dahej and Kochi, yet new terminals at Dhamra and Chhara lower entry barriers for competitors. City-gas distribution is more contested. Gujarat Gas, Indraprastha Gas, and Mahanagar Gas dominate legacy concessions, while Adani Total Gas leverages deep pockets and cross-business synergies to extend into greenfield areas. Recent APM allocation cuts in 2024 squeezed supply by up to 21%, forcing CGD companies to blend higher-cost LNG, tweak consumer tariffs, and accelerate bio-CNG procurement.
Strategic moves lean toward vertical integration and transition fuels. Adani Total Gas secured USD 375 million for network growth; ONGC acquired PTC Energy’s 288 MW wind portfolio, signaling intent to couple gas with renewable generation and carbon-capture pilots. Digitalization, from smart metering to predictive maintenance, is emerging as a competitive differentiator, with large distributors deploying IoT sensors to cut unaccounted-for-gas losses and optimize CNG dispenser uptime.
Regulatory developments also influence rivalry. The Petroleum and Natural Gas Regulatory Board is studying third-party open access to CNG stations, potentially breaking the exclusivity enjoyed by incumbents and allowing fuel retailers to source gas independently. This could foster price competition at the pump and accelerate market deepening if accompanied by transparent network tariffs and supply-balancing mechanisms.
India Natural Gas Industry Leaders
-
GAIL (India) Limited
-
Oil & Natural Gas Corporation (ONGC)
-
Petronet LNG Limited
-
Indian Oil Corporation Limited
-
Adani Total Gas Limited
- *Disclaimer: Major Players sorted in no particular order
Market Opportunities and Future Outlook
The most visible whitespace remains in underserved eastern and northeastern demand pockets where trunk connectivity and last-mile build-outs still lag legacy western markets. Ongoing infrastructure programs are creating near-term commercialization openings for CGD operators, pipeline developers, and terminal-linked logistics, including the 3,306 km Jagdishpur-Haldia-Bokaro-Dhamra pipeline with completion targeted for September 2026 and GAIL's 422 km Srikakulam-Angul link for east-coast connectivity to industrial clusters.
Gas in transport and logistics also offers an actionable route as LNG and CNG infrastructure extends beyond passenger vehicles into freight corridors. In July 2026, CONCOR and GAIL agreed to set up an LNG dispensing station near Ahmedabad, signaling intent to build LNG as a viable fuel option for logistics operations and fleet operators. Supply-security driven initiatives further widen the opportunity set: the proposed Middle East-India Deep-water Pipeline (MEIDP) from Oman to Gujarat, under development with an estimated cost of around INR 40,000 crore, points to continued work on diversifying import routes alongside LNG terminals and the national gas grid expansion toward a 35,000 km pipeline network target.
Recent Industry Developments
- June 2026: Oil & Natural Gas Corporation (ONGC) signed a Technical Services Contract with bp Exploration Services India to act as Technical Services Provider for Western Offshore fields (excluding Mumbai High) to enhance hydrocarbon recovery. The arrangement supports Western offshore production and service integration.
- June 2026: Oil & Natural Gas Corporation (ONGC) - Signed a Technical Services Contract with bp Exploration Services India on June 25, 2026, to act as Technical Services Provider (TSP) for Western Offshore fields (excluding Mumbai High) to enhance hydrocarbon recovery. The collaboration expands external technical support for mature offshore assets and could improve output efficiency in the Western basin.
- April 2026: GAIL (India) Limited - GAIL announced an investment of Rs 3,800 crore to develop 700 MW of solar power projects to support captive energy needs of its petrochemical facilities. This advances energy diversification and strengthens energy security for manufacturing operations.
Research Methodology Framework and Report Scope
Market Definition and Coverage
For this report, the India natural gas market is defined as the total volume of natural gas supplied and consumed across the country in a given year, expressed in standard cubic meter terms. It covers gas delivered from domestic production and imports, including major end-use demand pools.
Scope exclusions: This sizing does not include crude oil, LPG, coal, or electricity, and it also excludes gas volumes that are flared or re-injected rather than supplied for end use.
Segmentation Overview
- By Type
- Compressed Natural Gas (CNG)
- Piped Natural Gas (PNG)
- Liquefied Natural Gas (LNG)
- By Source
- Domestic Production - Onshore
- Domestic Production - Offshore
- LNG Imports
- By End-Use Sector
- Fertilizer Production
- City Gas Distribution
- Transportation
- Petrochemical Feedstock
- Others [Industrial Manufacturing, Agriculture (Tea Plantation), IC for Pipeline System, LPG Shrinkage, Sponge Iron/Steel]
Data Sources, Market Sizing, and Validation
Desk Research
Desk research starts by building a clean fact base on India gas supply, import dependence, and consumption patterns, which are then used to frame model inputs and sanity checks. For this work, we rely on public sources such as PPAC, the Ministry of Petroleum and Natural Gas, the Petroleum and Natural Gas Regulatory Board, and the Reserve Bank of India for macro and inflation indicators that influence demand.
We also review international datasets such as IEA and BP Statistical Review style time series, along with customs and port level disclosures where available, to understand LNG inflows and seasonality in arrivals. Company annual reports, investor presentations, and exchange filings are used to cross-check capacity additions, utilization commentary, and pipeline or terminal commissioning timelines. In a few steps, paid subscriptions are used only for company financials and intelligence, news and financials, and in some cases shipment-level import and export tracking to validate LNG volume direction. These examples are not exhaustive, and other public and paid sources were used for data collection, validation, and clarification.
Primary Interviews and Surveys
Primary work is used to pressure-test the desk assumptions through expert interviews and structured surveys with producers, LNG value chain participants, pipeline and distribution stakeholders, and large demand-side buyers. Respondent input is used across India to compare supply availability, demand expectations, and sector pricing and allocation realities before the model is finalized.
Distribution of primary research fieldwork respondents
| Company type | Respondent position |
|---|---|
| Top tier: 33% | CXOs: 14% |
| Mid tier: 46% | Functional/Unit leaders: 42% |
| Smaller Players: 21% | Managers: 44% |
Market-Sizing & Forecasting
Market sizing is built using a top-down and bottom-up combination where national supply and demand balances are reconstructed from domestic output, LNG import volumes, and net movements into the transmission and distribution system, and then reconciled to consumption. To keep the totals realistic, the results are corroborated with selective bottom-up checks, such as sampled sector demand builds and simplified volume-by-customer rollups where reliable anchors exist.
A few practical inputs help tighten the model, including LNG regasification capacity additions and expected utilization, pipeline connectivity and expansion timelines, city gas distribution network reach, and sector-level demand signals from power, fertilizers, and industrial users. We also track seasonality patterns in LNG receipts and weather-driven demand shifts, which can move quarterly consumption even when annual production is steady.
For forecasting, scenario analysis is used so the model can separate a base case from upside and downside pathways tied to import availability, allocation priorities, and infrastructure commissioning slippages. When bottom-up data is incomplete in a given sector, the gaps are handled using penetration-rate based demand pool estimates that are aligned to historical consumption shares and then adjusted using primary feedback.
Data Validation & Update Cycle
Validation is handled through triangulation across supply totals, import signals, and sector demand indicators so the final number stays consistent with what the system can physically deliver. Outliers are flagged through variance checks against historical growth, capacity utilization, and macro conditions, and then reviewed in multiple analyst passes before sign-off.
When the model output shifts materially due to a new terminal, a policy change, or an abnormal import pattern, re-contact is triggered with relevant interviewees to confirm whether the shift is structural or temporary. The report is refreshed annually, and interim updates are made when a material event changes the outlook. Before delivery, a final review pass is completed so clients receive the latest updated view.
Mordor Intelligence's India Natural Gas Market Size Versus Other Published Estimates
Published market sizes for India natural gas can differ even when they describe the same country, because the underlying unit of measure and the boundary of what counts as consumption are not always consistent. In practice, the biggest differences come from whether the estimate is reported in volume or converted to value, which year is treated as the base, and how imports and system losses are handled.
Key gap drivers in this market often include mixing LNG import arrivals with delivered regasified volumes, counting allocation announcements as actual supply, and applying a single price to convert volume into USD even though pricing can vary by sector and period. By tracking LNG regasification throughput, domestic production run-rates, and pipeline delivery constraints, and then refreshing these checks each year, Mordor Intelligence keeps the size aligned to physically delivered gas volumes instead of value conversions that can swing with short-term prices.
Benchmark comparison
| Source | Market Size | Gaps in Research Methodology |
|---|---|---|
| Mordor Intelligence | USD 77.40 B (2025) | |
| Global Consultancy A | USD 74.10 B (2025) | Uses import arrival data as a direct proxy for consumption and does not fully adjust for regasification timing and intra-year inventory effects, which can compress the delivered volume estimate. |
| Industry Association B | USD 82.60 B (2025) | Applies aggressive assumptions on pipeline availability and CGD offtake ramp-up within the base year, which can push implied consumption above what supply and infrastructure constraints typically allow. |
The comparison shows that most of the spread comes from how delivered volumes are reconstructed and how quickly infrastructure-driven demand is assumed to materialize within a single year. Our approach stays traceable to supply balance math, capacity and utilization checks, and repeatable assumptions, which makes it easier for buyers to understand what is included and how the totals were derived.
Key Questions Answered in the Report
What is the current size of the India natural gas market?
The India natural gas market size was 81,471.24 MMSCM in 2026 and is projected to reach 105,282.06 MMSCM by 2031.
Which end-use sector consumes the most natural gas in India?
Fertilizer manufacturing leads with 28.60% of consumption, owing to government-backed gas allocations that ensure continuous supply.
Why are LNG imports increasing despite domestic production efforts?
Domestic output from mature fields is declining, while new LNG terminals and diversified supply contracts offer quicker, scalable volumes to meet rising demand.
How is unified tariff policy impacting regional gas prices?
A single INR 80.97/MMBTU tariff equalizes transportation costs nationwide, making gas more affordable in previously underserved eastern and northeastern states.
What role does natural gas play in India’s decarbonization strategy?
Natural gas serves as a transition fuel that cuts CO₂ emissions in steel, refining and transport, while its infrastructure also enables future hydrogen adoption.
Which segment is expected to grow fastest to 2031?
The transportation segment, driven by CNG and LNG vehicle adoption, is forecast to expand at a 6.78% CAGR through 2031.