| Study Period | 2017 - 2030 |
| Base Year For Estimation | 2024 |
| Forecast Data Period | 2025 - 2030 |
| Market Size (2025) | USD 0.81 Billion |
| Market Size (2030) | USD 1.12 Billion |
| CAGR (2025 - 2030) | 6.70 % |
| Market Concentration | Medium |
Major Players*Disclaimer: Major Players sorted in no particular order |

India Micronutrient Fertilizer Market Analysis
The India Micronutrient Fertilizer Market size is estimated at 0.81 billion USD in 2025, and is expected to reach 1.12 billion USD by 2030, growing at a CAGR of 6.70% during the forecast period (2025-2030).
India's agricultural landscape is experiencing significant transformation, driven by evolving farming practices and infrastructure development. As of 2022, the country achieved a notable milestone with 52% of its cultivated land having access to irrigation facilities, marking the first time that over half of India's agricultural land was irrigation-enabled. This extensive irrigation network, comprising canals, reservoirs, and tube wells, represents the largest infrastructure in the Asia-Pacific region, accounting for 34.1% of the region's total irrigation value. The enhanced irrigation capabilities have enabled farmers to adopt more sophisticated farming techniques and optimize their use of agricultural inputs, including micronutrient fertilizers.
The agricultural sector is grappling with widespread nutrient deficiency in India across major growing regions. Recent soil analyses have revealed alarming zinc deficiency levels in key agricultural states, with Maharashtra showing 83% deficiency, Karnataka 73%, and Andhra Pradesh 58%. These deficiencies are particularly concerning given that field crops occupy 95.58% of the total cultivated area, highlighting the critical need for soil micronutrient supplementation. The situation is further compounded by continuous cultivation practices that have led to progressive soil nutrient depletion.
The fertilizer industry in India is witnessing a significant shift toward advanced fertilizer formulations and application methods. Conventional fertilizers, while still dominant, are gradually giving way to specialty fertilizers and chelated fertilizers known for their enhanced stability and efficiency in soil applications. This transition is particularly evident in the growing adoption of water-soluble and liquid micronutrient formulations, which offer improved nutrient absorption and reduced wastage. The industry is also seeing increased integration of fertigation and foliar application methods, which provide more precise and efficient nutrient delivery systems.
The horticultural sector has emerged as a significant driver of micronutrient demand, with total production reaching 351.9 million tons in 2022-23, representing a 3% increase from the previous year. This growth has been accompanied by the adoption of hi-tech farming practices, including greenhouse cultivation and precision farming techniques. These advanced farming methods require optimized crop nutrition management systems, leading to increased demand for specialized micronutrient formulations. The sector's evolution is characterized by a growing emphasis on quality production, particularly in export-oriented crops, which necessitates careful attention to micronutrient supplementation.
India Micronutrient Fertilizer Market Trends
Manganese deficiency is a common problem in European countries, which most frequently affects sandy soils and organic soils with a pH above 6
- The area under field crop cultivation in the country increased by 3.5% from 2017 to 2021. The increased cultivation of cereals, pulses, and oilseeds in the country due to the rising consumer demand domestically and internationally is the major driving factor for the rising acreage.
- By crop type, rice, wheat, and soybean occupied the largest area under cultivation in the country, accounting for 47 million ha, 31.1 million ha, and 12.3 million ha, respectively, in the year 2022. Rice is the most important food crop of India, covering about one-fourth of the total cropped area and providing food to about half of the Indian population. It is cultivated in almost all the states of the country, mainly in West Bengal, Uttar Pradesh, Andhra Pradesh, Punjab, and Tamil Nadu.
- Accordingly, rice consumption in the country increased from 95.8 million tons in 2016 to 107 million tons in 2022, which shows the rising demand for the crop in the country. This trend is further anticipated to drive the demand for fertilizers during 2023-2030. Similarly, wheat cultivation in the country increased from 98.5 million tons in 2017 to 107.6 million tons in the year 2020. It is cultivated majorly in Punjab, West Bengal, Haryana, and Rajasthan. Wheat is the second most important cereal crop in India and plays a vital role in the food and nutritional security of the country. Therefore, the intense cereal cultivation in the country, coupled with rising domestic and international demand, is anticipated to drive the Indian fertilizer market during 2023-2030.

Understand The Key Trends Shaping This Market
Download PDF
Widespread micronutrient deficiency in soils of India is leading to reduced crop yield
- The increasing consumption of chemical fertilizers has led to a higher deficiency of micronutrients in the soil, leading to lesser crop yield over the years. The State of Biofertilizers and Organic Fertilizers stated that the soil was highly deficient in boron (47.0%), zinc (39.0%), iron (37.0%), and sulfur (36.0%) in 2022.
- Empirical studies show that high-yielding cultivars were introduced to meet the growing demand for food, fiber, and fuel. These high-yielding crop cultivars were highly responsive to fertilizers. Thus, the soils were slowly exhausted from their nutrients. In 2021, manganese, copper, and zinc were found to have the highest average nutrient application rates of 9.8 kg/ha, 7.3 kg/ha, and 4.1 kg/ha, respectively.
- Crops such as rapeseed/canola, corn/maize, and rice were found to be the largest consumers of average micronutrients in 2021, accounting for 10.7, 6.8, and 6.3 kg/ha, respectively. The adoption of intensive and modern cropping practices with high-yielding crop cultivars and unbalanced fertilizer application resulted in the emergence of widespread micronutrient deficiency in soils and crops of India, leading to reduced crop yield and low micronutrient concentration in agricultural produce.
- States such as Maharashtra, Karnataka, Haryana, Tamil Nadu, Uttar Pradesh, Madhya Pradesh, West Bengal, Orissa, Bihar, and Uttar Pradesh are highly deficient in zinc and boron. Hence, micronutrient management depending upon crops, soil types, the severity of the deficiency, rates, and frequency of application has been adapted by the farmers in the country for sustainable agricultural production over the past few years, which is anticipated to drive the micronutrient market in the country.

OTHER KEY INDUSTRY TRENDS COVERED IN THE REPORT
- The area under horticulture is steadily increasing due to the increasing demand for fruits and vegetables
- Manganese and copper are the highly applied nutrients in India, with 12.3 kg/ha and 7.3 kg/ha in 2022, due to their widespread deficiencies in soil
- Widespread micronutrient deficiency in soils of India is leading to reduced crop yield
- More than half of India’s cultivated land now has access to assured irrigation
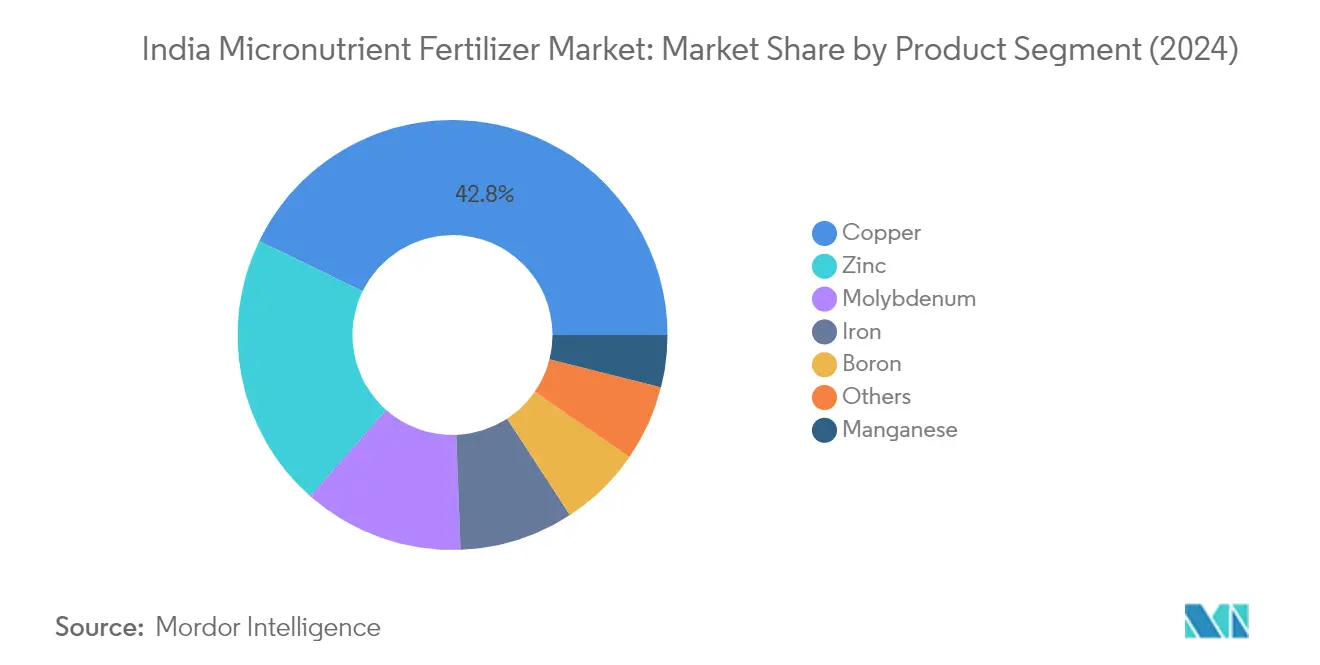
Segment Analysis: Product
Copper Segment in India Micronutrient Fertilizer Market
Copper dominates the Indian micronutrient fertilizer landscape, commanding approximately 43% market share in 2024. This significant market position is attributed to copper's crucial role in promoting chlorophyll production and seed formation in plants. The segment's dominance is further strengthened by its effectiveness in enhancing plant development and natural defense mechanisms against fungal diseases. Conventional copper fertilizers maintain a commanding presence with nearly 97% market share, while specialty copper fertilizers account for the remaining portion. The preference for conventional fertilizers is primarily driven by their wider availability and established adoption patterns across India's agricultural sector. Additionally, copper's vital role in plant metabolism and its effectiveness in foliar micronutrient spraying applications have made it an essential component in modern agricultural practices.
Zinc Segment in India Micronutrient Fertilizer Market
The zinc segment is experiencing remarkable growth momentum in the Indian micronutrient fertilizer market, projected to expand at approximately 8% CAGR from 2024 to 2029. This robust growth trajectory is primarily driven by the widespread zinc deficiency in agricultural soils, particularly in states like Maharashtra, Karnataka, and Andhra Pradesh, where deficiency levels reach as high as 83%, 73%, and 58% respectively. The segment's growth is further propelled by increasing awareness among farmers about zinc's critical role in enhancing crop yields, with documented improvements of 1 to 2 tons per hectare in various field crops. The adoption of zinc fertilizers is also gaining traction due to their proven effectiveness in addressing soil deficiencies and their crucial role in plant metabolism and protein synthesis, making it a vital plant micronutrient.
Remaining Segments in Product Segmentation
The other segments in India's micronutrient fertilizer market include iron, molybdenum, manganese, boron, and various other micronutrients, each playing distinct roles in plant nutrition and development. Iron stands out for its essential function in chlorophyll synthesis and electron transport in photosynthesis, while molybdenum is crucial for nitrogen metabolism in pulse crops. Manganese plays a vital role in photosynthesis and disease resistance, and boron is essential for reproductive development and cell wall formation. These segments collectively contribute to the market's diversity, offering farmers a comprehensive range of solutions for various crop-specific nutrient deficiencies and soil conditions. The market for these segments is shaped by factors such as soil type, crop requirements, and regional deficiency patterns across India's agricultural landscape.
Segment Analysis: Application Mode
Soil Application Segment in India Micronutrient Fertilizer Market
Soil application dominates the Indian micronutrient fertilizer market, commanding approximately 97% of the total market share in 2024. This overwhelming dominance can be attributed to several factors, including its widespread adoption across diverse crops, cost-effectiveness, and ease of application. The method's popularity stems from its versatility across different soil types and environmental conditions, making it particularly suitable for large-scale agricultural operations. Soil application has proven especially effective in addressing micronutrient deficiencies in major crops like rice, wheat, and pulses, which form the backbone of Indian agriculture. The segment's strength is further reinforced by its established distribution infrastructure and farmers' familiarity with traditional application methods, including the use of trace element fertilizer.
Foliar Application Segment in India Micronutrient Fertilizer Market
The foliar application segment is emerging as the fastest-growing segment in the Indian micronutrient fertilizer market, projected to grow at approximately 9% CAGR from 2024 to 2029. This rapid growth is primarily driven by the method's superior efficiency in nutrient absorption and its ability to provide immediate nutrition to plants. Foliar application has gained significant traction, particularly in horticultural crops, where it has demonstrated exceptional results in correcting nutrient deficiencies quickly. The segment's growth is further propelled by increasing adoption of advanced water-soluble and liquid fertilizers, which are particularly suitable for foliar micronutrient application. The method's precision in targeting specific plant parts and its reduced nutrient wastage compared to traditional application methods have made it increasingly popular among progressive farmers.
Remaining Segments in Application Mode
Fertigation represents an innovative approach in the micronutrient fertilizer application landscape, combining irrigation and fertilization processes. This method has gained particular relevance in modern agricultural practices, especially in areas equipped with drip irrigation and sprinkler systems. Fertigation offers unique advantages in terms of nutrient distribution uniformity and increased fertilizer use efficiency, making it particularly valuable for high-value crops and precision farming operations. The method's ability to optimize both water and nutrient usage while reducing labor costs has made it an increasingly attractive option for farmers adopting modern agricultural practices, particularly in regions with water scarcity concerns. It also supports the application of chelated micronutrient solutions, enhancing nutrient availability.
Segment Analysis: Crop Type
Field Crops Segment in India Micronutrient Fertilizer Market
Field crops dominate the Indian micronutrient fertilizer market, commanding approximately 89% market share in 2024. This substantial share is primarily attributed to field crops occupying over 95% of the total agricultural area in India, with major crops including rice, wheat, millets, maize, and pulses. The segment's dominance is further reinforced by the extensive cultivation area, which has expanded to nearly 184 million hectares, reflecting the country's focus on food security and agricultural self-sufficiency. The high application rates of micronutrients in field crops, particularly in regions with significant nutrient deficiencies, contribute to this segment's market leadership. Additionally, the growing adoption of specialty fertilizers among field crop farmers, driven by their superior fertilizer-use efficiency and environmental benefits, continues to strengthen this segment's market position, especially with the use of secondary nutrient solutions.
Horticultural Crops Segment in India Micronutrient Fertilizer Market
The horticultural crops segment is experiencing the fastest growth in the Indian micronutrient fertilizer market, projected to grow at approximately 7% CAGR from 2024 to 2029. This robust growth is driven by increasing consumer awareness about healthy diets and the rising demand for fresh produce. The segment's growth is further supported by the adoption of hi-tech farming practices, including greenhouse cultivation and precision farming techniques, which require precise nutrient management. The increasing focus on export-quality produce has led to greater emphasis on micronutrient application in fruit and vegetable cultivation. Moreover, the shift towards specialty micronutrient fertilizers, particularly through fertigation and foliar application methods, is enhancing nutrient uptake efficiency in horticultural crops, driving segment growth with the use of chelated micronutrient products.
Remaining Segments in Crop Type
The turf and ornamental segment, while smaller in scale, plays a significant role in India's micronutrient fertilizer market. This segment primarily serves the growing landscaping industry, golf courses, and urban gardening sector. The increasing urbanization and rising disposable incomes have led to greater investment in landscaping and ornamental plant cultivation, driving the demand for specialized micronutrient formulations. The segment is characterized by its unique requirements for balanced nutrition to maintain aesthetic appeal and plant health, particularly in institutional spaces, public parks, and residential complexes. The growing trend of urban gardening and increasing focus on green spaces in commercial developments continues to support this segment's development in the market, often utilizing trace mineral fertilizer solutions.
India Micronutrient Fertilizer Industry Overview
Top Companies in India Micronutrient Fertilizer Market
The Indian micronutrient fertilizer market is characterized by intense competition among both domestic and international players, with companies focusing on strategic initiatives to maintain their market positions. Product innovation has emerged as a key trend, with manufacturers developing advanced chelated micronutrients and specialty formulations tailored for specific crops and soil conditions. Companies are demonstrating operational agility by expanding their distribution networks and establishing strategic partnerships with agricultural input providers and farmer cooperatives. Market leaders, including some of the leading micronutrient companies in India, are investing in research and development to create more efficient nutrient delivery systems, while also expanding their manufacturing capabilities to meet growing demand. Strategic moves include the development of digital platforms for farmer engagement, soil testing services, and crop advisory solutions, complementing their product offerings. Geographic expansion remains crucial, with companies establishing regional offices and strengthening their presence in key agricultural zones across India.
Balanced Mix of Global and Local Players
The competitive landscape exhibits a healthy balance between established global fertilizer conglomerates and strong domestic players, each leveraging their unique strengths. Global players bring international expertise and advanced technologies, while local companies capitalize on their deep understanding of regional farming practices and established distribution networks. The market structure shows moderate consolidation, with the top players, including some of the top 10 micronutrient companies worldwide, commanding significant market share while maintaining competitive dynamics through product differentiation and service offerings.
The industry has witnessed strategic consolidation through mergers and acquisitions, particularly among mid-sized players seeking to enhance their market presence and technological capabilities. Companies are increasingly focusing on vertical integration to secure raw material supplies and optimize their supply chains. The competitive environment is further shaped by collaborations between manufacturers and agricultural research institutions, creating an ecosystem that promotes innovation and sustainable farming practices. Market participants are also expanding their presence in the specialty fertilizer segment, recognizing the growing demand for high-efficiency nutrient solutions.
Innovation and Distribution Key to Growth
Success in the Indian micronutrient fertilizer market increasingly depends on companies' ability to develop innovative products while maintaining strong distribution networks. Market leaders, such as a leading micronutrient fertilizer company, are strengthening their position by investing in advanced manufacturing technologies and developing customized solutions for different agro-climatic zones. Companies are also focusing on building direct relationships with farmers through digital platforms and educational initiatives, creating barriers to entry for new players. The implementation of precision farming techniques and the rising adoption of specialty fertilizers present opportunities for companies to differentiate their offerings.
Future growth strategies must address the evolving regulatory landscape, particularly regarding environmental compliance and product quality standards. Companies need to balance product pricing with farmer affordability while maintaining profitability. The development of efficient supply chains and strategic partnerships with agricultural input dealers remains crucial for market success. Players are also investing in sustainable practices and eco-friendly formulations to align with changing consumer preferences and regulatory requirements. The ability to provide comprehensive crop nutrition solutions, rather than standalone products, will become increasingly important for maintaining competitive advantage in the market. The leading micronutrient company in India is likely to focus on these aspects to sustain its leadership.
India Micronutrient Fertilizer Market Leaders
-
Chambal Fertilizers & Chemicals Ltd
-
Coromandel International Ltd.
-
Grupa Azoty S.A. (Compo Expert)
-
Yara International ASA
-
Zuari Agro Chemicals Ltd
- *Disclaimer: Major Players sorted in no particular order

Need More Details on Market Players and Competitors?
Download PDF
India Micronutrient Fertilizer Market News
- November 2019: IFFCO Launches its Nano Technology based Products nano nitrogen, nano zinc and nano copper for on- field trials as part of its efforts to cut United Statesge of chemical fertilisers and boost farmers' income.
- February 2019: Coromandel International announced a strategic partnership with Agrinos. The partnership allows Coromandel to widen its product offerings of complete plant nutrition solutions, organic fertilizers, and specialty nutrients. Coromandel, in partnership with Agrinos, will offer growers high-technology inputs under the brand name ARITHRI.
- November 2018: ICL Fertilizers developed a new line of premium fertilizers that help farmers feed their crops precisely. Polysulphate, ICLPotashpluS, and ICLPKpluS are manufactured from polyhalite, a mineral extracted at the ICL mine in Boulby, United Kingdom, to meet the agricultural need for balanced, targeted nutrition.
Free With This Report
Along with the report, We also offer a comprehensive and exhaustive data pack with 25+ graphs on area under cultivation and average application rate per hectare. The data pack includes Globe, North America, Europe, Asia-Pacific, South America, and Africa.


India Micronutrient Fertilizer Market Report - Table of Contents
1. EXECUTIVE SUMMARY & KEY FINDINGS
2. REPORT OFFERS
3. INTRODUCTION
- 3.1 Study Assumptions & Market Definition
- 3.2 Scope of the Study
- 3.3 Research Methodology
4. KEY INDUSTRY TRENDS
-
4.1 Acreage Of Major Crop Types
- 4.1.1 Field Crops
- 4.1.2 Horticultural Crops
-
4.2 Average Nutrient Application Rates
- 4.2.1 Micronutrients
- 4.2.1.1 Field Crops
- 4.2.1.2 Horticultural Crops
- 4.3 Agricultural Land Equipped For Irrigation
- 4.4 Regulatory Framework
- 4.5 Value Chain & Distribution Channel Analysis
5. MARKET SEGMENTATION (includes market size in Value in USD and Volume, Forecasts up to 2030 and analysis of growth prospects)
-
5.1 Product
- 5.1.1 Boron
- 5.1.2 Copper
- 5.1.3 Iron
- 5.1.4 Manganese
- 5.1.5 Molybdenum
- 5.1.6 Zinc
- 5.1.7 Others
-
5.2 Application Mode
- 5.2.1 Fertigation
- 5.2.2 Foliar
- 5.2.3 Soil
-
5.3 Crop Type
- 5.3.1 Field Crops
- 5.3.2 Horticultural Crops
- 5.3.3 Turf & Ornamental
6. COMPETITIVE LANDSCAPE
- 6.1 Key Strategic Moves
- 6.2 Market Share Analysis
- 6.3 Company Landscape
-
6.4 Company Profiles
- 6.4.1 Chambal Fertilizers & Chemicals Ltd
- 6.4.2 Coromandel International Ltd.
- 6.4.3 Deepak fertilizers & Petrochemicals Corporation Ltd
- 6.4.4 Grupa Azoty S.A. (Compo Expert)
- 6.4.5 Haifa Group
- 6.4.6 Indian Farmers Fertiliser Cooperative Limited
- 6.4.7 Mangalore Chemicals & Fertilizers Ltd.
- 6.4.8 Sociedad Quimica y Minera de Chile SA
- 6.4.9 Yara International ASA
- 6.4.10 Zuari Agro Chemicals Ltd
- *List Not Exhaustive
7. KEY STRATEGIC QUESTIONS FOR FERTILIZER CEOS
8. APPENDIX
-
8.1 Global Overview
- 8.1.1 Overview
- 8.1.2 Porter’s Five Forces Framework
- 8.1.3 Global Value Chain Analysis
- 8.1.4 Market Dynamics (DROs)
- 8.2 Sources & References
- 8.3 List of Tables & Figures
- 8.4 Primary Insights
- 8.5 Data Pack
- 8.6 Glossary of Terms
You Can Purchase Parts Of This Report. Check Out Prices For Specific Sections
Get Price Break-up Now
List of Tables & Figures
- Figure 1:
- CULTIVATION OF FIELD CROPS IN HECTARE, INDIA, 2017 - 2022
- Figure 2:
- CULTIVATION OF HORTICULTURAL CROPS IN HECTARE, INDIA, 2017 - 2022
- Figure 3:
- CONSUMPTION OF MICRONUTRIENTS BY FIELD CROPS IN KG/HECTARE, INDIA, 2022
- Figure 4:
- CONSUMPTION OF MICRONUTRIENTS BY HORTICULTURAL CROPS IN KG/HECTARE, INDIA, 2022
- Figure 5:
- AGRICULTURAL LAND EQUIPPED FOR IRRIGATION IN HECTARE, INDIA, 2022
- Figure 6:
- MICRONUTRIENTS FERTILIZER CONSUMPTION IN METRIC TON, INDIA, 2017 - 2030
- Figure 7:
- MICRONUTRIENTS FERTILIZER CONSUMPTION IN USD, INDIA, 2017 - 2030
- Figure 8:
- MICRONUTRIENTS FERTILIZER CONSUMPTION BY PRODUCT IN METRIC TON, INDIA, 2017 - 2030
- Figure 9:
- MICRONUTRIENTS FERTILIZER CONSUMPTION BY PRODUCT IN USD, INDIA, 2017 - 2030
- Figure 10:
- MICRONUTRIENTS FERTILIZER CONSUMPTION VOLUME BY PRODUCT IN %, INDIA, 2017 VS 2023 VS 2030
- Figure 11:
- MICRONUTRIENTS FERTILIZER CONSUMPTION VALUE BY PRODUCT IN %, INDIA, 2017 VS 2023 VS 2030
- Figure 12:
- BORON FERTILIZER CONSUMPTION IN METRIC TON, INDIA, 2017 - 2030
- Figure 13:
- BORON FERTILIZER CONSUMPTION IN USD, INDIA, 2017 - 2030
- Figure 14:
- BORON FERTILIZER CONSUMPTION VALUE BY CROP TYPE IN %, INDIA, 2023 VS 2030
- Figure 15:
- COPPER FERTILIZER CONSUMPTION IN METRIC TON, INDIA, 2017 - 2030
- Figure 16:
- COPPER FERTILIZER CONSUMPTION IN USD, INDIA, 2017 - 2030
- Figure 17:
- COPPER FERTILIZER CONSUMPTION VALUE BY CROP TYPE IN %, INDIA, 2023 VS 2030
- Figure 18:
- IRON FERTILIZER CONSUMPTION IN METRIC TON, INDIA, 2017 - 2030
- Figure 19:
- IRON FERTILIZER CONSUMPTION IN USD, INDIA, 2017 - 2030
- Figure 20:
- IRON FERTILIZER CONSUMPTION VALUE BY CROP TYPE IN %, INDIA, 2023 VS 2030
- Figure 21:
- MANGANESE FERTILIZER CONSUMPTION IN METRIC TON, INDIA, 2017 - 2030
- Figure 22:
- MANGANESE FERTILIZER CONSUMPTION IN USD, INDIA, 2017 - 2030
- Figure 23:
- MANGANESE FERTILIZER CONSUMPTION VALUE BY CROP TYPE IN %, INDIA, 2023 VS 2030
- Figure 24:
- MOLYBDENUM FERTILIZER CONSUMPTION IN METRIC TON, INDIA, 2017 - 2030
- Figure 25:
- MOLYBDENUM FERTILIZER CONSUMPTION IN USD, INDIA, 2017 - 2030
- Figure 26:
- MOLYBDENUM FERTILIZER CONSUMPTION VALUE BY CROP TYPE IN %, INDIA, 2023 VS 2030
- Figure 27:
- ZINC FERTILIZER CONSUMPTION IN METRIC TON, INDIA, 2017 - 2030
- Figure 28:
- ZINC FERTILIZER CONSUMPTION IN USD, INDIA, 2017 - 2030
- Figure 29:
- ZINC FERTILIZER CONSUMPTION VALUE BY CROP TYPE IN %, INDIA, 2023 VS 2030
- Figure 30:
- OTHERS FERTILIZER CONSUMPTION IN METRIC TON, INDIA, 2017 - 2030
- Figure 31:
- OTHERS FERTILIZER CONSUMPTION IN USD, INDIA, 2017 - 2030
- Figure 32:
- OTHERS FERTILIZER CONSUMPTION VALUE BY CROP TYPE IN %, INDIA, 2023 VS 2030
- Figure 33:
- MICRONUTRIENTS MICRONUTRIENTS FERTILIZER CONSUMPTION BY APPLICATION MODE IN METRIC TON, INDIA, 2017 - 2030
- Figure 34:
- MICRONUTRIENTS MICRONUTRIENTS FERTILIZER CONSUMPTION BY APPLICATION MODE IN USD, INDIA, 2017 - 2030
- Figure 35:
- MICRONUTRIENTS MICRONUTRIENTS FERTILIZER CONSUMPTION VOLUME BY APPLICATION MODE IN %, INDIA, 2017 VS 2023 VS 2030
- Figure 36:
- MICRONUTRIENTS MICRONUTRIENTS FERTILIZER CONSUMPTION VALUE BY APPLICATION MODE IN %, INDIA, 2017 VS 2023 VS 2030
- Figure 37:
- FERTIGATION APPLICATION OF MICRONUTRIENTS FERTILIZER IN METRIC TON, INDIA, 2017 - 2030
- Figure 38:
- FERTIGATION APPLICATION OF MICRONUTRIENTS FERTILIZER IN USD, INDIA, 2017 - 2030
- Figure 39:
- FERTIGATION APPLICATION OF MICRONUTRIENTS FERTILIZER IN VALUE BY CROP TYPE IN %, INDIA, 2023 VS 2030
- Figure 40:
- FOLIAR APPLICATION OF MICRONUTRIENTS FERTILIZER IN METRIC TON, INDIA, 2017 - 2030
- Figure 41:
- FOLIAR APPLICATION OF MICRONUTRIENTS FERTILIZER IN USD, INDIA, 2017 - 2030
- Figure 42:
- FOLIAR APPLICATION OF MICRONUTRIENTS FERTILIZER IN VALUE BY CROP TYPE IN %, INDIA, 2023 VS 2030
- Figure 43:
- SOIL APPLICATION OF MICRONUTRIENTS FERTILIZER IN METRIC TON, INDIA, 2017 - 2030
- Figure 44:
- SOIL APPLICATION OF MICRONUTRIENTS FERTILIZER IN USD, INDIA, 2017 - 2030
- Figure 45:
- SOIL APPLICATION OF MICRONUTRIENTS FERTILIZER IN VALUE BY CROP TYPE IN %, INDIA, 2023 VS 2030
- Figure 46:
- MICRONUTRIENTS MICRONUTRIENTS FERTILIZER CONSUMPTION BY CROP TYPE IN METRIC TON, INDIA, 2017 - 2030
- Figure 47:
- MICRONUTRIENTS MICRONUTRIENTS FERTILIZER CONSUMPTION BY CROP TYPE IN USD, INDIA, 2017 - 2030
- Figure 48:
- MICRONUTRIENTS MICRONUTRIENTS FERTILIZER CONSUMPTION VOLUME BY CROP TYPE IN %, INDIA, 2017 VS 2023 VS 2030
- Figure 49:
- MICRONUTRIENTS MICRONUTRIENTS FERTILIZER CONSUMPTION VALUE BY CROP TYPE IN %, INDIA, 2017 VS 2023 VS 2030
- Figure 50:
- MICRONUTRIENTS FERTILIZER CONSUMPTION BY FIELD CROPS IN METRIC TON, INDIA, 2017 - 2030
- Figure 51:
- MICRONUTRIENTS FERTILIZER CONSUMPTION BY FIELD CROPS IN USD, INDIA, 2017 - 2030
- Figure 52:
- MICRONUTRIENTS FERTILIZER CONSUMPTION VALUE BY PRODUCT IN %, INDIA, 2023 VS 2030
- Figure 53:
- MICRONUTRIENTS FERTILIZER CONSUMPTION BY HORTICULTURAL CROPS IN METRIC TON, INDIA, 2017 - 2030
- Figure 54:
- MICRONUTRIENTS FERTILIZER CONSUMPTION BY HORTICULTURAL CROPS IN USD, INDIA, 2017 - 2030
- Figure 55:
- MICRONUTRIENTS FERTILIZER CONSUMPTION VALUE BY PRODUCT IN %, INDIA, 2023 VS 2030
- Figure 56:
- MICRONUTRIENTS FERTILIZER CONSUMPTION BY TURF & ORNAMENTAL IN METRIC TON, INDIA, 2017 - 2030
- Figure 57:
- MICRONUTRIENTS FERTILIZER CONSUMPTION BY TURF & ORNAMENTAL IN USD, INDIA, 2017 - 2030
- Figure 58:
- MICRONUTRIENTS FERTILIZER CONSUMPTION VALUE BY PRODUCT IN %, INDIA, 2023 VS 2030
- Figure 59:
- MOST ACTIVE COMPANIES BY NUMBER OF STRATEGIC MOVES, INDIA, 2017 - 2030
- Figure 60:
- INDIA MICRONUTRIENT FERTILIZER MARKET, MOST ADOPTED STRATEGIES, 2018 - 2021
- Figure 61:
- MARKET SHARE OF MAJOR PLAYERS IN %, INDIA
India Micronutrient Fertilizer Industry Segmentation
Boron, Copper, Iron, Manganese, Molybdenum, Zinc, Others are covered as segments by Product. Fertigation, Foliar, Soil are covered as segments by Application Mode. Field Crops, Horticultural Crops, Turf & Ornamental are covered as segments by Crop Type.| Product | Boron |
| Copper | |
| Iron | |
| Manganese | |
| Molybdenum | |
| Zinc | |
| Others | |
| Application Mode | Fertigation |
| Foliar | |
| Soil | |
| Crop Type | Field Crops |
| Horticultural Crops | |
| Turf & Ornamental |
Need A Different Region or Segment?
Customize Now
Market Definition
- MARKET ESTIMATION LEVEL - Market Estimations for various types of fertilizers has been done at the product-level and not at the nutrient-level.
- NUTRIENT TYPES COVERED - Micronutients: Zn, Mn, Cu, Fe, Mo, B, and Others
- AVERAGE NUTRIENT APPLICATION RATE - This refers to the average volume of nutrient consumed per hectare of farmland in each country.
- CROP TYPES COVERED - Field Crops: Cereals, Pulses, Oilseeds, and Fiber Crops Horticulture: Fruits, Vegetables, Plantation Crops and Spices, Turf Grass and Ornamentals
| Keyword | Definition |
|---|---|
| Fertilizer | Chemical substance applied to crops to ensure nutritional requirements, available in various forms such as granules, powders, liquid, water soluble, etc. |
| Specialty Fertilizer | Used for enhanced efficiency and nutrient availability applied through soil, foliar, and fertigation. Includes CRF, SRF, liquid fertilizer, and water soluble fertilizers. |
| Controlled-Release Fertilizers (CRF) | Coated with materials such as polymer, polymer-sulfur, and other materials such as resins to ensure nutrient availability to the crop for its entire life cycle. |
| Slow-Release Fertilizers (SRF) | Coated with materials such as sulfur, neem, etc., to ensure nutrient availability to the crop for a longer period. |
| Foliar Fertilizers | Consist of both liquid and water soluble fertilizers applied through foliar application. |
| Water-Soluble Fertilizers | Available in various forms including liquid, powder, etc., used in foliar and fertigation mode of fertilizer application. |
| Fertigation | Fertilizers applied through different irrigation systems such as drip irrigation, micro irrigation, sprinkler irrigation, etc. |
| Anhydrous Ammonia | Used as fertilizer, directly injected into the soil, available in gaseous liquid form. |
| Single Super Phosphate (SSP) | Phosphorus fertilizer containing only phosphorus which has lesser than or equal to 35%. |
| Triple Super Phosphate (TSP) | Phosphorus fertilizer containing only phosphorus greater than 35%. |
| Enhanced Efficiency Fertilizers | Fertilizers coated or treated with additional layers of various ingredients to make it more efficient compared to other fertilizers. |
| Conventional Fertilizer | Fertilizers applied to crops through traditional methods including broadcasting, row placement, ploughing soil placement, etc. |
| Chelated Micronutrients | Micronutrient fertilizers coated with chelating agents such as EDTA, EDDHA, DTPA, HEDTA, etc. |
| Liquid Fertilizers | Available in liquid form, majorly used for application of fertilizers to crops through foliar and fertigation. |
Need More Details on Market Definition?
Ask a Question
Research Methodology
Mordor Intelligence follows a four-step methodology in all our reports.
- Step-1: IDENTIFY KEY VARIABLES: In order to build a robust forecasting methodology, the variables and factors identified in Step-1 are tested against available historical market numbers. Through an iterative process, the variables required for market forecast are set and the model is built on the basis of these variables.
- Step-2: Build a Market Model: Market-size estimations for the forecast years are in nominal terms. Inflation is not a part of the pricing, and the average selling price (ASP) is kept constant throughout the forecast period for each country.
- Step-3: Validate and Finalize: In this important step, all market numbers, variables and analyst calls are validated through an extensive network of primary research experts from the market studied. The respondents are selected across levels and functions to generate a holistic picture of the market studied.
- Step-4: Research Outputs: Syndicated Reports, Custom Consulting Assignments, Databases & Subscription Platforms

Get More Details On Research Methodology
Download PDF


