
Market Overview
| Study Period | 2020 - 2031 |
|---|---|
| Forecast Data Period | 2026 - 2031 |
| Base Year Market Size (2025) | USD 37.75 Billion |
| Market Size (2026) | USD 42.25 Billion |
| Market Size (2031) | USD 74.12 Billion |
| Growth Rate (2026 - 2031) | 11.92 % |
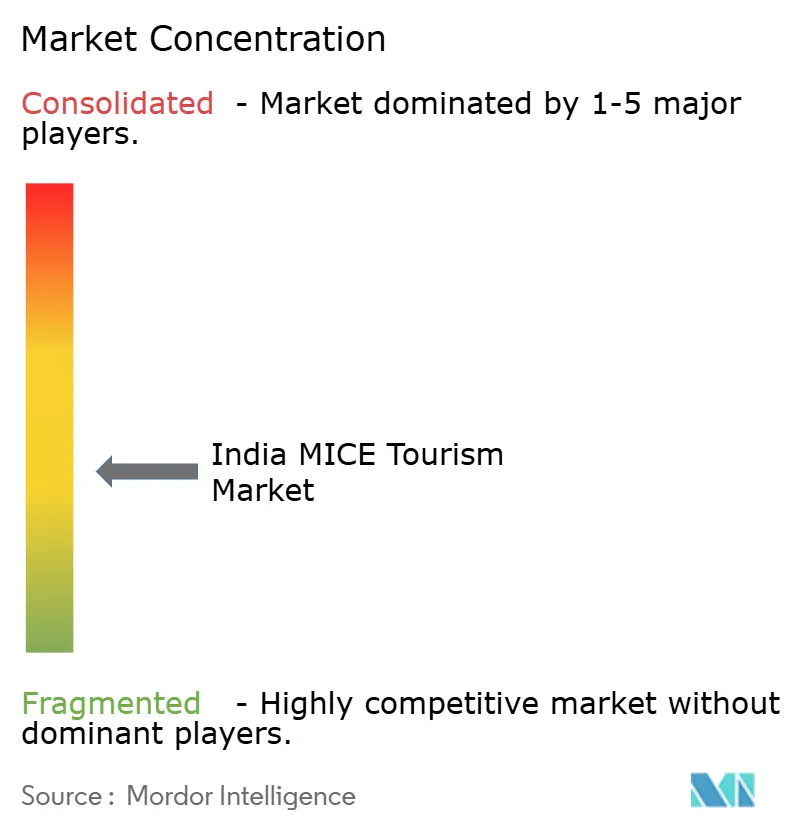
| Market Concentration | Medium |
Major Players *Disclaimer: Major Players sorted in no particular order Image © Mordor Intelligence. Reuse requires attribution under CC BY 4.0. | |
India MICE Tourism Market Analysis by Mordor Intelligence
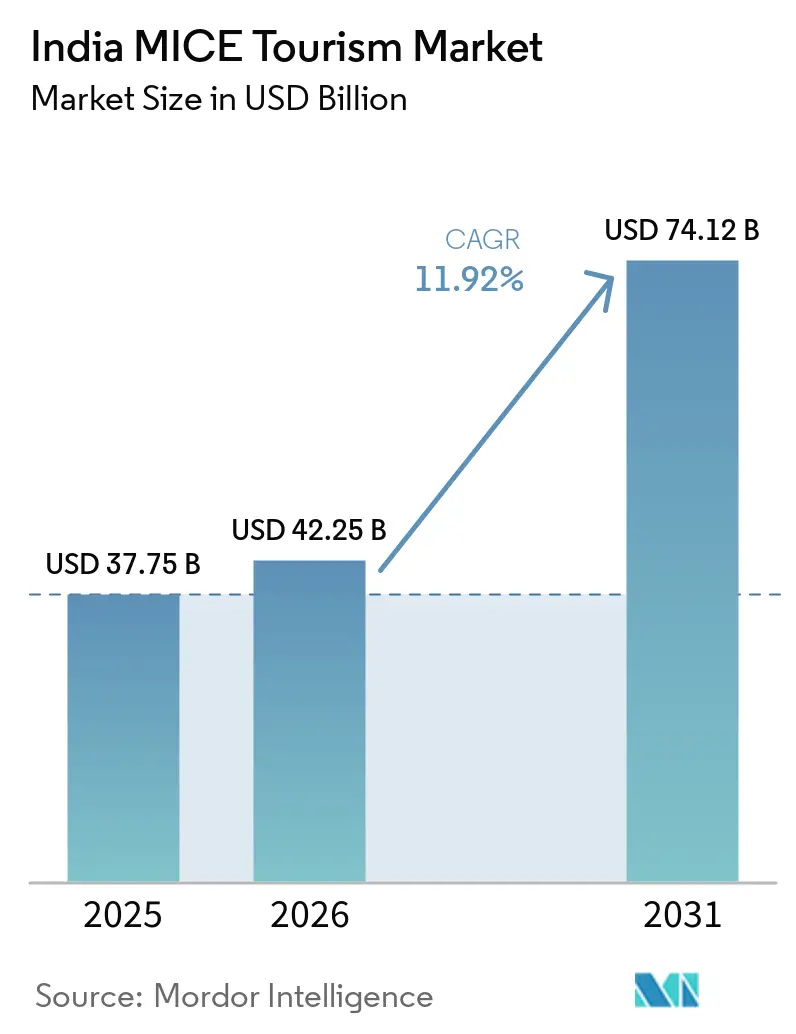
The India MICE tourism market size was valued at USD 37.75 billion in 2025 and estimated to grow from USD 42.25 billion in 2026 to reach USD 74.12 billion by 2031, at a CAGR of 11.92% during the forecast period (2026-2031). Robust corporate travel spending, the Union government’s “Meet in India” program, and legacy G-20 infrastructure together establish a demand runway that outpaces most global peers. Capacity additions such as the 300,000-square-meter Yashobhoomi venue in Delhi and a planned 100,000 new branded rooms are relieving pre-pandemic space shortages even as average branded-hotel occupancy touched a decade-high 67.5% in 2024 [1]. Technology is reshaping delegate engagement: hybrid platforms have moved from novelty to norm, catalyzing a 17.18% CAGR for event-tech services. Policy support extends beyond infrastructure; the e-Conference visa now clears in under 48 hours, removing a historic bottleneck for international delegates. On the risk side, an 18% GST on premium hotel tariffs lifts event budgets by roughly 6%, and slot scarcity at Mumbai and Delhi airports continues to complicate large-scale scheduling.
Key Report Takeaways
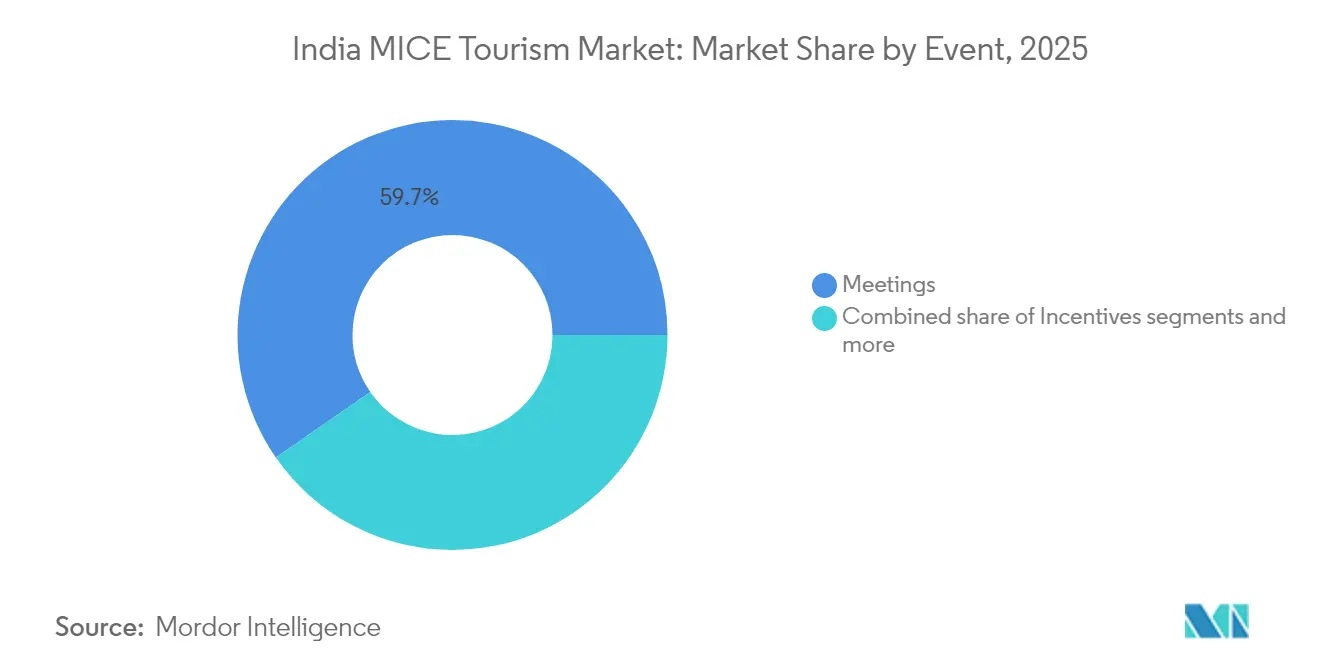
- By event type, meetings commanded 59.65% of the India MICE tourism market share in 2025, Incentives are projected to expand at a 12.85% CAGR through 2031, the fastest among all event categories.
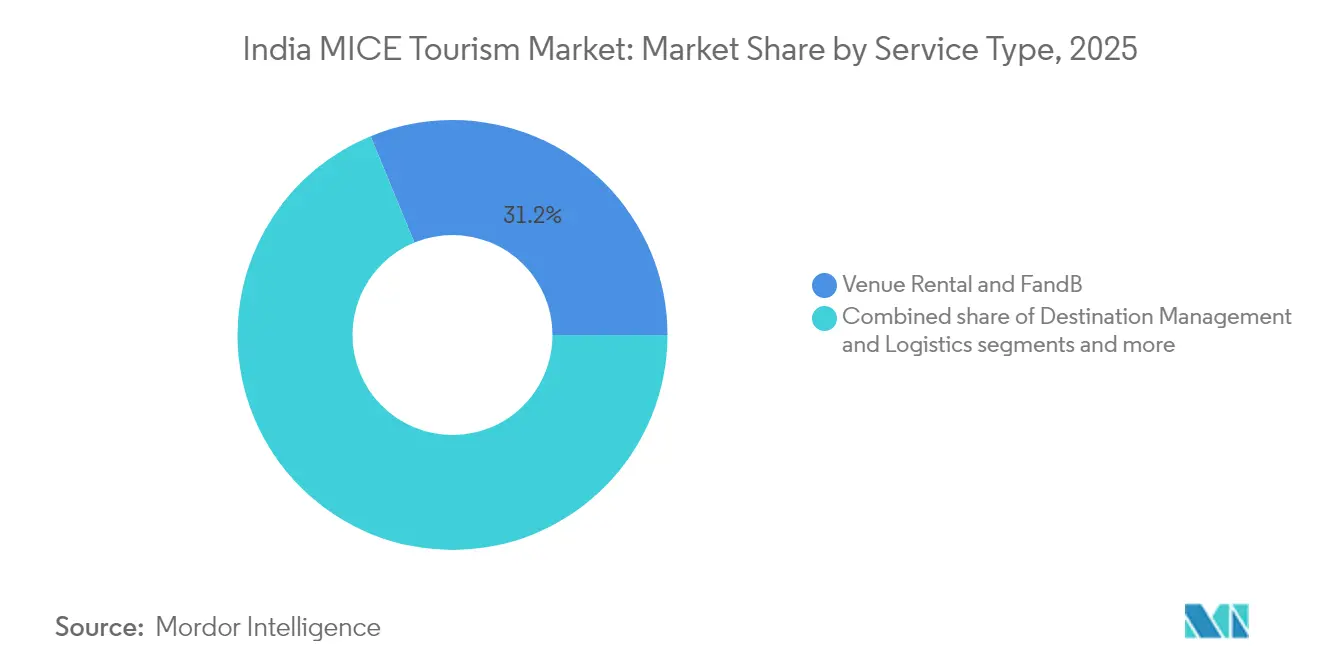
- By service type, venue rental & F&B captured 31.22% of the India MICE tourism market share in 2025, while event-tech enablement is advancing at 16.55% CAGR.
- By end-user industry, corporate clients represented 52.90% of the India MICE tourism market share in 2025; Government & PSUs show the highest growth trajectory at 11.98% CAGR.
- By geography, North India led the India MICE tourism market with 45.40% share, while East India emerged as the fastest-growing region, accounting for 11.58% in 2025.
Note: Market size and forecast figures in this report are generated using Mordor Intelligence’s proprietary estimation framework, updated with the latest available data and insights as of 2026.
India MICE Tourism Market Trends and Insights
Drivers Impact Analysis*
| Driver | (~) % Impact on CAGR Forecast | Geographic Relevance | Impact Timeline |
|---|---|---|---|
| Surge in corporate travel spending | +2.8% | Mumbai, Delhi, Bengaluru; ripple global | Short term (≤ 2 years) |
| “Meet in India” program and G-20 legacy venues | +2.1% | North India core; spill-over to West and South | Medium term (2-4 years) |
| Rapid hotel and convention-centre pipeline | +1.9% | National; tier-1 cities expanding to tier-2 | Long term (≥ 4 years) |
| E-visa and e-Conference visa facilitation | +1.4% | Global inbound delegates | Short term (≤ 2 years) |
| Rise of hybrid/tech-enabled event platforms | +1.2% | Urban centers with 5G; expanding nationally | Medium term (2-4 years) |
| Bleisure and wellness add-ons | +0.9% | South India leadership; coastal circuits | Medium term (2-4 years) |
| Source: Mordor Intelligence | |||
Surge in Corporate Travel Spending
Corporate travel budgets rebounded to 110% of pre-pandemic levels, creating a seller’s market for premium venues. Technology, pharmaceutical, and financial-services firms now account for more than 40% of corporate MICE outlays, and their preference for face-to-face engagement is pushing average event budgets 15-20% higher year-over-year in the metros. Supply tightness is most acute in first-tier cities, prompting rate premiums at integrated convention hotels. Pricing power could erode if macroeconomic conditions weaken, but for now it is underpinning the double-digit expansion of the India MICE tourism market [2].
Government Push via “Meet in India” and G-20 Venues
The government's strategic positioning of India as a global MICE hub leverages the infrastructure and credibility gained from hosting the G20 presidency, strengthening its position in global MICE tourism market and creating a multiplier effect that extends beyond traditional tourism metrics. Union Tourism Minister Gajendra Singh Shekhawat's vision to establish India as the "MICE capital of the world" is backed by concrete policy measures, including the INR 2,541.06 (USD 29.7) crore allocation in Budget 2025-26 for tourism infrastructure and the development of 50 top destinations through state partnerships. The Yashobhoomi complex in Delhi, with its 300,000 square meters of exhibition space and 6,000-seat plenary hall, represents the flagship of this initiative and has already secured over 200 events within two years of inauguration. However, the success of this initiative hinges on coordination between central and state governments, as evidenced by Odisha's announcement of 121 tourism projects worth INR 8,153 (USD 95.3) crore specifically targeting MICE and wedding tourism.
Rapid Hotel and Convention-Centre Pipeline
The branded hotel pipeline of 88,706 keys over the next five years represents a 49% increase in room supply, with 77% concentrated in key MICE markets including Bengaluru, Mumbai, and Goa. This expansion is strategically timed to capture the projected growth in business events, but it also introduces supply-side risks if demand growth fails to materialize as expected. The pipeline includes purpose-built convention facilities, such as the planned mega convention center in Bhubaneswar with 10,000-seat capacity and 50,000 square feet of indoor exhibition space, demonstrating the geographic diversification of MICE infrastructure beyond traditional metros. Hotel chains are increasingly incorporating flexible meeting spaces and hybrid-event capabilities into new properties, reflecting the permanent shift in event formats post-pandemic. The Federation of Hotel and Restaurant Associations of India's request for infrastructure status for hotels and convention centers costing INR 10 crore (USD 0.12 crore) or more signals industry recognition that MICE facilities require different financing and regulatory treatment than traditional hospitality assets.
E-visa & E-Conference Visa Facilitation
The introduction of E-Conference Visas and expansion of e-visa facilities to 169 countries has reduced administrative processing time to under 48 hours, eliminating a critical friction point for international delegates and event organizers. This digital transformation in visa processing addresses one of the most frequently cited barriers to India's MICE competitiveness, particularly for last-minute business travel and conference attendance. The Ministry of Tourism's emphasis on visa facilitation as part of the broader "Heal in India" and medical tourism initiatives creates synergies with MICE events, especially in healthcare, pharmaceutical, and wellness sectors. The streamlined visa process has particular impact on association and academic conferences, where international participation rates directly correlate with event success and future hosting opportunities. However, the effectiveness of these measures depends on consistent implementation across Indian consulates globally and integration with broader immigration and security protocols.
Restraints Impact Analysis*
| Restraint | (~) % Impact on CAGR Forecast | Geographic Relevance | Impact Timeline |
|---|---|---|---|
| High indirect taxes (GST 18% on premium tariffs) | -1.8% | Nationwide; most acute at luxury venues | Short term (≤ 2 years) |
| Air-route concentration and slot scarcity | -1.2% | Mumbai & Delhi hubs; national spillover | Medium term (2-4 years) |
| Security-perception shocks in select states | -1.0% | Region-specific (e.g., Northeast, border states), with national spillover in perception | Short to Medium term (1–3 years) |
| Fragmented vendor ecosystem limiting service quality (under-radar) | -0.9% | Tier II and Tier III cities with developing infrastructure | Medium term (2–4 years) |
| Source: Mordor Intelligence | |||
High Indirect Taxes on Premium Tariffs
The 18% GST on hotel rooms above INR 7,500 (USD 87.7) creates a significant cost disadvantage for India's premium MICE venues, inflating total event budgets by approximately 6% and making the country less competitive against regional destinations like Singapore and Dubai. This tax structure particularly impacts international conferences and corporate incentive programs, where premium accommodation is often a non-negotiable requirement. KPMG's analysis of Union Budget 2024 recommendations includes implementing a GST refund system for foreign tourists and considering a flat 12% GST rate for all hotel rooms to simplify taxation and improve competitiveness. The tax burden is compounded by state-level variations in implementation and compliance requirements, creating additional administrative complexity for multi-city events.
Air-route Concentration & Slot Scarcity
Peak-hour slot utilization exceeding 95% at Mumbai and Delhi airports creates scheduling conflicts and capacity constraints that directly impact MICE event planning and delegate travel convenience. This bottleneck is particularly problematic for large international conferences requiring coordinated arrival and departure of hundreds of delegates within narrow time windows. The protest by West Asian airlines over terminal shifts and operational disruptions at major Indian airports highlights the systemic nature of aviation infrastructure challenges. The concentration of MICE venues around these primary airports exacerbates the problem, as alternative airports often lack the international connectivity and ground transportation infrastructure required for major business events.
*Our forecasts treat driver/restraint impacts as directional, not additive. The impact forecasts reflect baseline growth, mix effects, and variable interactions.
Segment Analysis
By Event: Meetings Anchor Demand While Incentives Accelerate
The meetings segment's commanding 59.65% market share in 2025 reflects the fundamental shift in corporate communication strategies, where face-to-face interactions have regained primacy after the pandemic-induced digital experiment. This dominance is driven by the complexity of modern business decisions requiring nuanced discussion and relationship-building that virtual platforms cannot fully replicate. Incentives, despite representing a smaller volume, are experiencing explosive growth at 12.85% CAGR through 2031, as companies recognize the motivational impact of experiential rewards in talent retention and performance management.
Conferences account for approximately 24.3% of the market, benefiting from India's growing reputation as a knowledge economy and the government's push to host international academic and industry symposiums. Exhibitions represent the smallest segment at roughly 10.2% share, but are experiencing steady growth driven by sector-specific trade shows in automotive, textiles, and technology. The InfoComm India 2024 event at Jio World Convention Centre recorded 10,867 unique attendees with a 17% increase over the previous year, demonstrating the vitality of specialized exhibition formats . The integration of hybrid formats across all event types is creating new revenue streams and expanding addressable audiences, particularly for conferences and exhibitions where virtual participation can complement physical attendance.

By Service Type: Tech Enablement Reshapes the Value Chain
Venue rental & F&B controlled 31.22% of 2025 revenue, equating to an India MICE Tourism market size of USD 11.79 billion for the category. Operators are investing in smart-hall partitions, sensor-based traffic analytics, and farm-to-table cuisine to defend margins. Event-tech enablement is on a 16.55% CAGR trajectory, propelled by cloud-based registration, AI networking apps, and mixed-reality show floors. Platform players like Cvent India and MICEONLINE democratize supplier access and tighten procurement cycles, pressuring intermediaries.
Destination management and logistics companies pivot toward experience design, layering wellness excursions and sustainability audits into their offerings. Creative and production agencies leverage augmented-reality sets and holographic keynote options to remain relevant as content is increasingly digitized. While tech adoption raises data-privacy considerations, the regulatory environment is gradually clarifying guidelines, which should further encourage enterprise investment.
By End-User Industry: Public Sector Sets the Pace
Corporates represented a dominant 52.90% of overall 2025 spending, yet procurement sophistication is forcing vendors to unbundle costs, compressing margins. Government & PSUs, posting a 11.98% CAGR, are the clear momentum segment as ministries leverage events to showcase policy achievements and attract FDI. Defense, space, and renewable-energy agencies now host large-scale summits with global partner participation, generating spillover demand for protocol-compliant venues.
Associations and trade bodies capitalize on India’s growing regulatory influence, hosting standards-setting workshops across fintech, pharma, and cybersecurity. Academic and research institutions are similarly scaling symposium counts, aided by easier e-visa rules. The India MICE tourism market size for government events is estimated at USD 8.42 billion in 2025, and its outsized growth is rebalancing the customer mix across venue categories.
Geography Analysis
North India accounted for the largest regional share of 45.40% of the India MICE tourism market in 2025, anchored by Delhi’s administrative gravitas and the game-changing Yashobhoomi complex that offers 300,000 square meters of contiguous exhibition space . Direct Airport Express Metro access compresses ground-transfer times, a factor repeatedly cited in bid evaluations. However, premium hotel room taxation and airport congestion temper cost competitiveness for budget-sensitive events, pushing some associations to explore Lucknow and Jaipur for overflow needs.
East India is emerging as the fastest-growing region in the India MICE market, driven by improving infrastructure and increased government focus on regional tourism development. Cities like Bhubaneswar, Kolkata, and Ranchi are witnessing rising demand for business conventions, academic summits, and cultural events. Enhanced connectivity through new airports and better rail links has made the region more accessible for corporate travelers. State governments are actively promoting destination-based MICE tourism through subsidies, PPP models, and convention center developments. Additionally, the region's relatively lower operating costs and availability of unique cultural venues are attracting both domestic and international event organizers.
South India positions itself as the innovation lab of the India MICE tourism market, integrating wellness and tech fluency into event design. Bengaluru leads in hybrid event production, Chennai specializes in healthcare congresses, and Hyderabad’s HITEX facility attracts ICT and biotech exhibitions. Kerala and Goa have successfully intertwined leisure and meetings, boosting average stay lengths. East and North-East India remains the smallest slice but is gaining visibility through state-backed cultural conferences and eco-tourism summits aligned with Act East policy objectives.
Regulatory Landscape
The regulatory framework for MICE in India is anchored by the Ministry of Tourism, including the National Strategy for MICE Industry (2022) and the enabling guidelines for City MICE Promotion Bureaus (CMPBs) issued by the Ministry of Tourism (2024). These guidelines are intended to support a city-level, PPP-led single-window facilitator for bidding and local coordination. On the inbound side, the e-Conference visa and expanded e-visa coverage (169 countries), with approvals cited at under 48 hours, reduce friction for international delegates and support India’s ability to host association and corporate conferences.
For supply creation, approvals and compliance cut across central, state, and local bodies. Requirements cover building permissions (including FAR norms), excise licensing, and tourism-facility recognition and classification for accommodation and convention facilities. Investment facilitation increasingly routes through the National Single Window System (NSWS), while state-level ease-of-doing-business performance is benchmarked under DPIIT’s Business Reforms Action Plan (BRAP), which affects how quickly large convention and hotel projects move from permitting to operations.
Value Chain Analysis
India’s MICE value chain starts with demand owners (corporates, associations and trade bodies, government and PSUs, and academic and research institutions) that issue RFPs directly or via travel management companies and event platforms. This demand is then delivered through professional conference organizers (PCOs), professional exhibition organizers (PEOs), destination management companies (DMCs), creative and production agencies, and event-tech providers, who coordinate suppliers including convention and exhibition venues, hotels, airlines and ground transport, catering, AV and staging, and temporary staffing and security.
Upstream capacity and access are increasingly shaped by institutional enablers and infrastructure developers, including the Ministry of Tourism’s “Meet in India” positioning under Incredible India and the CMPB model that supports bidding and stakeholder coordination at the city level. PPP-led venue development activity, including large convention-center projects in Goa, Mohali, and the Bengaluru airport district, reflects a shift toward integrated precincts linking venues with hospitality and commercial real estate. Execution remains constrained by multi-jurisdiction approvals, GST-driven cost pressures for premium hotel inventory, and flight-slot congestion in Mumbai and Delhi, which complicates delegate movement for large-format events.
Competitive Landscape
The India MICE tourism market remains fragmented, with limited concentration among the top five players. Indian Hotels Company Ltd. leads by leveraging its expansive Taj convention network and early rollout of hybrid event studios. Marriott follows closely, driven by its Bonvoy loyalty integration and aggressive strategy to convert management contracts. Accor continues to build its position through the Pullman and Novotel brands, which target mid-premium corporate clientele. The overall market remains diverse, with no dominant player, allowing room for competition and innovation.
Technology intermediaries are reshaping the MICE value chain by streamlining sourcing and reducing reliance on traditional agencies. Cvent India’s cloud-based RFP platform handled over 20,000 venue requests in 2024, significantly cutting sourcing time. MICEONLINE is gaining traction among tier-2 hotels by digitizing package quotes and live inventory, thereby reducing commission costs. Vertical integration is also gaining momentum, as seen in Yatra Online’s acquisition of Globe Travels for USD 15.25 million, expanding its corporate travel and MICE offerings. These shifts signal a transformation in how services are bundled and delivered.
Emerging white-space opportunities include sustainable event certifications, promotion of tier-2 destinations, and specialized formats like medical congresses. The regulatory environment remains favorable for investment, with 100% FDI allowed in the hospitality and tourism sector. However, compliance challenges related to GST and data localization create hurdles for smaller tech-driven entrants. Addressing these issues will be key for new players looking to scale. As the ecosystem matures, innovation and regulatory navigation will be critical success factors.
India MICE Tourism Industry Leaders
-
Indian Hotels Company Ltd. (IHCL)
-
Marriott International India
-
Accor India
-
Hyatt Hotels India
-
ITC Hotels
- *Disclaimer: Major Players sorted in no particular order
Market Opportunities and Future Outlook
One clear opportunity is the build-out of large-format convention infrastructure beyond the traditional metro core, supported by PPP models and state-led project pipelines. In 2026, this includes the inauguration of the International Convention and Expo Centre, Goa (reported at INR 750-800 crore), and Assam’s approval of a INR 477 crore riverfront Convention Centre-cum-State Guest House project in Guwahati. It also includes airport-linked convention development in Bengaluru through Prestige Group’s partnership with Bangalore Airport City Ltd (BACL) for an approximately INR 1,800 crore convention center campus. Together, these initiatives expand addressable venue inventory for conferences and exhibitions and create room for destination management, production, and venue-ops specialists to standardize service levels in tier-2 markets.
A second opportunity is the premium and midscale hotel pipeline that adds meeting-capable inventory and improves citywide room blocks for multi-day events. In 2026, Indian Hotels Company Ltd (IHCL) disclosed a five-year INR 6,000-7,500 crore capex plan (including the 500-room Taj Bandstand in Mumbai) and also advanced expansion in its Ginger footprint via a framework agreement with Rajdarbar Group for seven hotels across North India (over 1,000 keys). Parallel actions by international operators, such as Accor’s continued brand expansion activity in India, add supply variety across delegate cohorts. Sustainability-forward venue capabilities, including ONGC’s Urja Bharat Convention Centre with energy storage infrastructure, also create differentiation in bids where ESG reporting and carbon accounting are procurement requirements.
Recent Industry Developments
- July 2026: ITC Hotels signed a definitive agreement to acquire 100% of GHK Hospitality and Infrastructures Ltd for an enterprise value of Rs 155 crore, bringing the 130-key Welcomhotel Ahmedabad into its owned-asset portfolio. The deal adds operating inventory in a major commercial market and supports faster scale-up of MICE-ready room blocks compared with greenfield builds.
- May 2026: ITC Hotels announced projects in Vishakhapatnam and at the Yashobhoomi complex in New Delhi, aligning new development with a high-profile convention district. Locating hospitality capacity around large venues improves group logistics and strengthens the ability to win and execute citywide events.
- September 2024: Yatra Online acquired Globe Travels for USD 15.25 million to deepen corporate travel and MICE capabilities. The acquisition expands control over sourcing and servicing for business-event travel, tightening integration between venue procurement, delegate movement, and on-ground execution.
Research Methodology Framework and Report Scope
Market Definition and Coverage
For this study, the market is defined as the spending tied to MICE travel activity in India, covering organized meetings, incentive trips, conferences, and exhibitions, along with the supporting event services delivered to run these programs.
Scope exclusions: Pure leisure tourism spend and long stay non-event corporate travel are excluded when they are not directly linked to a defined MICE event program.
Segmentation Overview
- By Event
- Meetings
- Incentives
- Conferences
- Exhibitions
- By Service Type
- Venue Rental & F&B
- Destination Management & Logistics
- Event Technology Enablement
- Creative & Production Services
- By End-User Industry
- Corporates
- Associations & Trade Bodies
- Government & PSUs
- Academic & Research
- By Region
- North India
- West India
- South India
- East & North-East India
Data Sources, Market Sizing, and Validation
Desk Research
Desk research was used to set the right market boundary and to build the starting data series for demand and supply signals. We referred to public sources such as Ministry of Tourism releases and statistical publications, Ministry of Civil Aviation traffic summaries, Reserve Bank of India data on travel services, and India tourism and hospitality updates from official state portals and convention bureau pages.
To make assumptions more realistic, we also reviewed annual reports and investor presentations of listed hospitality and venue operators, along with reputed press coverage of large venue launches and event calendars. For cross-checks, we used paid subscriptions that provide company financials and news, and we also used contract and tender tracking where venue and event management activity is visible in public procurement. These desk sources are illustrative only, and many other references were used to collect, validate, and clarify the final model inputs.
Primary Interviews and Surveys
Primary work focused on validating how MICE demand is being converted into paid events across major Indian hubs, and how spending splits between venues, logistics, production, and technology. We spoke with stakeholders across venues, event planners, destination managers, and corporate travel buyers, and the discussion was balanced across North, West, South, and East and North-East India to avoid over leaning on one destination cluster.
Distribution of primary research fieldwork respondents
| Company type | Respondent position |
|---|---|
| Top tier: 26% | CXOs: 12% |
| Mid tier: 57% | Functional/Unit leaders: 36% |
| Smaller Players: 17% | Managers: 52% |
Market-Sizing & Forecasting
Sizing was built using a top-down approach, where travel and events activity indicators were translated into a paid MICE demand pool and then converted into value using typical spend patterns seen in India. The totals were then corroborated using selective bottom-up approximations, such as sampling venue and event service pricing, using channel checks on delegate volumes, and reconciling the outcome with publicly visible capacity additions.
Key inputs used in the model included the pipeline of convention and exhibition infrastructure (including large venue commissioning timelines), business travel and air passenger movement trends that influence delegate movement, major national and international event calendars, hotel room additions near key venues, and the service mix across venue rental and F&B, destination management and logistics, creative and production, and event technology enablement. Where bottom-up inputs were incomplete for smaller cities and informal operators, gaps were handled through calibrated ranges agreed in interviews, and then tied back to the total demand pool so the sum stays consistent.
For forecasting, scenario analysis was applied around event pipeline realization, delegate travel friction, and average spend per event, and the variable paths were reviewed with industry participants to avoid overstating sudden jumps in value.
Data Validation & Update Cycle
Triangulation was done by checking model outputs against independent signals such as venue capacity utilization narratives, visible event frequency in key destinations, and changes in travel services indicators. Outliers were investigated by revisiting assumptions like average event size, mix of domestic versus inbound delegates, and pricing progression for venue and production services, followed by an analyst review before sign-off.
Reports are refreshed annually, and interim updates are triggered when material changes occur, such as policy shifts affecting conferences, major venue openings, or sharp travel disruptions. Before delivery, a final update pass is completed so clients receive the most current view available at the time of publication.
Mordor Intelligence's India Mice Tourism Market Size Versus Other Published Estimates
Published values for India MICE tourism do not always line up because the market boundary is not identical across sources, and because the spend items counted can shift the total by a large amount. Differences also come from the base year chosen and how inflation and pricing progression are applied to venue, F&B, and event services.
Government releases on MICE revenue and the visible ramp up in large venue capacity and event infrastructure are used as reality checks that keep Mordor Intelligence's 2025 estimate focused on MICE tourism linked to defined meetings, incentives, conferences, and exhibitions, rather than a wider events economy bucket.
Benchmark comparison
| Source | Market Size | Gaps in Research Methodology |
|---|---|---|
| Mordor Intelligence | USD 37.75 B (2025) | |
| Government Briefing A | USD 49.40 B (2024) | Uses a 2024 reference year and can reflect broader MICE industry revenue framing, which may include adjacent event activity beyond tourism-linked MICE travel programs, thereby lifting the headline value. |
| Trade Media B | USD 103.69 B (2030) | Presents a forward year estimate that depends heavily on aggressive pipeline conversion and pricing growth assumptions, and it is not always clear how service mix and event categories are kept consistent year to year. |
Overall, the spread is mainly explained by year selection and by how narrowly the MICE tourism boundary is drawn around event-linked travel and services. By keeping the inputs tied to event pipeline, travel movement, and spend mix checks, the sizing stays traceable to clear drivers that can be revisited when conditions change.
Key Questions Answered in the Report
How big is the India MICE Tourism market in 2026?
The market is valued at USD 42.25 billion for 2026, with a forecast to reach USD 74.12 billion by 2031.
What is the expected CAGR for the sector?
A 11.92% CAGR is projected between 2026 and 2031, positioning the segment among the fastest-growing in global business events.
Which event type generates the most revenue?
Meetings account for 59.65% of 2025 revenue, making them the anchor for venue utilization and service demand.
Which region is expanding fastest for MICE demand?
East India is emerging as the fastest-growing region in the India MICE market, driven by improving infrastructure and increased government focus on regional tourism development.
What policy measures support international delegate inflows?
The e-Conference visa grants approvals within 48 hours for applicants from 169 countries, significantly easing inbound travel logistics.