
India Medical Tourism Market Size and Share
Market Overview
| Study Period | 2020 - 2031 |
|---|---|
| Forecast Data Period | 2026 - 2031 |
| Base Year Market Size (2025) | USD 11.14 Billion |
| Market Size (2026) | USD 12.32 Billion |
| Market Size (2031) | USD 22.11 Billion |
| Growth Rate (2026 - 2031) | 12.42 % |
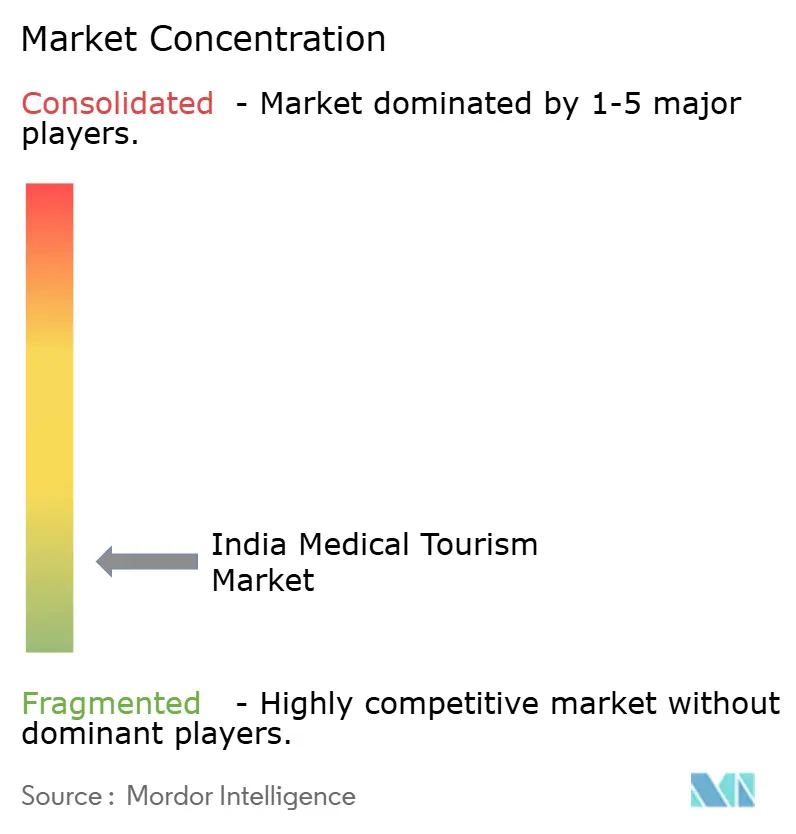
| Market Concentration | Low |
Major Players *Disclaimer: Major Players sorted in no particular order Image © Mordor Intelligence. Reuse requires attribution under CC BY 4.0. | |
India Medical Tourism Market Analysis by Mordor Intelligence
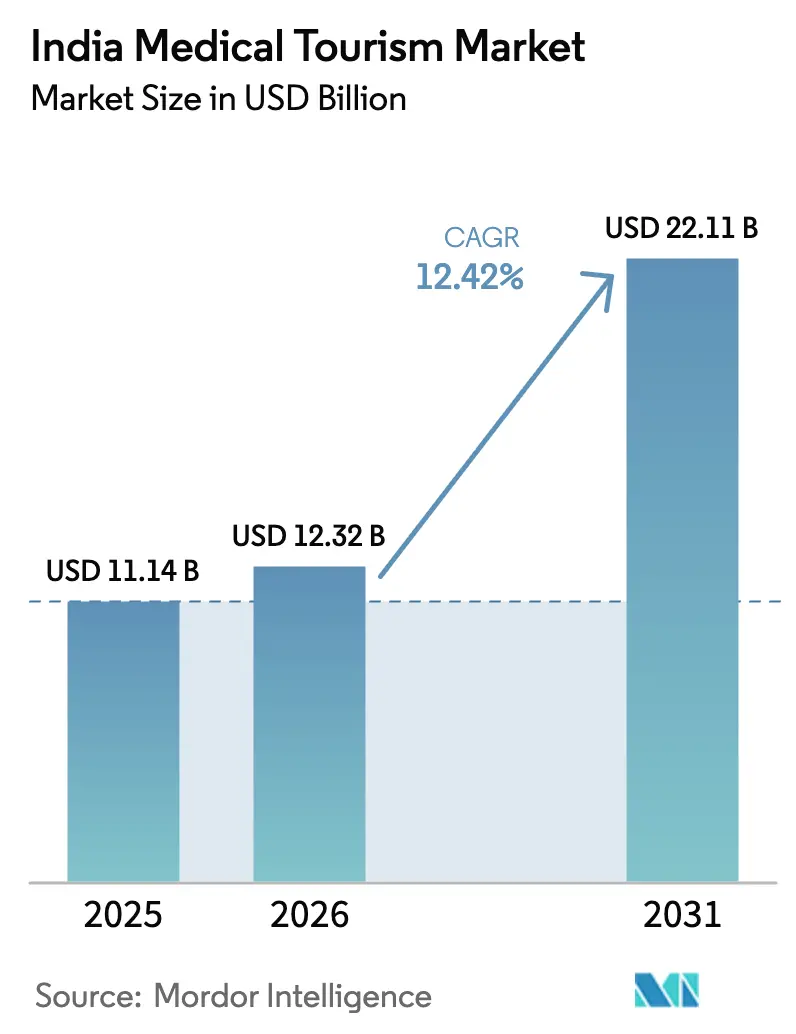
The India Medical Tourism Market size is expected to increase from USD 11.14 billion in 2025 to USD 12.32 billion in 2026 and reach USD 22.11 billion by 2031, growing at a CAGR of 12.42% over 2026-2031.
The growth rests on a sizeable cost gap versus OECD providers, wider access to JCI- and NABH-accredited hospitals, and faster e-Medical Visa clearance that now covers 167 countries. Foreign tourist arrivals for treatment jumped from 182,945 in 2020 to 644,387 in 2024, indicating a decisive post-pandemic rebound.[1] Oncology, transplant, and robotic surgery volumes are accelerating as public and private centers invest in proton therapy, CAR-T platforms, and da Vinci systems. Overseas insurance tie-ups with Maldives, Oman, and Mauritius further de-risk out-of-pocket spending. At the same time, the India medical tourism market capitalizes on digital tele-follow-up models that shorten stays and build patient confidence.
Key Report Takeaways
- By treatment type, cardiovascular surgery held 22.46% revenue share of the India medical tourism market in 2025 and oncology is advancing at a 16.73% CAGR to 2031.
- By service provider, private multi-specialty hospitals led with 66.22% of the India medical tourism market share in 2025, while facilitator platforms are growing at a 15.18% CAGR through 2031.
- By patient age, the 46-65 cohort accounted for 43.25% of the India medical tourism market size in 2025 and the 66-plus segment is expanding at a 13.32% CAGR to 2031.
- By patient gender, male cases dominated at 55.73% volume in 2025, whereas female-focused treatments are rising at a 13.58% CAGR through 2031.
- By Indian region, South India generated 33.26% revenue in 2025 and East-Northeast is on track for a 14.24% CAGR to 2031.
Note: Market size and forecast figures in this report are generated using Mordor Intelligence’s proprietary estimation framework, updated with the latest available data and insights as of January 2026.
India contributes to a system defined not by any single country or region but by the interaction of many. The global medical tourism market data by Mordor Intelligence represents that combined structure.
Market Trends and Insights
Drivers Impact Analysis of India Medical Tourism Market*
| Driver | (~) % Impact on CAGR Forecast | Geographic Relevance | Impact Timeline |
|---|---|---|---|
| Cost advantage of complex surgeries | +2.8% | Global, pronounced in South Asia, Middle East, Africa | Long term (≥ 4 years) |
| Expanding network of JCI/NABH hospitals | +2.1% | National, stronger in South and West India | Medium term (2-4 years) |
| ‘Heal in India’ and streamlined e-Medical Visa | +1.9% | Global, early gains from Bangladesh, Iraq, Maldives | Short term (≤ 2 years) |
| Robotics and transplant technology adoption | +1.7% | National, led by metro clusters | Medium term (2-4 years) |
| Overseas insurance tie-ups | +1.4% | Global, Maldives, Mauritius, Oman, Qatar | Medium term (2-4 years) |
| Tele-follow-up models | +1.2% | Global, useful across all source markets | Short term (≤ 2 years) |
| Source: Mordor Intelligence | |||
Cost Advantage Of Complex Surgeries Vs OECD Nations
India medical tourism market beneficiaries pay 60-80% less than OECD rates, with bypass grafts starting at USD 5,000 against USD 100,000 in the United States. Lower labor costs, high generic-drug penetration, and dense patient throughput sustain the edge. Growing African and Central Asian middle-income populations, now backed by international insurers, are choosing accredited Indian centers over pricier Southeast Asian hubs. This enduring pricing gap secures long-term volume inflows and positions the India medical tourism market for sustained double-digit expansion.
Expanding Network Of JCI/NABH-Accredited Hospitals
India hosts 57-61 JCI institutions and more than 4,650 NABH hospitals as of May 2025.[2] While 100 facilities received NABH digital health certification by September 2024, accreditation boosts insurer confidence, validates telemedicine systems, and attracts facilitator referrals. Corporate chains spread audit costs across multi-site footprints, and tier-2 providers in Coimbatore, Visakhapatnam, and Jaipur seek the seal to stand apart from unaccredited rivals. The pipeline suggests over 2,000 NABH hospitals by 2028, deepening the India medical tourism market capacity.
‘Heal In India’ Campaign & Streamlined E-Medical Visa
The medical value travel portal slashed visa approval to 48-72 hours and opened access to 167 countries. Early uptake includes 123 regular Ayush visas and 221 e-Ayush visas between July 2023 and December 2024.[3] Multilingual listings in Arabic, French, and Swahili narrow information gaps, while multiple entries over 60 days support staged care. As real-time bed availability goes live in 2026, the portal will convert into a direct marketplace, likely trimming facilitator commissions and lowering overall India medical tourism market prices.
Advanced Robotics & Transplant Technology Adoption
More than 170 da Vinci systems serve Indian hospitals, with 850-plus trained surgeons by 2025. Public sites such as NIMS Hyderabad completed 300 robotic surgeries within 12 months of launch. Apollo’s NexCAR19 CAR-T therapy and Tata Memorial’s proton unit widen oncology options at sub-USD 30,000, compared with USD 150,000-250,000 in the United States. Robotic kidney transplants at Fortis Noida cost USD 10,800-12,000 and cut hospital stay, elevating throughput. Domestic robot makers may drop system prices 20-25% by 2028, boosting India medical tourism market penetration into tier-2 cities.
Restraints Impact Analysis of India Medical Tourism Market*
| Restraint | (~) % Impact on CAGR Forecast | Geographic Relevance | Impact Timeline |
|---|---|---|---|
| Hygiene and safety perception issues | -1.3% | Global, severe in Europe and North America | Short term (≤ 2 years) |
| Airport and surface-transport bottlenecks | -0.9% | National, acute in Delhi, Mumbai, Bangalore | Medium term (2-4 years) |
| Rupee volatility eroding cost edge | -0.7% | Global, affects all source markets | Short term (≤ 2 years) |
| Bed-capacity squeeze in high-demand specialties | -0.6% | National, concentrated in metros | Medium term (2-4 years) |
| Source: Mordor Intelligence | |||
Hygiene And Safety Perception Issues Post-COVID-19
Media reports of outbreaks in unaccredited facilities fueled Western skepticism. Accredited centers post infection rates below 2%, yet some tier-2 units record 8-10%. Hospitals now publish live dashboards, pursue ISO 9001 certification, and welcome third-party audits to rebuild trust. The restraint weighs on near-term Europe- and U.S.-origin flows but is expected to ease as data transparency improves within the India medical tourism market.
Airport And Surface-Transport Bottlenecks
International passenger traffic reached 66.8 million in FY 2023-24, straining Delhi, Mumbai, and Bangalore, where immigration queues exceed 90 minutes. Surface trips to city hospitals add up to 90 minutes at peak time, and limited flights to Guwahati or Coimbatore restrict flexibility. New terminals and Digi Yatra have added capacity, yet lag growth. Better connectivity remains crucial for seamless India medical tourism market access.
*Our forecasts treat driver/restraint impacts as directional, not additive. The impact forecasts reflect baseline growth, mix effects, and variable interactions.
India Medical Tourism Market Segment Analysis
By Treatment Type:
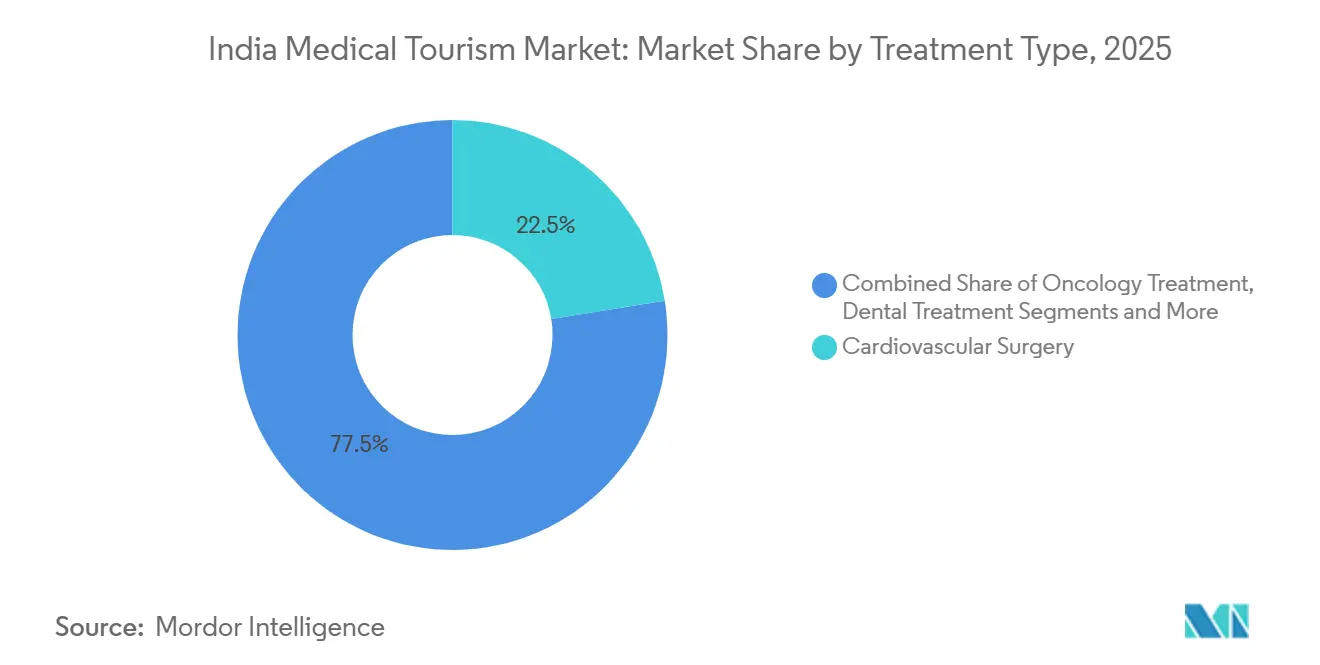
Cardiac Base, Oncology UpswingCardiovascular surgery contributed 22.46% revenue to the India medical tourism market in 2025, anchored by USD 5,000 bypass grafts that beat OECD prices by 70-80%. Oncology outpaces others with a 16.73% CAGR through 2031, led by proton therapy at Tata Memorial and Apollo’s CAR-T cell platform. Orthopedic and spine work attracts aging Gulf patients, while neurosurgery draws tumors and epilepsy cases from Africa. Robotic kidney transplants, fertility services, bariatric procedures, and cosmetic surgery widen the clinical mix, balancing cyclical dips in any one specialty.
India medical tourism market size for oncology treatments is set to climb sharply as proton therapy slots rise and CAR-T becomes mainstream. Cardiac centers will keep core volume but face price compression from subsidy programs at government sites. Elective aesthetic care serves younger, social-media-savvy travelers and raises average margins. Segment diversity maintains overall resilience.

By Service Provider:
Corporate Chains And Digital FacilitatorsPrivate multi-specialty chains captured 66.22% of India medical tourism market revenue in 2025, supported by 200-plus tertiary sites, multilingual liaisons, and insurer links. Facilitator platforms are growing at 15.18% CAGR as Vaidam and peers bundle visas, cost quotes, and tele-follow-up into user-friendly packages. Public hospitals such as AIIMS Guwahati and NIMS Hyderabad offer subsidized robotics and transplant work, undercutting private rates by up to 50%.
Corporate groups rely on facilitators for low-cost distribution into Africa and Central Asia, creating symbiosis rather than rivalry. Single-specialty clinics target ophthalmology or fertility niches with shorter wait times and deeper expertise. The India medical tourism market size for facilitator services is likely to expand as cross-border patients with limited India familiarity value full-service logistics.
By Patient Age Group:
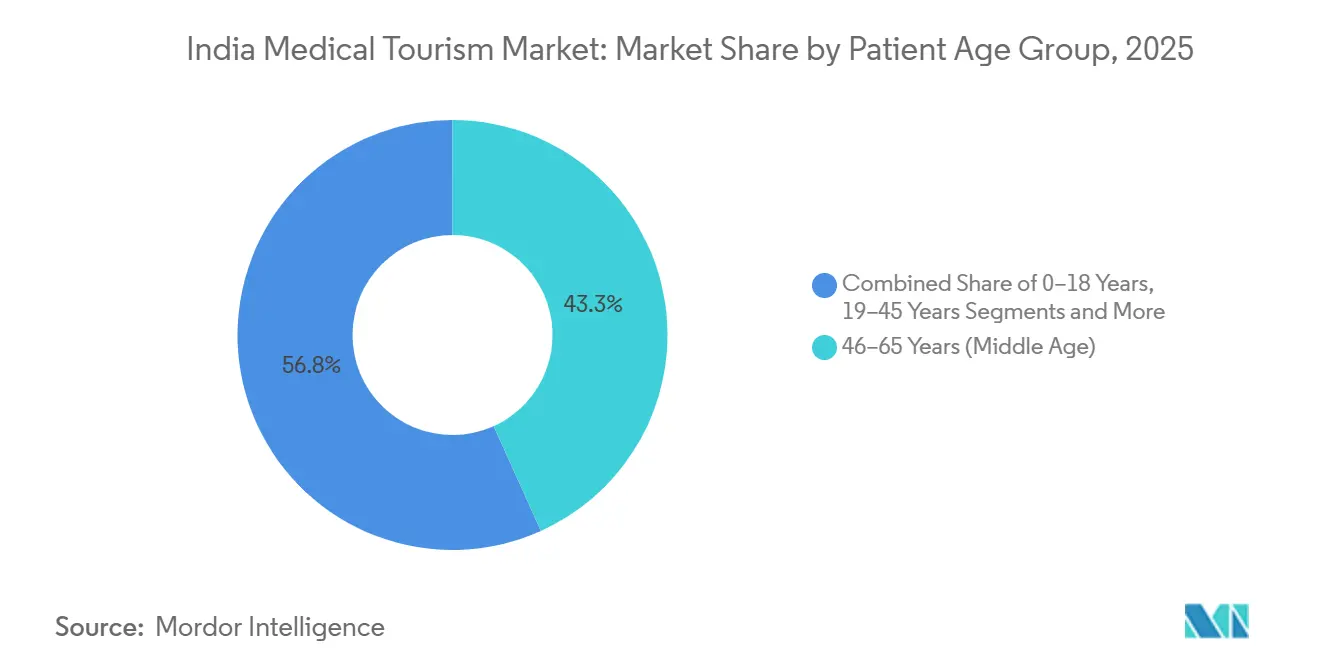
Middle-Age Core, Geriatric WaveThe 46-65 segment represented 43.25% of India medical tourism market size in 2025 owing to cardiac and orthopedic demand. The 66-plus cohort will rise at a 13.32% CAGR to 2031 as chronic multi-morbidity spreads. Hospitals are building geriatric wards with fall-safe rooms and elder-care nurses. Young adults drive fertility, bariatric, and cosmetic cases and choose providers through social media. Pediatric flows revolve around congenital heart and oncology care, where parents seek global benchmarks.
Geriatric growth boosts average revenue per case but needs specialized rehab and palliative facilities. Providers that invest early will dominate an age-skewed future India medical tourism market.
By Patient Gender:
Female Treatments AscendMale patients accounted for 55.73% volume in 2025, topping cardiovascular and orthopedic procedures. Female-centric care—IVF, cosmetic, bariatric, gynecologic oncology—grows at 13.58% CAGR through 2031. Hospitals respond with women’s wellness centers, female surgeons, and private recovery suites. Gender-affirmation inquiries, still small, signal expanding inclusivity.
Targeted marketing distinguishes female decision drivers of testimonials and peer advice from male focus on clinical metrics, helping providers fine-tune outreach in the India medical tourism market.
Geography Analysis
South India’s entrenched clinical ecosystem keeps international infection control and outcomes on par with OECD benchmarks. Tamil Nadu alone welcomes about 1.5 million treatment seekers yearly and staffs 48 government medical colleges, ensuring low labor costs and high surgeon availability. Kerala layers Ayurveda and yoga programs to attract wellness travelers, aided by simplified e-visa rules. Multilingual coordinators fluent in Arabic, French, and Swahili smooth patient journeys.
East-Northeast advances on geographic closeness to Bangladesh, which supplied 54% of arrivals in 2023. AIIMS Guwahati intends to double beds to 750, while private projects add 1,000-plus beds. Although flight frequencies remain low, UDAN has opened 619 new routes to underserved airports, gradually closing the access gap.
West, North, and Central India make up the remainder. Maharashtra’s new accreditation scheme aims to curb quality variations. Delhi-NCR’s heavy traffic lengthens patient transfers despite brand recognition. Central India lacks accredited capacity but may rally as corporate chains evaluate Nagpur expansions. These dynamics reveal a diversifying India medical tourism market, with competition based on outcomes, cost, and logistics rather than legacy reputation alone.
The medical tourism market is analyzed by Mordor Intelligence across multiple other geographies, with in-depth regional assessments available for Asia and Europe. This is complemented by country-specific insights for Japan, Spain, and Turkey, reflecting various localized market behavior and policy environments' coverage.
Regulatory Landscape
India medical tourism is shaped by an inter-ministerial framework led by the Ministry of Tourism through the National Medical & Wellness Tourism Promotion Board (constituted in 2015) and guided by the National Strategy and Roadmap for Medical and Wellness Tourism. Entry and stay for overseas patients is enabled through the e-Medical Visa and e-Medical Attendant Visa, supporting a faster, more standardized patient onboarding across source markets.
Quality and compliance are anchored by accreditation. The National Accreditation Board for Hospitals & Healthcare Providers (NABH) covers hospitals as well as wellness centers and dental clinics, while international accreditations are used by large private hospital chains to build inbound trust. On the supply side, policy signals in FY 2026-27 pointed to public support for creating five Regional Medical Hubs in partnership with the private sector, linking regulatory intent to capacity build-out and integrated care pathways (including AYUSH), with more formal referral and facilitation workflows.
Value Chain Analysis
The India medical tourism value chain begins with discovery and decision support via government and industry portals, as well as private facilitator platforms. This is followed by pre-travel triage, cost quoting, and visa coordination. Industry bodies such as the Services Export Promotion Council (SEPC) support ecosystem visibility through the India Healthcare Tourism portal, while provider selection is commonly filtered by accreditation (NABH/JCI) and specialty depth across cardiac, oncology, transplants, and advanced surgery.
Care delivery is concentrated in multi-specialty corporate hospitals and select public institutions, supported by diagnostics, device and implant suppliers, pharmacies, and blood banks. Revenue uplift is tied to high-acuity ICU capability and advanced procedure infrastructure, while post-procedure rehabilitation, step-down care, and tele-follow-up help reduce repeat travel, especially for oncology and transplant journeys. The FY 2026-27 emphasis on five Regional Medical Hubs aims to strengthen integration across hospitals, AYUSH centers, diagnostics, rehabilitation, and hospitality partners, tightening handoffs across the chain and improving throughput during peak inbound periods.
Competitive Landscape
Apollo, Fortis, Manipal, Narayana, and Max hold major share of organized India medical tourism market revenue. Apollo grew international revenue 18% in FY 2023-24 after scaling proton therapy and CAR-T. Max recorded 27% growth, backed by new lounges and insurer ties. Manipal and Fortis emphasize cashless treatment networks and robotic transplant milestones. Chains are vertically integrating diagnostics and pharmacies to keep ancillary revenue in-house.
Facilitator platforms such as Vaidam use AI chatbots and virtual tours to cut traditional broker commissions to 8-12%, improving price transparency. Public centers like AIIMS Guwahati underprice private peers but lack marketing budgets. Market entry by insurers via provider joint ventures could intensify price competition and force greater outcome disclosure, reshaping the India medical tourism market.
India Medical Tourism Industry Leaders
-
Apollo Hospitals
-
Fortis Healthcare
-
Max Healthcare
-
Narayana Health
-
Manipal Hospitals
- *Disclaimer: Major Players sorted in no particular order
India Medical Tourism Market Companies Covered in this Report
- ANAVARA
- Apollo Hospitals
- Artemis Hospital
- Aster DM Healthcare (India)
- BLK-Max Super Speciality Hospital
- Forerunners Healthcare
- Fortis Healthcare
- Gleneagles Global Hospitals
- KIMS Hospitals
- Manipal Hospitals
- Max Healthcare
- Medanta – The Medicity
- MediConnect India
- Mediniq
- Narayana Health
- Sri Ramachandra Medical Centre
- Tour2India4Health
- Vaidam
- Yashoda Hospitals
Market Opportunities and Future Outlook
A key whitespace is the development of integrated, destination-like care corridors that combine high-acuity hospital services with rehabilitation, AYUSH, diagnostics, and patient navigation, aligned with the FY 2026-27 announcement to support states in establishing five Regional Medical Hubs in partnership with the private sector. This program-level push gives tier-2 and non-metro cities a clearer path to participate in medical value travel beyond traditional metro clusters, while reducing friction in lodging, transfers, and post-acute care coordination.
Capacity addition and specialty scaling across large hospital chains broaden the addressable pool of international patients seeking shorter waits for complex procedures. Max Healthcare has outlined a multi-year bed expansion program (including a stated target of building toward 10,000 beds over 3-4 years), and Apollo Hospitals communicated a large capex plan tied to bed additions by FY30. Narayana Health has also disclosed a multi-year bed addition plan. Together with ongoing reliance on accreditation and standardized clinical pathways, these build-outs create commercial room for facilitator platforms, insurer tie-ups, and outcome-led service lines (stroke, chest pain, advanced ICU, and oncology) that move inbound demand from cost-only shopping toward quality-assured care selection.
Recent Industry Developments in India Medical Tourism Market
- July 2026: Apollo Hospitals inaugurates an 11-bed 'ICU of the Future' in Jubilee Hills, Hyderabad, in partnership with Medtronic. The expansion of advanced ICU capacity for international patients increases high-acuity care offerings and strengthens Apollo's complex-procedure positioning within India medical tourism. It also adds a tighter hospital-technology integration for inbound workflows.
- June 2026: Apollo Hospitals Bangalore facility becomes first in India to receive dual American Heart Association certifications for Comprehensive Stroke Center and Comprehensive Chest Pain Center. The benchmarking international accreditation for stroke and chest-pain care supports trust for international patients and underpins premium referral potential. This accreditation also broadens the hospital's appeal to foreign insurers and networks.
- May 2026: Apollo Hospitals launches 76th hospital, a 400-bed smart facility, in Hyderabad’s Financial District. The project expands capacity in a key metro hub and contributes to Apollo’s domestic footprint for medical tourism demand. It signals scale-up in private-sector capacity aimed at attracting foreign patients.
India Medical Tourism Market Report Scope and Research Methodology
Market Definition and Coverage
For this study, the India medical tourism market is defined as revenues linked to inbound patients who travel to India mainly for medical treatment, including the clinical procedure and the closely tied patient services arranged around that care.
Scope exclusions: Domestic patients, outbound Indians seeking care abroad, and non-medical leisure travel are excluded even if healthcare is incidentally used.
Segments Covered in This Report
- By Treatment Type
- Dental Treatment
- Cosmetic & Aesthetic Procedures
- Cardiovascular Surgery
- Orthopedic & Spine Surgery
- Neurology & Neurosurgery
- Oncology Treatment
- Organ & Tissue Transplant
- Fertility & Reproductive Treatment
- Bariatric & Metabolic Surgery
- Ophthalmology Procedures
- Others
- By Service Provider
- Public Hospitals
- Private – Multi-Specialty Corporate Hospitals
- Private – Single-Specialty Hospitals & Clinics
- Medical Tourism Facilitators
- By Patient Age Group
- 0–18 Years (Pediatrics)
- 19–45 Years (Young Adults)
- 46–65 Years (Middle Age)
- 66+ Years (Geriatrics)
- By Patient Gender
- Male
- Female
- Other / Non-Binary
- By Indian Region
- North India
- West India
- South India
- East & Northeast India
- Central India
Data Sources, Market Sizing, and Validation
Desk Research
Desk work started with mapping inbound care demand signals, then translating those signals into a repeatable revenue model. We referenced public datasets and policy cues that indicate inbound travel volume and treatment capacity, such as Bureau of Immigration and Ministry of Tourism releases, plus Reserve Bank of India balance of payments notes where relevant.
To keep assumptions grounded, we also reviewed sources such as FICCI publications on medical value travel, National Health Authority and Ayushman Bharat program updates for hospital ecosystem readiness, and peer-reviewed clinical literature that clarifies procedure mix and length of stay patterns. These were supplemented with hospital annual reports, investor presentations, reputable press coverage of expansion plans, and a paid subscription for company financials, news screening, and patent lookups to validate claims and track new service offerings. The sources cited are illustrative, and additional public and paid references were used to fill gaps, cross-check, and clarify inconsistencies.
Primary Interviews and Surveys
Primary work was used to pressure-test the desk assumptions on patient inflows, treatment mix, and billable items that providers and facilitators consistently count. We spoke with hospital leaders, international patient desk teams, clinicians, travel facilitators, and insurance or TPA-linked stakeholders across key Indian destination cities to confirm pricing logic and typical care pathways (pre-op, procedure, follow-ups).
Distribution of primary research fieldwork respondents
| Company type | Respondent position |
|---|---|
| Top tier: 39% | CXOs: 12% |
| Mid tier: 47% | Functional/Unit leaders: 36% |
| Smaller Players: 14% | Managers: 52% |
Market-Sizing & Forecasting
Sizing is built using top-down logic where inbound medical traveler counts and treatment intensity are reconstructed from travel purpose indicators, hospital throughput signals, and validated procedure mix, which are then converted into revenue using typical price bands. We corroborate the totals with selective bottom-up checks such as sampled provider revenue attribution to international patients, facilitator channel checks, and ASP times volume sanity tests for higher-frequency procedures.
Key model inputs include medical visa and travel-purpose trends, case mix by specialty (for example, cardiac, orthopedic, oncology, and fertility pathways), average length of stay and companion travel patterns, hospital capacity additions in destination hubs, and average procedure package pricing with expected annual price progression. When direct values are missing, gaps are handled using bounded ranges from interviews and a conservative midpoint that is revisited during validation.
Forecasts are developed using scenario analysis supported by variable-level views from experts. The demand path is adjusted for visa rules, flight connectivity, healthcare capacity build-out, and price competitiveness versus key alternative destinations. Each scenario is reconciled back to realistic patient volumes and plausible revenue per traveler so the final numbers remain explainable on a client call.
Data Validation & Update Cycle
Outputs are validated through triangulation across demand signals, capacity indicators, and pricing assumptions, and then checked for year-to-year jumps that do not align with what providers report as operational reality. We run variance checks at the India total and regional level, and any outliers trigger a re-check of the input series and a short follow-up with relevant interviewees.
Before sign-off, the model and write-up go through multi-step internal review so the market totals, growth drivers, and assumptions stay consistent across the report. The report is refreshed annually, with interim updates when major policy changes, travel disruptions, or large capacity announcements materially change the outlook. Right before delivery, an analyst completes a final pass to ensure clients receive the latest updated view.
Mordor Intelligence's India Medical Tourism Market Size Versus Other Published Estimates
Published estimates for India medical tourism can look far apart because the counted revenue items and the assumed patient mix are not consistent across sources, and the reporting year can vary as well. Differences also come from whether a study treats medical travel as only hospital procedure revenue, or as a wider trip spend that adds lodging, local transport, and tourism activities.
By tracking medical visa and travel-purpose signals, refreshing hospital package price bands, and re-checking procedure mix with interviews, Mordor Intelligence keeps the India medical tourism model tied to billable care and closely linked patient services rather than broader tourism receipts. Some external estimates also use aggressive growth assumptions without showing the implied patient volume ramp, which can inflate the near-term number.
Benchmark comparison
| Source | Market Size | Gaps in Research Methodology |
|---|---|---|
| Mordor Intelligence | USD 11.14 B (2025) | |
| Trade Journal A | USD 8.71 B (2025) | Uses a narrower revenue boundary that appears closer to hospital procedure receipts only, and it under-weights complex specialties that carry higher package values. |
| Industry Brief B | USD 7.69 B (2024) | Anchors the estimate to an earlier year and relies on a headline value without clearly reconciling implied patient volumes, procedure mix, and price progression into a consistent revenue build. |
The spread in the table mainly reflects what gets counted and how quickly volumes and prices are assumed to move. When the revenue boundary is kept tight and the patient mix is reconciled to plausible arrivals and package values, the resulting market size becomes easier to trace, explain, and refresh as new travel and capacity signals emerge.
Key Questions Answered in the Report
How large is the India medical tourism market in 2026?
It is valued at USD 12.32 billion and is projected to grow at a 12.42% CAGR to USD 22.11 billion by 2031.
Which specialty is growing fastest for international patients in India?
Oncology services are expanding at a 16.73% CAGR, driven by proton therapy and CAR-T cell treatments.
What share do private multi-specialty hospitals hold?
They commanded 66.22% of India medical tourism market revenue in 2025.
Why is South India the leading region?
The region hosts more than 50 accredited hospitals, streamlined visa support, and specialized cardiac and transplant centers.
How are hospitals addressing post-treatment follow-up for overseas patients?
Providers use regulated telemedicine platforms, WhatsApp, and video consultations funded by state schemes to manage recovery without repeat travel.
What factors could restrain future growth?
Hygiene perception gaps, transport bottlenecks, currency volatility, and limited oncology bed capacity can temper near-term expansion.