
Market Overview
| Study Period | 2020 - 2031 |
|---|---|
| Forecast Data Period | 2026 - 2031 |
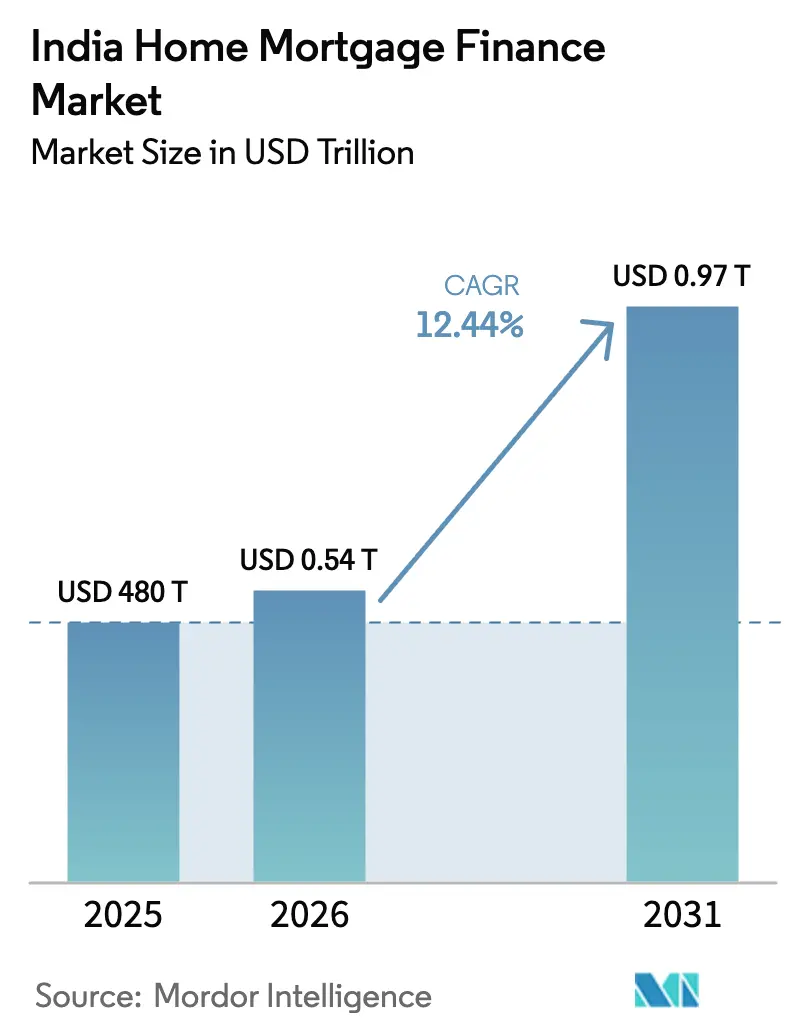
| Base Year Market Size (2025) | USD 480 Trillion |
| Market Size (2026) | USD 0.54 Trillion |
| Market Size (2031) | USD 0.97 Trillion |
| Growth Rate (2026 - 2031) | 12.44 % |
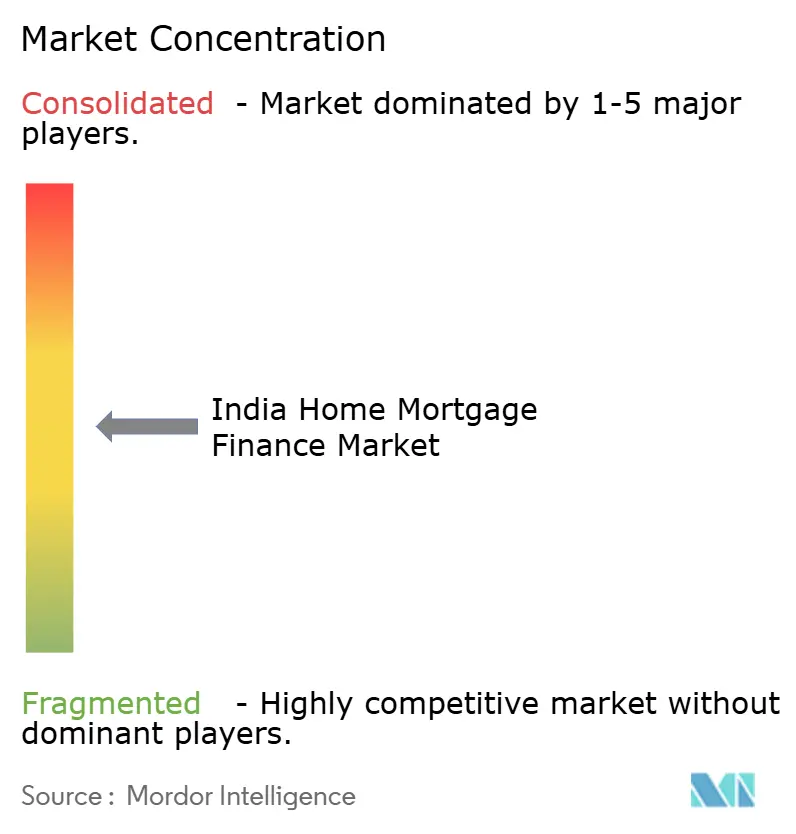
| Market Concentration | Medium |
Major Players *Disclaimer: Major Players sorted in no particular order Image © Mordor Intelligence. Reuse requires attribution under CC BY 4.0. | |
India Home Mortgage Finance Market Analysis by Mordor Intelligence
India home mortgage finance market size in 2026 is estimated at USD 539.71 billion, growing from 2025 value of USD 480 billion with 2031 projections showing USD 969.52 billion, growing at 12.44% CAGR over 2026-2031. The surge reflects a structural rather than cyclical shift, propelled by subsidy-backed demand, easier monetary conditions, institutional appetite for the country’s debut residential mortgage-backed securities (RMBS), and widespread digital-onboarding infrastructure. A 100 basis-point repo-rate cut has improved affordability, the expanded PMAY-Urban 2.0 budget has created predictable loan pipelines, and open-API lending rails have shortened approval times from weeks to days[1]. Further momentum arises from AI-driven underwriting that unlocks thin-file borrowers, while the first RMBS listing re-prices lender funding costs, allowing housing finance companies (HFCs) to challenge deposit-funded banks on price without compromising service agility. This convergence of policy and technology is tilting competitive boundaries and sustaining double-digit expansion across the Indian home mortgage finance market.
Key Report Takeaways
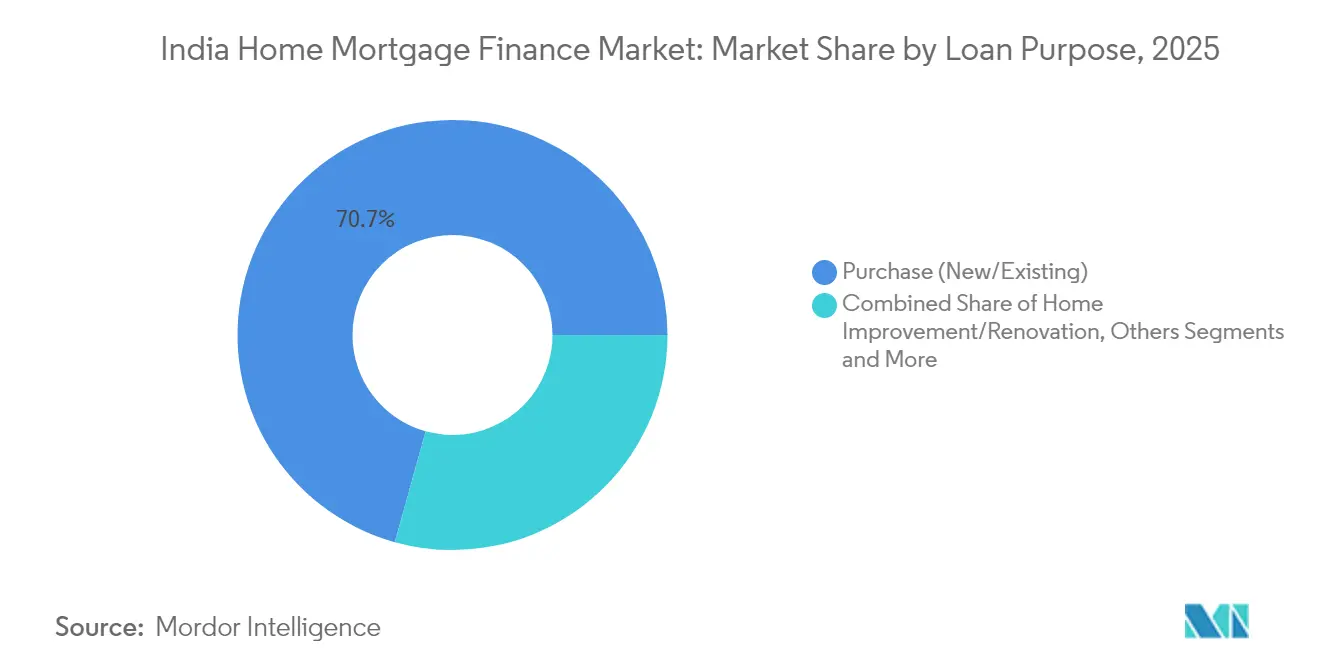
- By loan purpose, purchase loans controlled 70.68% of the Indian home mortgage finance market in 2025; loan against property is projected to grow at 15.02% CAGR through 2031.
- By provider, banks held 62.10% of the Indian home mortgage finance market share in 2025, whereas HFCs are expanding at 13.52% CAGR.
- By interest rate type, floating-rate loans represented 83.40% of the Indian home mortgage finance market size in 2025 and are advancing at 14.31% CAGR to 2031.
- By tenure, the 11–20 year bracket captured 56.05% of the Indian home mortgage finance market in 2025; loans above 20 years are rising at 13.22% CAGR.
Note: Market size and forecast figures in this report are generated using Mordor Intelligence’s proprietary estimation framework, updated with the latest available data and insights as of 2026.
India Home Mortgage Finance Market Trends and Insights
Drivers Impact Analysis*
| Driver | (~) % Impact on CAGR Forecast | Geographic Relevance | Impact Timeline |
|---|---|---|---|
| Affordable-housing push (PMAY-Urban & Rural) | +2.8% | National; tier-2/3 focus | Long term (≥ 4 years) |
| Formal-sector wage growth in tier-2/3 cities | +2.1% | Tier-2/3 nationwide | Medium term (2-4 years) |
| Mutual-fund & insurer demand for RMBS | +1.4% | National | Medium term (2-4 years) |
| Open-banking APIs for digital KYC | +1.8% | Urban → rural | Short term (≤ 2 years) |
| EWS/LIG mortgage-guarantee schemes | +1.6% | National | Medium term (2-4 years) |
| AI-credit scoring for thin-file borrowers | +1.9% | Rural & semi-urban | Short term (≤ 2 years) |
| Source: Mordor Intelligence | |||
Expanding Affordable-Housing Push (PMAY-Urban & Rural)
PMAY-Urban 2.0 earmarks USD 536 billion through 2029, embedding trunk infrastructure, transport links, and social amenities that lift end-user demand. The scheme’s Credit Risk Guarantee Fund lets lenders extend sub-8% rates to EWS and LIG borrowers by lowering capital charges and risk weights. Lenders equipped with rural sourcing networks benefit as the programme mandates 2 crore rural units, pressuring traditional banks to expand into smaller centers. HFCs such as Aadhar Housing Finance and Aavas Financiers gain competitive headroom because they already serve low-ticket borrowers with lean, tech-first operations. These reinforcing dynamics enlarge the India home mortgage finance market and foster sustainable portfolio diversity.
Rapid Formal-Sector Wage Growth in Tier-2/3 Cities
Economic decentralization has moved 60% of GDP creation to smaller cities, where property remains more affordable relative to incomes. Industrial corridors under Gati Shakti cut transit times and raise land values, allowing lenders to underwrite on stronger collateral bases. Corporate relocations widen the salaried borrower pool, encouraging customized EMI-holiday and step-up repayment products that suit evolving income profiles. Manufacturing jobs created by Production-Linked Incentive schemes stabilize borrower cash flows, which improves risk metrics for lenders active in emerging clusters. Together, these shifts drive geographic rebalancing within the India home mortgage finance market and temper concentration risk.
Growing Securitization Appetite of Mutual Funds & Insurers
India’s inaugural RMBS placement in May 2025 marked a watershed, delivering a 50–75 bp funding cost advantage for originators and broadening investment options for asset managers overseeing USD 500 billion[2]. Revised RBI guidelines now mandate granular pool-level disclosure, boosting transparency and institutional confidence. Secondary-market liquidity is rising, enabling smaller HFCs to recycle capital faster and scale loan books beyond balance-sheet limits. Competitive pricing pressure forces banks to revamp rate strategies, sharpening consumer options across the credit spectrum. This securitization flywheel expands the India home mortgage finance market by unlocking fresh capital flows.
Open-Banking APIs Accelerating Digital KYC & Disbursal
The Reserve Bank’s Unified Lending Interface merges Aadhaar, UPI, and banking data, slashing average approval times from 21 days to 3 days for early adopters[3]. Lenders cite 40% cuts in acquisition costs and 60% faster sanction volumes, translating into keener pricing and broader reach. Standardized APIs encourage fintech-bank partnerships, allowing origination scale without heavy branch investments. Rural borrowers benefit from vernacular-language onboarding and reduced documentation friction, shifting previously informal credit demand into formal channels. These improvements broaden the addressable borrower base and intensify competition inside the India home mortgage finance market.
Restraints Impact Analysis*
| Restraint | (~) % Impact on CAGR Forecast | Geographic Relevance | Impact Timeline |
|---|---|---|---|
| NPA overhang in PSU-bank mortgage books | -1.8% | National; rural-skewed | Medium term (2-4 years) |
| Substitution by BNPL & unsecured personal credit | -1.2% | Urban → tier-2 | Short term (≤ 2 years) |
| Climate-risk premiums in coastal districts | -0.9% | Coastal & flood zones | Long term (≥ 4 years) |
| Land-title fragmentation slows enforcement | -1.4% | National; peri-urban | Long term (≥ 4 years) |
| Source: Mordor Intelligence | |||
Persistent NPA Overhang in PSU-Bank Mortgage Books
Public-sector banks report mortgage NPA ratios between 1.02% and 5.73%, far higher than private peers’ 0.20–0.64% bands, reflecting legacy risk-management gaps. Bureaucratic foreclosure procedures extend recovery cycles, compelling higher provisioning that constrains fresh affordable-housing lending. Risk-averse underwriting sidelines borderline borrowers who might otherwise qualify, siphoning market share toward agile HFCs. While capital infusions help shore up buffers, operating discipline still lags, limiting price competitiveness in the India home mortgage finance market. Until balance-sheet clean-ups accelerate, PSU banks will trail volume growth leaders.
Crowding-Out from Alternative Retail Credit (BNPL & Unsecured Personal)
Buy-now-pay-later and unsecured personal loans offer instant credit, fostering consumption-first behavior among millennials who delay home-purchase decisions. These products already account for 52% of fresh retail NPAs, threatening spill-over stress into secured portfolios if borrower leverage peaks. BNPL platforms build customer stickiness that competes with mortgage down-payment savings, reducing conversion pools. RBI’s higher risk weights on unsecured books can temper supply but may also raise cross-product pricing, nudging borrowers toward informal channels. This substitution effect marginally curtails growth avenues within the India home mortgage finance market.
*Our forecasts treat driver/restraint impacts as directional, not additive. The impact forecasts reflect baseline growth, mix effects, and variable interactions.
Segment Analysis
By Loan Purpose: Purchase Dominance Amid LAP Acceleration
Purchase mortgages retained a 70.68% share of the India home mortgage finance market in 2025, cementing home-ownership aspirations in a culture that views residential property as the premier wealth-building asset. Government subsidies, 90% loan-to-value (LTV) caps for sub-INR 30 lakh tickets, and improved job prospects fuel this preference. Developers in tier-2 hubs align new launches with 2- and 3-BHK formats, ensuring product-market fit for salaried buyers. Falling mortgage rates spur refinance demand, enlarging the pool of rate-switch transactions that pad fee income for lenders.
Loan against property (LAP) enjoys 15.02% CAGR, buoyed by MSME owners converting idle residential equity into working capital amid limited unsecured business‐credit channels. Digitized valuation platforms and desktop appraisals shrink turnaround to under 72 hours, differentiating LAP from traditional bank overdrafts. Home-improvement loans gain traction as rising disposable incomes encourage aesthetic upgrades, especially in growing tier-2 markets where property price appreciation unlocks usable equity. Construction loans scale cautiously under RERA-linked stage-disbursement models that improve consumer protection but elongate revenue recognition for developers. The “Others” bucket—refinance and top-up loans—expands as rate differentials encourage port-over activity, further enlarging the India home mortgage finance market size.

By Provider: Banks Leverage Cost Advantages Despite HFC Innovation
Banks commanded a 62.10% share of the India home mortgage finance market in 2025, exploiting low-cost CASA deposits, wide branch grids, and cross-sell capabilities. Integrated salary-account bundling lowers acquisition expenses, while treasury operations hedge interest risk through dynamic asset-liability management. Yet, balance-sheet optimization is evident: HDFC Bank sold USD 717 million mortgages to free capital for higher-yield assets.
Housing finance companies clock 13.52% growth by targeting underserved borrowers with lean cost structures and swift sanction cycles. Their gross-NPA ratios below 1.5% underscore disciplined underwriting, even as they penetrate deeper into semi-urban geographies. Co-lending models pair bank liquidity with HFC origination prowess, blending cost and reach advantages. Fintech-enabled HFCs mine alternate data—utility payments, GST returns—to widen credit funnels, challenge incumbents, and diversify the India home mortgage finance market share distribution.
By Interest Rates: Floating Rate Preference Amid Declining Cycle
Floating-rate loans dominate with 83.40% share of the India home mortgage finance market in 2025, as borrowers expect accommodative policy continuity; June 2025’s 50 bp repo cut to 5.5% immediately fed through 10–15 bp MCLR reductions. Lenders now price floating mortgages with fortnightly repo resets, offering transparency to rate-sensitive customers.
Fixed-rate products attract risk-averse profiles anticipating bottom-of-the-cycle lows, but penalty-free prepayments on floating loans tilt value perception. Hybrid structures—two-year fixed transitioning to floating—address rate-cycle uncertainties for sophisticated borrowers who benchmark against inflation expectations. Competition prompts granular pricing bands linked to credit scores, enhancing customer choice and sustaining breadth in the India home mortgage finance market.

By Loan Tenure: Extended Terms Reflect Affordability Pressures
The 11–20 year bracket captured 56.05% share of the India home mortgage finance market in 2025, balancing EMI affordability with manageable total interest outgo. This tenure benefits from historically lower delinquencies, prompting lenders to price it most aggressively.
Loans beyond 20 years grow 13.22% as rising metropolitan real-estate costs stretch debt-service ratios; extended amortization keeps EMIs within 35% of monthly income caps. Banks experiment with step-up EMIs synced to anticipated salary growth for IT and manufacturing professionals. Sub-10-year contracts remain niche, appealing to high-income borrowers prioritizing rapid equity build-up and tax-dedication optimization. These diverse tenure structures enrich the Indian home mortgage finance market and enhance portfolio risk dispersion.
Geography Analysis
Southern and western states dominate credit penetration: Maharashtra and Telangana record housing-loan-to-GSDP ratios of 18.49% and 18.44% respectively, driven by IT clusters, established banking infrastructure, and higher formal-sector employment. Robust demographic inflows of young professionals secure demand pipelines, while state-level stamp-duty rebates spur first-time purchases.
Northern India’s National Capital Region benefits from proximity to federal administration and consistent infrastructure capex; satellite towns such as Noida Extension and Sohna Road draw developers focused on mid-income buyers. PMAY-Urban 2.0 allocations prioritize Delhi’s peri-urban belts, ensuring supply alignment with subsidy-eligible borrowers. Industrial corridors connecting Lucknow and Kanpur stimulate salaried employment, fueling mortgage uptake.
Eastern corridors still trail national averages in mortgage penetration due to lower per-capita incomes, but connectivity upgrades under the Gati Shakti program reduce logistics costs and entice manufacturing investments. Gradual formalization of wages promises future demand uplift. Tier-2 and tier-3 cities across all regions account for 44% of developer land acquisitions, supported by 20% year-on-year housing-sales growth and property price jumps of up to 65% in 2024. Rural potential expands as the Registration Bill 2025 digitizes land records, reducing title risk and paving the way for collateral-secure lending. These evolving patterns ensure the India home mortgage finance market remains geographically diversified.
Regulatory Landscape
India home mortgage finance operates under a dual supervisory framework led by the Reserve Bank of India (RBI) and the National Housing Bank (NHB), with RBI Master Directions setting prudential norms for banks and non-bank housing lenders. RBI issued the Reserve Bank of India (Housing Finance Companies) Directions, 2025 on April 15, 2026, including a minimum 15% capital requirement on aggregate risk-weighted assets and limits such as housing finance companies exposure to capital markets capped at 40% of net worth (as of March 31 of the previous year), which tightens balance-sheet discipline for HFC-led mortgage growth.
Risk-transfer and credit discipline are also being reinforced through targeted rule updates. The RBI (Mortgage Guarantee Companies) Amendment Directions, 2026 became effective March 10, 2026, and clarified owned funds and Tier 1 capital computation, supporting mortgage-guarantee-linked affordable lending. In parallel, RBI updated the Reserve Bank of India (Urban Co-operative Banks, Credit Facilities) Directions, 2025 on April 1, 2026, including an aggregate exposure limit to residential mortgages at 25% of total loans for non-priority sector assets, shaping the role of UCBs in retail housing credit distribution.
Value Chain Analysis
The value chain starts with borrower sourcing and product distribution, mainly through bank branches and HFC field networks, supported by third-party agents and specialized subsidiaries (for example, LICHFL Financial Services). Large lenders lean on account-led acquisition to reduce friction and support cross-sell, and HDFC Bank has disclosed mortgage distribution reach across more than 7,800 locations, with 98% of its home-loan disbursements linked to a liability account opening, connecting mortgages to deposits, payments, and relationship banking.
Origination then moves through KYC, underwriting, property valuation, legal and title checks, sanction, and disbursal, followed by servicing, collections, and recovery. Pricing and reset mechanics are tied to external benchmarks (repo-linked) alongside internal cost-of-funds measures such as MCLR, transmitting RBI policy changes into retail mortgage rates. Funding and balance-sheet management close the chain through deposits (banks), refinancing, and capital-market takeouts such as securitization and RMBS, while lenders also diversify secured retail exposure through products such as loan against property (LAP) and corporate-linked home-loan programs to broaden sourcing and manage portfolio mix.
Competitive Landscape
The India home mortgage finance market is moderately fragmented, with the top lenders controlling most of the annual disbursals and a long tail of agile specialists vying for share. Banks leverage low-cost funding, but their processing times and legacy IT stacks create service gaps that HFCs exploit through rapid digital onboarding. Bajaj Housing Finance’s USD 16 billion valuation illustrates investor confidence in mono-line mortgage platforms that prioritize speed and customer experience.
Technology adoption is the decisive differentiator. Early users of the Unified Lending Interface report cost-to-income ratio reductions of 200 basis points and sanction-cycle compression to 72 hours, positioning them for aggressive growth. AI-driven scoring engines help lenders penetrate thin-file segments without compromising portfolio quality. Fintech-bank co-lending partnerships pool strengths: low-cost liquidity meets granular origination, broadening risk distribution, and lowering customer rates.
Strategic M&A adds momentum. February 2025 saw Aquilo House Pte. Ltd.’s 52.68% stake acquisition in Aavas Financiers, injecting foreign capital and best-practice governance into the affordable-housing niche. HUDCO’s INR 1 trillion memorandum with Rajasthan expands public-sector reach into urban infrastructure, potentially feeding mortgage demand. HDFC Bank’s periodic loan securitization exemplifies balance-sheet optimization in response to tighter capital norms. Collectively, these moves reinforce a competitive yet opportunity-rich environment where nimble players can scale quickly, keeping the India home mortgage finance market vibrant.
India Home Mortgage Finance Industry Leaders
-
HDFC Bank
-
State Bank of India
-
LIC Housing Finance
-
ICICI Bank
-
PNB Housing Finance
- *Disclaimer: Major Players sorted in no particular order
Market Opportunities and Future Outlook
A key opportunity sits in expanding capital-market funding and risk-transfer tools within mainstream housing finance. The May 2025 debut of residential mortgage-backed securities (RMBS) created an additional investor channel for mortgage pools, and the RBI follow-through on disclosure-led frameworks supports broader participation by institutional investors and smaller originators looking to recycle capital faster. That development ties back to competitive pricing headroom for housing finance companies and co-lending partnerships, especially for purchase mortgages that held a 70.68% share of loan purpose in 2025.
Process and cost compression is another near-term focus as lenders shift toward straight-through and API-led workflows. The RBI-led Unified Lending Interface and open-banking rails reduce approval cycle times, while LIC Housing Finance introducing machine-enabled credit appraisal and automated underwriting points to operational upgrades that improve turnaround times in contested urban and tier-2/3 catchments. Product expansion around secured cash-flow needs, particularly loan against property (LAP), also opens room for lenders to address MSME and self-employed demand while staying inside secured-credit risk appetites amid tighter scrutiny on unsecured retail credit.
Recent Industry Developments
- July 2026: State Bank of India acquires 10% stake in Residential Developer Company Limited to support residential mortgage-backed securitisation. The move supports the RMBS securitisation channel. Strengthens liquidity access and securitisation pipeline for mortgage lenders.
- July 2026: State Bank of India disbursed Rs 2.59 lakh crore in home and home-related loans in FY 2025-26, with outstanding home loan portfolio of Rs 9.44 lakh crore. The achievement demonstrates scale and deployment capacity in home loans. It also signals funding strength and competitive positioning in the mortgage market.
- May 2026: HDFC Bank invested Rs 300 crore to fund ultra luxury residential project in Kokapet, Hyderabad. This indicates premium housing financing activity. It signals liquidity allocation to high end housing developments.
Research Methodology Framework and Report Scope
Market Definition and Coverage
This market is defined as the value of outstanding home mortgage finance in India, covering housing credit extended to individuals for home purchase, home construction, and home improvement, and tracked across regulated lending channels in USD terms.
Scope exclusions: We exclude non-housing secured lending such as loans against property used for business purposes, builder wholesale funding, and informal lending outside regulated financial institutions.
Segmentation Overview
- By Loan Purpose
- Purchase (New/Existing)
- Home Improvement/Renovation
- Loan Against Property
- Others (Construction, Refinance, etc.)
- By Provider
- Banks
- Housing Finance Companies
- Others
- By Interest Rates
- Fixed Interest Rates
- Floating Interest Rates
- By Loan Tenure
- ≤ 10 Years
- 11 – 20 Years
- More than 20 Years
Data Sources, Market Sizing, and Validation
Desk Research
Desk research starts with mapping the official definition of housing credit and aligning it to the lending products that are consistently reported over time. We rely on public releases and statistical tables from sources such as the Reserve Bank of India, National Housing Bank, the Ministry of Housing and Urban Affairs, and the Ministry of Statistics and Programme Implementation, which help us anchor macro housing activity and credit trends.
To connect credit growth with housing demand, we also review data points such as CPI and interest rate series, housing supply indicators (for example, building permits and housing launches where available), and government scheme disclosures such as PMAY-related progress updates. Alongside these, we cross-check lender disclosures from annual reports, investor presentations, and audited financial statements, and we use a paid subscription source for company financials and intelligence to standardize reporting periods and product labels across lenders. The desk sources listed here are illustrative, and many other public datasets and documents were also used for data collection, validation, and research clarification.
Primary Interviews and Surveys
Primary work was used to test the model inputs that are hard to read directly from published tables, especially product mix shifts, underwriting and ticket size trends, and how lenders classify home purchase versus construction and improvement in their disclosures. We spoke with a mix of banks, housing finance institutions, and ecosystem participants across India so that assumptions on rate transmission, disbursement seasonality, and portfolio run-off behavior could be validated before finalizing the sizing.
Distribution of primary research fieldwork respondents
| Company type | Respondent position |
|---|---|
| Top tier: 32% | CXOs: 16% |
| Mid tier: 50% | Functional/Unit leaders: 30% |
| Smaller Players: 18% | Managers: 54% |
Market-Sizing & Forecasting
Market sizing is built using a top-down reconstruction of India housing credit, where official system-wide housing loan outstanding and growth rates are translated into a consistent USD value series and then reconciled to lending-channel mixes. Once the total pool is formed, it is split using observed and validated patterns such as home loan disbursement growth, average ticket size movement, share of floating versus fixed rate origination, loan tenure distribution, and the changing contribution of banks versus housing finance institutions.
Selective bottom-up checks are then used to make sure the totals do not drift away from what lenders are actually reporting. In practice, this means rolling up a tracked sample of lender mortgage portfolios, checking product split disclosures, and stress-testing implied averages against broad affordability signals such as policy rate direction and housing price inflation. Where granular splits are not consistently disclosed, we fill gaps using stable ratio assumptions confirmed through interviews, and those assumptions are revisited when reporting definitions or regulatory guidance changes.
For forecasting, scenario analysis is used because mortgage growth in India depends on a few connected drivers that can move quickly. The forward path is built around expected interest rate direction, income growth expectations, housing supply pipeline, credit penetration trends, and policy support for affordable housing, which are then reviewed with market participants to keep the forecast realistic rather than overly aggressive.
Data Validation & Update Cycle
Validation is done through a set of checks that compare the model outputs with independent signals such as system credit growth, reported lender mortgage portfolio growth, and directional movements in disbursements and delinquency commentary. When unusual jumps appear, the underlying assumptions are re-checked and, where needed, follow-up calls are triggered to confirm whether a definition change, a base effect, or a genuine demand shift is driving the variance.
Before sign-off, the dataset and calculations go through multi-step internal reviews so arithmetic, currency conversions, and time-period alignment issues are caught early. Reports are refreshed annually, and interim updates are added when material events occur, such as sharp rate moves or major policy changes. Right before delivery, a final analyst pass is completed so clients receive the most current view supported by the latest available disclosures.
Mordor Intelligence's India Home Mortgage Finance Market Size Compared Against Other Published Estimates
Published market sizes for India home mortgage finance can differ even when they appear to describe the same space, because the underlying measurement choices are not always aligned. The biggest differences usually come from what is counted as housing finance, whether the number reflects outstanding portfolios or annual disbursements, and how INR values are converted into USD for a specific year.
The main gap comes from including broader mortgage-like products, where Mordor Intelligence counts only housing-purpose home mortgage finance (purchase, construction, and improvement) and keeps the value anchored to outstanding portfolios rather than mixing in loans against property or wholesale developer funding. Beyond scope, we also see differences when some publishers project using a single headline growth rate without checking rate transmission, tenure mix changes, and lender mix shifts, and then the market number can drift away from what system credit tables and lender portfolios imply.
Benchmark comparison
| Source | Market Size | Gaps in Research Methodology |
|---|---|---|
| Mordor Intelligence | USD 480.00 B (2025) | |
| Industry Research Firm A | USD 329.88 B (2024) | Uses a housing loan market framing that can be closer to annual market activity or a narrower lender set, and the year choice plus INR to USD conversion timing can compress the stated value versus an outstanding-portfolio view. |
| Sector Research House B | USD 360.00 B (2024) | Often presented as a broad housing finance number with limited transparency on whether LAP and other mortgage finance components are excluded, and whether the figure represents outstanding credit or new lending flows, which changes comparability. |
The table shows that most of the spread is explained by scope and measurement, not by small differences in growth assumptions. By keeping the sizing tied to clear product inclusion rules, consistent year selection, and repeatable conversion and cross-check steps, we end up with a value that decision-makers can trace back to observable credit and lender signals.
Key Questions Answered in the Report
What is the current size of the India home mortgage finance market?
The India home mortgage finance market is valued at USD 0.54 trillion in 2026 and is projected to rise to USD 0.97 trillion by 2031.
Which loan purpose category dominates the market?
Purchase mortgages dominate, holding a 70.68% share of the India home mortgage finance market in 2025.
How fast is the loan against property segment expanding?
Loan against property is the fastest-growing segment, advancing at a 15.02% CAGR through 2031.
Why are floating-rate mortgages preferred by most borrowers?
Borrowers favor floating rates because the 5.5% repo rate and recent policy cuts pass through quickly, lowering EMIs when rates decline.
Which geographies are leading growth?
Tier-2 and tier-3 cities lead current expansion, accounting for 44% of new land deals and up to 65% annual price appreciation.
Is the market fragmented or consolidated?
With the top five lenders controlling a significant share of the market, the India home mortgage finance market is considered moderately fragmented, allowing new entrants to scale rapidly through technology and niche focus.