
Market Overview
| Study Period | 2021 - 2031 |
|---|---|
| Forecast Data Period | 2026 - 2031 |
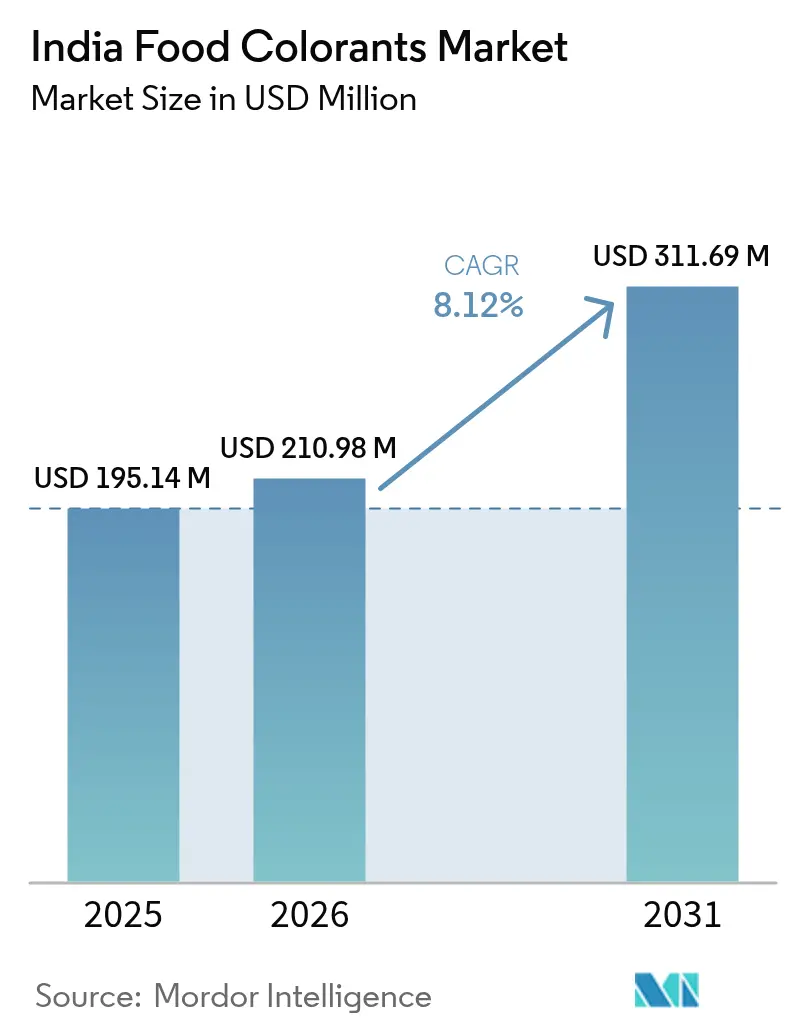
| Base Year Market Size (2025) | USD 195.14 Million |
| Market Size (2026) | USD 210.98 Million |
| Market Size (2031) | USD 311.69 Million |
| Growth Rate (2026 - 2031) | 8.12 % |
| Market Concentration | Medium |
Major Players *Disclaimer: Major Players sorted in no particular order Image © Mordor Intelligence. Reuse requires attribution under CC BY 4.0. | |
India Food Colorants Market Analysis by Mordor Intelligence
The India food colorants market size is expected to grow from USD 195.14 million in 2025 to USD 210.98 million in 2026 and is forecast to reach USD 311.69 million by 2031 at 8.12% CAGR over 2026-2031. Demand is surging, driven by a robust expansion in processed foods, tightening clean-label regulations, and ongoing innovations in dairy, confectionery, and plant-based formats. While major brands in beverages, snacks, and baked goods lean on cost-effective synthetic dyes, a notable shift towards botanical solutions is evident, especially under the watchful eye of the Food Safety and Standards Authority of India (FSSAI). The revenue pool is broadening, fueled by rising raw material integration in southern turmeric and paprika belts, venture funding for plant-based analogues, and advancements in micro-encapsulation technology. Infrastructure initiatives, notably Karnataka’s Industrial Policy 2025-30, coupled with a growing export momentum in ready-to-eat (RTE) meals, bolster India's food colorants market. This ensures a balance between maintaining cost-competitive manufacturing and scaling up premium natural offerings. However, challenges loom: volatile spice harvests and stringent metal-limit testing introduce supply-chain risks, manageable primarily by vertically integrated or well-capitalized players.
Key Report Takeaways
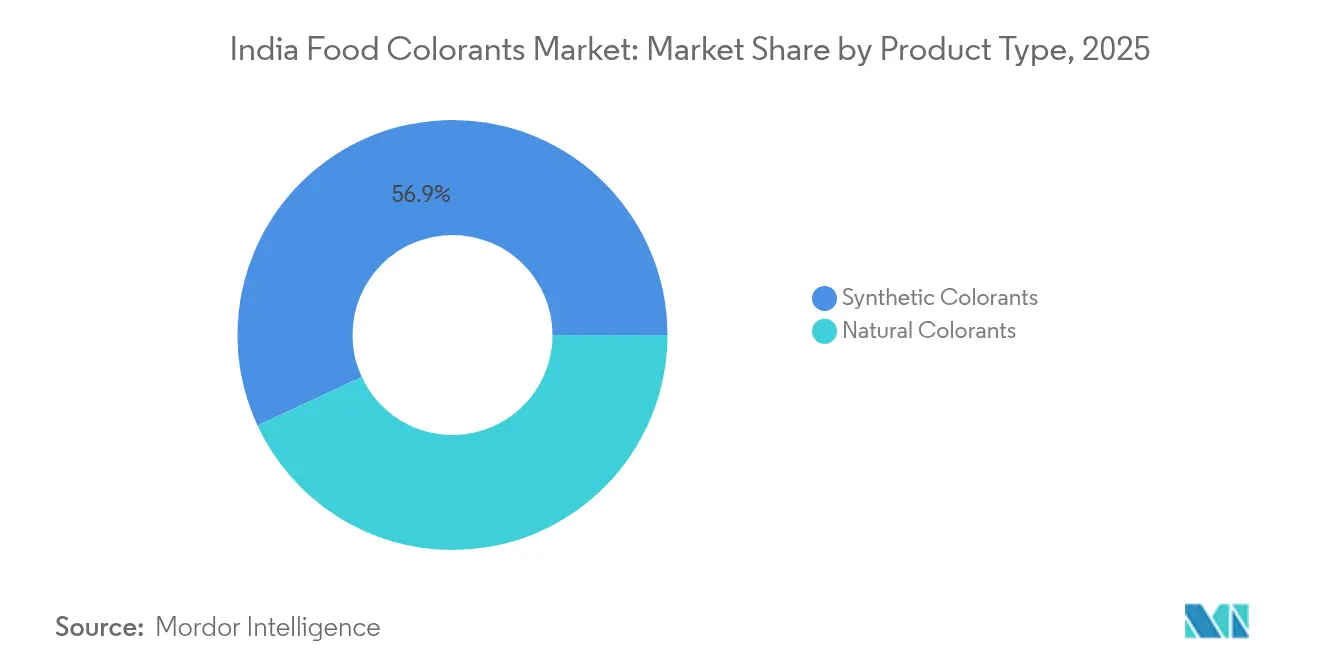
- By product type, synthetic colorants commanded a 56.92% share of the Indian food colorants market in 2025, whereas natural variants are expected to expand at a 10.86% CAGR through 2031.
- By color type, red pigments accounted for 29.88% of the Indian food colorants market size in 2025, while blue pigments are projected to advance at a 9.08% CAGR over the same horizon.
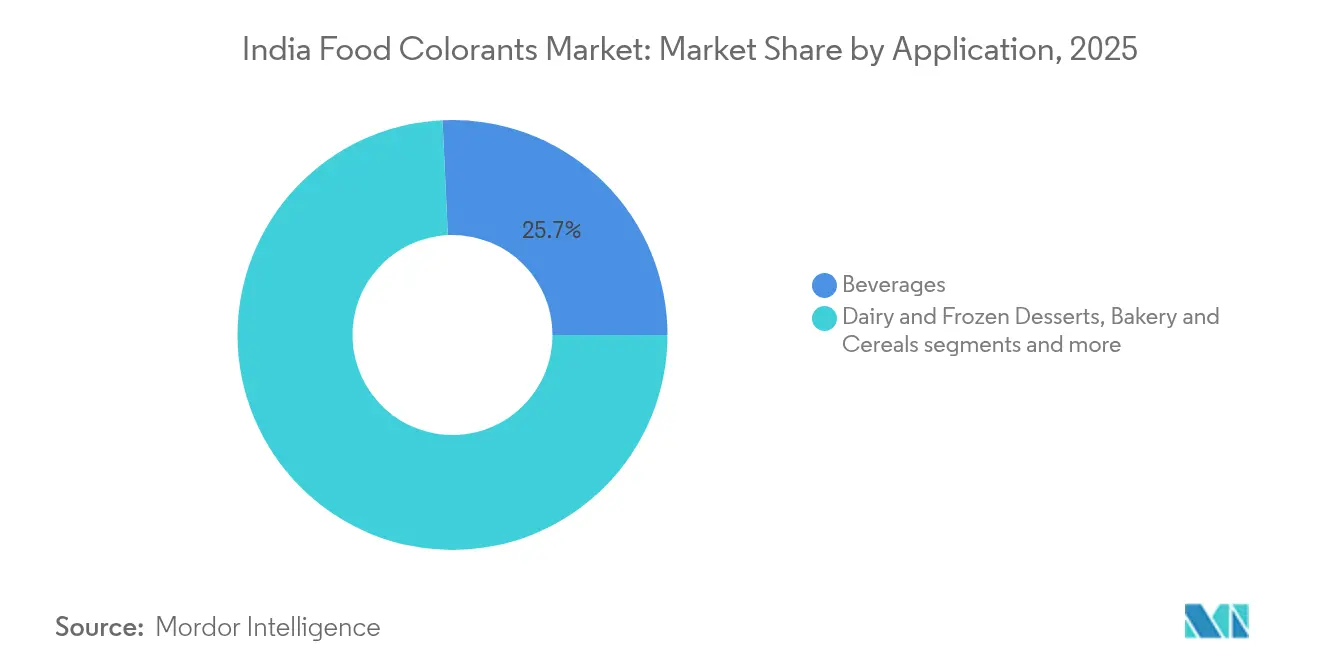
- By application, dairy and frozen desserts are projected to account for a 14.40% CAGR through 2031, overtaking beverages, which led with 25.74% revenue in 2025.
- By geography, North India accounted for 35.21% of the revenue in 2025; however, South India is on track for an 10.90% CAGR through 2031, driven by new food-processing incentives.
Note: Market size and forecast figures in this report are generated using Mordor Intelligence’s proprietary estimation framework, updated with the latest available data and insights as of 2026.
India Food Colorants Market Trends and Insights
Drivers Impact Analysis*
| DRIVER | (~) % IMPACT ON CAGR FORECAST | GEOGRAPHIC RELEVANCE | IMPACT TIMELINE |
|---|---|---|---|
| Clean-label demand propelling natural color adoption | +2.1% | Metro clusters and export-oriented units | Medium term (2-4 years) |
| Expansion of India’s processed food and beverage base | +1.8% | National, with southern and northern processing hubs | Long term (≥4 years) |
| Regulatory nods for novel botanicals | +0.8% | National, spillover to export markets | Short term (≤2 years) |
| Domestic backward-integration in spice pigments | +1.0% | Southern turmeric and paprika belts | Medium term (2-4 years) |
| Color solutions for plant-based meat analogues | +0.6% | Urban metros and export channels | Medium term (2-4 years) |
| Rising demand for functional and health-focused beverages driving adoption of natural food colorants | +1.2% | Metro cities and export-oriented units | Medium term (2-4 years) |
| Source: Mordor Intelligence | |||
Clean-label demand propelling natural color adoption
Indian shoppers are increasingly rejecting synthetic E-numbers in mithai, confectionery, and dairy products. A 2024 peer-reviewed survey found widespread overuse of Tartrazine and Brilliant Blue in namkeens, prompting urgent reformulations that swap chemical dyes for botanical extracts[1]. Since 2018, Nestlé India has launched over 70 products, now contributing to more than 6% of the company's turnover. This underscores the commercial significance of cleaner formulations, which are resilient to freeze-thaw cycles and feature reduced sugar content. Premium mithai artisans are now infusing petals, berries, and vegetable concentrates, along with edible metals, to craft vibrant treats that are ready for social media. As India's food processing sector flourishes, there's a noticeable shift from synthetic to natural colorants, driven by a growing demand for clean-label products. Urban millennials and Gen Z, with their wellness focus and label scrutiny, play a pivotal role in this trend, bolstered by increasing disposable incomes and the rise of e-commerce. Consequently, the natural segment has transitioned from a niche preference to a mainstream choice across snacks, beverages, and dairy products.
Expansion of India’s processed food and beverage manufacturing base
Urban incomes are rising, and online grocery platforms are booming, leading to a surge in demand for packaged foods. The states of Andhra Pradesh, Tamil Nadu, and Telangana are home to most registered processing units, meeting the consistent pigment demands of snacks, ready-to-eat curries, and seafood. In a move signaling regulatory backing for the expansion of India's food colorants market, Karnataka has introduced policies offering grants for cold storage and offsets for green energy. The Indian market's appetite for food colorants is further fueled by the rise of mega plants and high-speed production lines. Take, for instance, Varun Beverages' new lines in Uttar Pradesh and Madhya Pradesh, operating at speeds of 600–1,200 bpm. These lines, demanding highly stable colors like caramel Class IV and encapsulated carotenoids, underscore the growing need for colorants. Consequently, manufacturers adept at providing heat-stable, cost-efficient natural colors and potent synthetic lakes stand poised to dominate this burgeoning market.
Regulatory nods for novel botanicals
FSSAI is updating Bureau of Indian Standards (BIS) monographs for annatto, caramel, and titanium dioxide to align with Codex methods. The regulator still permits only eight synthetic dyes but has expanded its botanical list to include turmeric, annatto, saffron, beetroot, paprika, and cochineal, with Lakadong turmeric and Kashmir saffron enjoying protected geographical-indicator (GI) status[2]. Crackdowns on banned substances like Rhodamine B and metanil yellow are benefiting certified suppliers. Oterra's Kochi hub, which began operations in February 2025 and boasts ISO 22000 and HACCP certifications, highlights the trend of multinationals aligning Indian operations with import regulations of the European Union and the United States. The FSSAI's approval process for new botanicals is thorough, demanding safety assessments that encompass toxicological data, documentation of traditional uses (drawing from India's rich Ayurvedic heritage), and reviews of scientific literature by panels of experts. Furthermore, products featuring novel ingredients or lacking established standards must secure prior approval through the FoSCoS portal, which includes mandatory lab testing and validation of health claims.
Domestic backward-integration in spice-derived pigments
Kerala, Tamil Nadu, Karnataka, and Maharashtra have established vertically integrated spice chains, reducing their dependence on imports. Amid a decline in turmeric production that halved inventories, ITC has turned to contract farming in Madhya Pradesh, ensuring the purity of curcumin. Paprika oleoresin, now offered in both water-soluble and oil-soluble formats, benefits from local drying and extraction clusters, which not only shorten lead times but also guarantee traceability. Roha Dyechem's introduction of the micronized ChromaFine and the clean-label Futurals ranges in 2024 highlights how Indian companies, capitalizing on their proximity to spices, achieve shade consistency at competitive global prices. New plants in India are harnessing proprietary technologies in encapsulation, emulsification, and microencapsulation. Backward integration has birthed turmeric clusters in Erode-Salem, chilli clusters in Guntur-Byadgi, and annatto clusters in Assam. This domestic backward integration in spice-derived pigments stands as a dominant growth driver for India's food colorants market, slashing costs, bolstering supply reliability, enhancing technical performance, and transforming India from a mere raw-material source to a global processing powerhouse.
Restraints Impact Analysis*
| RESTRAINT | (~) % IMPACT ON CAGR FORECAST | GEOGRAPHIC RELEVANCE | IMPACT TIMELINE |
|---|---|---|---|
| Volatile crop-based raw-material supply | -1.2% | National, acute in turmeric and paprika belts | Short term (≤2 years) |
| Stringent FSSAI limits on synthetic dyes | -0.7% | Nationwide, with export compliance overlap | Medium term (2-4 years) |
| Cost premium of natural versus synthetic | -0.9% | Most acute for micro- and small processors | Long term (≥4 years) |
| Micro-encapsulation lowering dosage needs | -0.5% | Research and development intensive urban processors | Long term (≥4 years) |
| Source: Mordor Intelligence | |||
Volatile crop-based raw-material supply
Every time a major crop fails or an export ban is imposed, raw material prices surge. FMCG companies dread budgeting uncertainties even more than they do high prices. Following each market shock, a significant number of buyers make a permanent shift from synthetic dyes to natural colors. Importers bear the brunt of these price shocks, facing harsher penalties than domestic processors who have secured contracts with farmers. Paprika yields, too, face unpredictability due to erratic rainfall patterns in Karnataka. To navigate these challenges, smaller pigment houses either maintain a larger safety inventory or enter into long-term contracts with growers, both of which put a strain on their working capital. While global suppliers have diversified their sources, mixing domestic and imported batches to counter shade variations, they still face limitations. Escalation clauses linked to GI-tagged turmeric and Kashmir saffron restrict the extent to which inflated costs can be passed on in the Indian food colorants market.
Stringent FSSAI limits on synthetic dyes
The eight-dye cap requires continuous heavy-metal testing and compels confectioners to maintain dual inventories when exporting to the European Union or the United States. Karnataka’s Industrial Policy removes incentives for azo dye plants to reduce their environmental load, indirectly increasing demand for natural pigments. Certification fees, new spray-dry towers, and validation for viscosity compatibility can delay product launches for resource-constrained firms, even though FSSAI subsidies partially cover half of assay expenses for micro and small units. Over the years, the FSSAI has introduced a maximum combined limit of 100 ppm (previously 300 ppm) for any two permitted synthetic colors in snacks, confectionery, and beverages. It further introduced a ban on Titanium Dioxide (E171) as a whitening agent in 2023. FSSAI’s increasingly stringent limits and bans on synthetic dyes have acted as a clear and measurable brake on the overall India food colorants market. While these regulations are the primary reason natural colors are booming, they simultaneously impose a hard ceiling on the size of the total food colorants pie, hampering the growth in the Indian market.
*Our forecasts treat driver/restraint impacts as directional, not additive. The impact forecasts reflect baseline growth, mix effects, and variable interactions.
Segment Analysis
By Product Type: Natural Variants Gain Despite Synthetic Dominance
Synthetic dyes still account for 56.92% of India's food colorants market revenue, thanks to their low cost and uniform coloring strength. Tartrazine, Sunset Yellow, Allura Red, and Brilliant Blue FCF remain ubiquitous in beverages, candies, and baked goods. The natural segment, however, is forecast to advance at a 10.86% CAGR, reflecting stringent export rules and premiumization among metro consumers. Oterra’s Kochi expansion demonstrates that indigenous spice chains can now scale color-value-optimized extracts competitively. Micro-encapsulated curcumin and carotenoids, sold under ChromaFine and Natracol lines, deliver stability in acidic drinks and transparent gummies without oversupply risk, though dosage reduction can trim absolute tonnage growth. Price-sensitive namkeens and low-priced candies are expected to sustain core synthetic volumes, ensuring balanced coexistence across the India food colorants market.
Synthetic colors primarily due to their low cost, high tint strength, and wide shade range, which suit price-sensitive mass packaged foods and traditional confectionery. FSSAI permits several synthetic colors (e.g., tartrazine, sunset yellow, quinoline yellow, indigo carmine, amaranth), so manufacturers still have clear regulatory pathways to use these in many product categories. However, rising health awareness and concern about the potential adverse effects of synthetic dyes (e.g., hyperactivity concerns, allergy risks) are central to the shift toward botanical and fermentation-derived pigments. Parallel growth in India’s organic and “better-for-you” segments, which saw strong post‑COVID momentum, reinforces consumer expectations that color, flavor, and preservative systems should also be “natural” or minimally processed.

By Color Type: Red Leads, Blue Surges on Functional Beverage Trends
Red pigments accounted for 29.88% of 2025 sales, with paprika oleoresin used across savory snacks and beetroot extract used in dairy and confectionery. Cochineal remains restricted to gourmet lines due to its insect origins. The blue category is projected to achieve a 9.08% CAGR, driven by the inclusion of spirulina-based phycocyanin in plant-based milks and electrolyte drinks, which claim antioxidant benefits. Butterfly-pea anthocyanin, which shifts from blue to purple under acidic conditions, is trending in mixology. Turmeric-derived yellow continues to face raw material swings, yet GI-linked Lakadong supplies command premiums due to their high curcumin content. Chlorophyll and annatto fill niche butter and cheese applications, while black and purple anthocyanins satisfy the needs of gourmet bakers. Ongoing BIS updates aim to standardize annatto quality, thereby reducing rejection rates in export consignments.
Natural red is showing structural growth faster than brands in juices, confectionery, dairy, sauces, and processed meat analogues, as they pivot to insect-derived carmine and plant-based reds to support clean-label and “no artificial colour” claims. Growth in blue is closely tied to social-media-driven aesthetics (e.g., bright blue beverages, desserts, and “unicorn/galaxy” themes) and to the clean-label push that favors natural blue over synthetic dyes associated with health concerns. Asia–Pacific, including India, is expected to post the highest growth in natural blue food colors globally, driven by rapid urbanization, rising disposable incomes, and stronger awareness of natural ingredients.
By Application: Dairy Surges, Beverages Hold Largest Share
Beverages retained 25.74% revenue share in 2025, spanning carbonated drinks, juices, and ready-to-drink teas that demand acid and light stability. Synthetic dyes dominate here due to their cost competitiveness, although premium juices and sports-nutrition blends are shifting toward anthocyanins and carotenoids. Dairy and frozen desserts are forecasted to have the fastest growth, with a 14.40% CAGR, which supports the launch of ice cream, yogurt, and flavored milk. Annatto improves butter shade consistency, curcumin colors turmeric lattes, and beetroot offers a natural strawberry hue, with encapsulation technologies ensuring thaw-cycle stability. Confectionery, bakery, and snack makers collectively generate roughly one-third of pigment demand, leaning heavily on visually distinctive fillings, drizzles, and seasonings to differentiate regional tastes. Plant-based protein brands are also intensifying their sourcing of heme-mimicking beet derivatives to meet export palate expectations.
Natural food colors are gaining market share in beverages due to clean-label positioning, with turmeric/curcumin, beetroot, anthocyanins, spirulina, and other plant sources replacing or reducing synthetic dyes in juices, flavored waters, RTD teas, and better-for-you carbonates. Asia‑Pacific data indicate that natural colors see particularly strong pull in beverages and confectionery, and India is part of this trend as health‑conscious, urban consumers seek products “free from artificial colors. Dairy and frozen products are highlighted as a rapidly growing user segment for food colors in India, especially in South India where natural colors already have stronger traction. Colorants are increasingly used in yogurts, ice creams, dairy desserts, cheese analogues, and especially flavored milk, where fruit and dessert variants rely on visual cues to communicate indulgence and freshness.
Geography Analysis
North India maintained its leadership with 35.21% of India's food colorants market revenue in 2025, due to the concentration of beverage giants in the Delhi-NCR region and high dairy throughput across Punjab and Haryana. Extensive cold-chain logistics and proximity to populous markets sustain large-volume synthetic consumption for mainstream SKUs.
South India is forecast to expand at the fastest rate of 10.90% CAGR through 2031, as Karnataka, Tamil Nadu, and Andhra Pradesh roll out fiscal incentives for FSSAI certification, renewable energy, and cold storage under the 2025-2030 industrial blueprint. These states also benefit from proximity to spice farms, enabling seamless backward integration for colorant producers like Oterra and Synthite, which supply dairy, snack, and seafood processors. Kerala’s EU-certified seafood plants and Oterra’s Kochi center amplify export competitiveness.
West India leverages Sangli’s turmeric and Gujarat’s robust dairy cooperatives to maintain roughly one-quarter of demand. Mumbai’s FMCG headquarters drive research and development trials in plant-based beverages, thereby widening natural pigment penetration. East India is gaining momentum as Nestlé’s Odisha facility and Meghalaya’s Lakadong turmeric achieve GI status, underpinning emerging pigment supply lines, although logistics constraints limit immediate acceleration. Collectively, these regional dynamics position the India food colorants market for balanced growth where raw-material clusters, fiscal policy, and export infrastructure converge.
Regulatory Landscape
Food colorants in India are governed by the Food Safety and Standards Act, 2006 and administered by the Food Safety and Standards Authority of India (FSSAI) through the Food Safety and Standards (Food Products Standards and Food Additives) Regulations, 2011. The framework defines permitted colors and their conditions of use, and it also drives compliance in labeling, where packaging and labelling rules require clear declaration of the color and its identification details in finished foods.
In 2026, FSSAI advanced process and reference updates that affect how colorant innovations reach market. In May 2026, FSSAI mandated use of the electronic Product and Claim Approval Application System (ePAAS) for risk assessment and approval of non-specified food ingredients, a route relevant for additives or botanical preparations needing prior authorization. Separately, draft amendments issued in February 2026 proposed updating the 2011 regulations references to align packaging and labelling linkages with the 2018 Packaging Regulations and the 2020 Labelling and Display Regulations, increasing the need for harmonized documentation across formulation dossiers and label compliance.
Competitive Landscape
The India food colorants market shows moderate concentration: the top five global suppliers, including Novonex (formerly Chr. Hansen), Sensient, GNT, DDW-Givaudan, and Döhler. Multinationals continue to invest in taste-and-color expansions for additional capacity and aiming to enhance their sales. Product innovation remains the primary strategy employed by companies to address the increasing demand for clean-label, plant-based color solutions. Major players are introducing advanced natural colorant formulations to enhance their product portfolios and align with consumer preferences for healthier ingredients.
Domestic leaders stand out through backward integration. Synthite procures paprika and turmeric directly from grower groups, while Roha Dyechem deploys spray-dry and microparticulation lines in Maharashtra to launch ChromaFine micronized pigments fit for acidic beverages. Kancor, Akay, and Universal Oleoresins leverage Kerala’s spice ecosystem to supply both domestic FMCG and export buyers under ISO 22000, BRC, and FSSC 22000 schemes.
Strategic fencing around specialty niches is rising. Sudarshan Chemical’s INR 1,180 crore acquisition of Heubach pigments extends an industrial dye portfolio that may enable food-grade lake color crossovers. Meanwhile, modular startups such as Blue Tribe and Wakao Foods, source bespoke beet and iron complex blends for plant-based meats, too small for global suppliers yet profitable for agile regional pigment houses. Technology differentials, such as controlled-release microcapsules and pH-responsive anthocyanins, increasingly dictate competitive edge rather than scale alone.
India Food Colorants Industry Leaders
-
Novozymes A/S
-
Sensient Technologies Corp.
-
Döhler Group
-
ADM (Wild Flavors & Colors)
-
BASF SE
- *Disclaimer: Major Players sorted in no particular order

Market Opportunities and Future Outlook
A primary opportunity lies in reformulation support and compliance-led innovation as FSSAI tightens oversight of additives and claim substantiation while keeping the core additive framework anchored in the 2011 regulations. The May 2026 shift to the ePAAS system creates whitespace for suppliers that can package stronger safety dossiers and application data for botanical and specialty color systems, especially where customers want clean-label positioning but still need stability in acidic beverages, dairy matrices, and confectionery coatings.
The build-out of domestic blending, application labs, and backward-integrated sourcing reduces variability from spice-derived inputs while shortening development cycles for processors. This is visible in multinational and domestic capability investments, such as Oterra operating a blending and application center in Kochi (opened February 2025) to supply turmeric, paprika, annatto, and red beet shades for India and nearby export corridors. Suppliers that pair local raw-material linkages with technical services (shade matching, stability testing, and documentation aligned to FSSAI packaging and labelling requirements) have a clearer route to win mid-tier processors upgrading portfolios across dairy, confectionery, beverages, and regional savory products.
Recent Industry Developments
- May 2026: FSSAI mandated use of the electronic Product and Claim Approval Application System (ePAAS) for risk assessment and approval of non-specified food ingredients. This strengthens the documentation and testing pathway for novel or non-standardized colorant preparations and raises the value of suppliers with in-house regulatory and application support for faster submissions.
- March 2025: Oterra inaugurated a blending and application center in Kochi, Kerala, focused on natural shades made from turmeric, paprika, annatto, and red beet. The facility adds local formulation and troubleshooting capacity for Indian processors, supporting cleaner-label transitions without relying solely on imported finished blends.
- September 2024: GNT Group showcased its Exberry plant-based colors at Fi India 2024, signaling a shift toward fruit and vegetable derived color systems in the Indian market. The emphasis on natural color options increased competitive pressure on synthetic color providers in premium beverages, dairy, and confectionery as brands pursue no artificial color positioning.
Research Methodology Framework and Report Scope
Market Definition and Coverage
For this study, the market is defined as the value of food-grade colorants sold for use in foods and beverages within India, counted at the point of sale from colorant suppliers to food manufacturers and similar buyers.
Scope exclusions: This sizing does not include colors meant only for pharmaceuticals, cosmetics, or industrial uses, and it also excludes non-food dyes sold for textiles and inks.
Segmentation Overview
- By Product Type
- Natural Colorants
- Anthocyanins
- Carotenoids (includes Beta-Carotenes)
- Curcumin
- Carmine
- Spirulina
- Other Types
- Synthetic Colorants
- Natural Colorants
- By Color Type
- Blue
- Green
- Red
- Yellow
- Others
- By Application
- Beverages
- Dairy and Frozen Desserts
- Bakery and Cereals
- Confectionery
- Meat, Poultry and Seafood
- Sauces, Dressings and Condiments
- Snacks and RTE Meals
- Other Applications
- By Geography
- North India
- West India
- South India
- East India
Data Sources, Market Sizing, and Validation
Desk Research
Desk research was used to set the base structure of the model and to avoid building assumptions in isolation. We reviewed public Indian and global references such as FSSAI regulations and additive standards, the Ministry of Food Processing Industries releases, APEDA trade updates for processed foods, DGCIS or related customs statistics for relevant preparations, and peer-reviewed food science journals that discuss permitted colorants and typical usage rates.
Company annual reports, investor presentations, and product catalogs helped us map how suppliers position natural versus synthetic options across key food applications. Where needed, we also used paid subscriptions for company financials and intelligence, plus shipment-level import and export datasets to sanity-check supply availability and the direction of pricing. The sources mentioned here are illustrative only, and many other public and paid references were also used for data collection, validation, and clarification.
Primary Interviews and Surveys
Primary work was used to close gaps that public sources leave behind, especially on real buying behavior and how formulation shifts change demand. We spoke with respondents across ingredient suppliers, food and beverage manufacturers, and distribution partners. Input was also checked across India regions, so the model did not tilt toward one cluster of demand.
Distribution of primary research fieldwork respondents
| Company type | Respondent position |
|---|---|
| Top tier: 32% | CXOs: 15% |
| Mid tier: 48% | Functional/Unit leaders: 34% |
| Smaller Players: 20% | Managers: 51% |
Market-Sizing & Forecasting
Sizing was built using a top-down approach where packaged food and beverage output, trade movement of relevant food categories, and typical colorant inclusion rates were used to reconstruct the demand pool for food-grade colors in India. The totals were then corroborated using selective bottom-up approximations such as sampled supplier revenue splits, application-level channel checks, and a price per kilogram plus estimated volume method for common color types. This step helped adjust for under-reporting and double counting.
Inputs that mattered in this market included the pace of processed food expansion, application mix shifts such as beverage and dairy growth, the natural versus synthetic conversion rate linked to labeling preferences, indicative dosage ranges by application, and average selling price movement driven by raw material availability and imports. For forecasting, we used scenario analysis supported by a simple multivariate regression view, where demand growth was tied to processed food output and the expected reformulation cycle, and then reviewed with experts to keep assumptions realistic. Where bottom-up signals were missing for smaller applications, gaps were handled by applying conservative usage-rate bands and then re-checking the combined total against broader demand indicators.
Data Validation & Update Cycle
Model outputs were validated through triangulation across independent signals, including supplier commentary, trade direction, and end-use demand momentum. We then tested for unusual jumps across years or across applications. If a variance looked too high, we rechecked unit assumptions, price steps, and conversion factors, and in some cases respondents were re-contacted to confirm whether a change was structural or temporary.
Before sign-off, the work goes through multi-step analyst review so the calculation logic, data consistency, and market scope alignment are verified. Reports are refreshed annually, and interim updates are done when material events occur, such as a regulatory change or a sharp input-cost swing. Right before delivery, a final pass is completed so clients receive the most up-to-date view available at that time.
Mordor Intelligence's India Food Colorants Market Market Sizing Compared With Other Published Estimates
Published numbers for India food colorants do not always match because the market can be defined in different ways, and the same end-use demand can be converted into value using different price and usage assumptions. Differences also show up when the base year is not aligned, or when the forecast window includes a faster or slower reformulation cycle than what buyers are following.
A key gap driver is scope. Some estimates fold in adjacent categories like caramel colors and lake colors, and they may also rely on broader ingredient baskets under color-related headings. Some figures also apply a single blended price progression across all color types, which can overstate value when mix shifts toward lower-cost synthetics in mass products, or understate it when naturals gain share in premium lines.
Benchmark comparison
| Source | Market Size | Gaps in Research Methodology |
|---|---|---|
| Mordor Intelligence | USD 195.14 M (2025) | |
| Industry Publisher A | USD 387.60 M (2026) | Uses a later base year and a wider product bucket that explicitly includes lake colors and caramel, which can lift the total beyond food colorants counted strictly as color additives across all applications. |
| Industry Publisher B | USD 821.20 M (2035) | Longer forecast horizon and a higher implied growth compounding window, and the scope description indicates broader inclusion of color categories, making the end value less comparable to a food-only, application-validated sizing. |
The spread mainly comes from what is counted as a food colorant and the time horizon chosen for compounding growth. With Mordor Intelligence, caramel and lake colors are not added into the total unless they are sold and declared as food color additives for the covered applications. Pricing steps are rechecked against interview feedback during annual refreshes, so short-term spikes do not get carried forward blindly.
Key Questions Answered in the Report
How large is the India food colorants market in 2026?
The India food colorants market size stands at USD 210.98 million in 2026 and is projected to expand at an 8.12% CAGR over 2026-2031.
Which application is growing fastest for colorants in India?
Dairy and frozen desserts are forecast to record a 14.40% CAGR to 2031, outpacing beverage, bakery, and confectionery segments.
Why are natural colorants gaining share in India?
Clean-label demand, stricter FSSAI enforcement, and premiumization in mithai, dairy, and export-oriented foods are driving an 10.86% CAGR for natural pigments.
Which region will contribute most to future growth?
South India is projected to register an 10.90% CAGR, leveraging new food-processing incentives, spice-belt proximity, and export-ready infrastructure.