
India Food And Beverage Packaging Market Size and Share
Market Overview
| Study Period | 2020 - 2031 |
|---|---|
| Forecast Data Period | 2026 - 2031 |
| Base Year Market Size (2025) | USD 38.27 Billion |
| Market Size (2026) | USD 40.73 Billion |
| Market Size (2031) | USD 55.67 Billion |
| Growth Rate (2026 - 2031) | 6.44 % |
| Market Concentration | Medium |
Major Players *Disclaimer: Major Players sorted in no particular order Image © Mordor Intelligence. Reuse requires attribution under CC BY 4.0. | |
India Food And Beverage Packaging Market Analysis by Mordor Intelligence
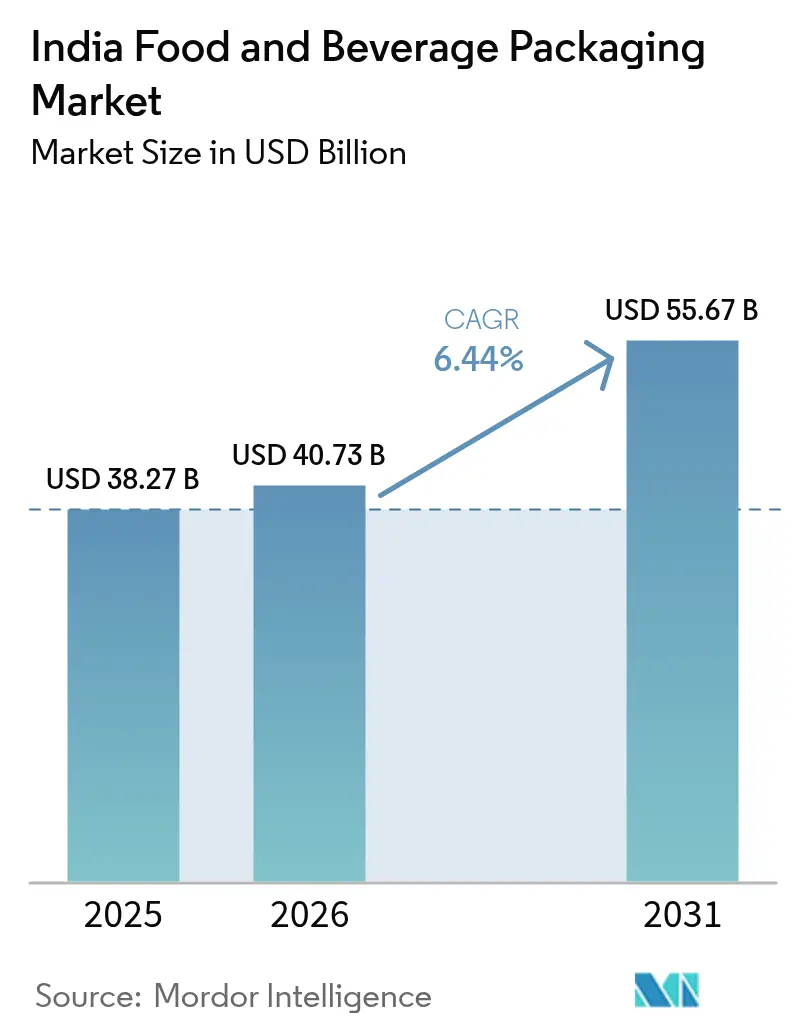
India food and beverage packaging market size in 2026 is estimated at USD 40.73 billion, growing from 2025 value of USD 38.27 billion with 2031 projections showing USD 55.67 billion, growing at 6.44% CAGR over 2026-2031. Rising processed-food penetration, mandatory recycled-content rules, and e-commerce expansion are reinforcing steady demand for packaging that stretches shelf life and meets safety norms. Government incentives such as the Production Linked Incentive Scheme, worth INR 10,900 crores, are stimulating capital investment in automated lines and cold-chain infrastructure.[1]Flexible formats still dominate volumes, yet rigid options are gaining traction because premium beverages and export-oriented ready meals need stronger protection. Input price volatility compressed converter margins to a decade-low 8% in 2024, but recyclate supply bottlenecks and capacity additions in rigid formats point to widening opportunities for vertically integrated firms.
Key Report Takeaways
- By material type, plastic captured 55.92% of the India food and beverage packaging market share in 2025.
- By product type, the India food and beverage packaging market size for metal products is projected to grow at a 6.96% CAGR between 2026-2031.
- By packaging format, flexible packaging captured 52.88% of the India food and beverage packaging market share in 2025.
- By end‐use category, the India food and beverage packaging market size for beverages is projected to grow at a 7.41% CAGR between 2026-2031.
Note: Market size and forecast figures in this report are generated using Mordor Intelligence’s proprietary estimation framework, updated with the latest available data and insights as of 2026.
Worldwide, activity is shaped by contributions from multiple countries and regions, with India representing one among them. The global report on food and beverage packaging market by Mordor Intelligence reflects how these countries and regional layers combine into a single system.
India Food And Beverage Packaging Market Trends and Insights
Drivers Impact Analysis*
| Driver | (~) Impact on CAGR Forecast | Geographic Relevance | Impact Timeline |
|---|---|---|---|
| Rising processed-food penetration | +1.2% | National, stronger in cities | Medium term (2-4 years) |
| Imports of automated Food packaging machinery | +0.8% | Maharashtra, Gujarat, Karnataka | Short term (≤2 years) |
| E-commerce and D2C demand for SKU differentiation | +0.9% | Metro and Tier-2 markets | Medium term (2-4 years) |
| Mandated 30% rPET content in bottles | +0.7% | National, early in beverages | Short term (≤2 years) |
| Cold-chain ready-meal exports | +0.6% | Tamil Nadu export clusters | Long term (≥4 years) |
| Cloud-kitchen growth and dual-ovenable trays | +0.4% | High-delivery urban zones | Medium term (2-4 years) |
| Source: Mordor Intelligence | |||
Rising Processed-Food Penetration Drives Packaging Innovation
Processed-food consumption is surging as urbanization and disposable income climb. Domestic food sales are on track to hit USD 1,274 billion by 2027, pulling advanced multilayer films and retort pouches into the spotlight. Snack producers want portion-controlled packs that keep flavor intact during last-mile delivery. Ready-to-eat meals need pouches that survive steam sterilization and preserve nutrients. Bureau of Indian Standards specifications ensure direct-contact materials comply with food-grade requirements, pushing converters to adopt certified inks and adhesives.[2]
E-commerce and D2C Brands Reshape SKU-Level Differentiation
Online retail surpassed INR 12.2 trillion in 2024, expanding 18.7% annually and fueling demand for tamper-evident, moisture-resistant, and visually striking packs. D2C labels rely on packaging to create memorable unboxing moments. Short production runs have triggered rapid uptake of digital presses that enable quick design changes without high plate costs. Brands now opt for smaller pack sizes and premium finishes that survive the logistics chain and convey sustainability credentials.
Mandated rPET Content Accelerates Sustainable Transition
The April 2025 rule requiring 30% recycled PET in beverage bottles has become a major catalyst for supply-chain redesign. Only five FSSAI-approved plants currently produce food-grade rPET, covering barely 15% of demand. Beverage companies face packaging cost hikes of around 30% and are lobbying for staging periods. Producers such as Ganesha Ecopet are boosting bottle-to-bottle capacity to 42,000 tonnes a year, while converters explore lighter-weight bottle designs that accommodate recycled resin without compromising strength.
Cold-Chain Infrastructure Expansion Enables Export Growth
Government-supported cold-chain projects, 135 in total with 97 operational, are reducing post-harvest losses and stimulating exports. Ready-meal exporters based in Tamil Nadu use retort pouches designed for extended ambient storage. Dual-ovenable paper trays paired with modified-atmosphere sealing support growing overseas demand for heat-and-eat curries. Compliance with HACCP and ISO standards is mandatory for Europe and North America, prompting investments in in-line X-ray inspection and barrier-coated papers.
Restraints Impact Analysis*
| Restraint | (~) Impact on CAGR Forecast | Geographic Relevance | Impact Timeline |
|---|---|---|---|
| SMEs’ limited access to best-practice manufacturing | -0.8% | Rural and semi-urban clusters | Long term (≥4 years) |
| Volatile polymer prices squeezing margins | -1.1% | National, severe in flexibles | Short term (≤2 years) |
| Eight-percent profitability trough in flexibles | -0.9% | Maharashtra, Gujarat hubs | Medium term (2-4 years) |
| Talent shortage in food-grade inks and coatings | -0.5% | Specialized centers | Long term (≥4 years) |
| Source: Mordor Intelligence | |||
SMEs Face Technology and Compliance Barriers
SMEs make up 85% of India’s 22,000 registered packaging firms but often lack capital for solvent-less laminators or toluene-free ink systems. Only one-fifth of converters have met the IS 15495 standard that bars toxic solvents in food packs. Limited technical training and fragmented supply chains restrict smaller factories from serving premium customers who insist on globally certified packs.
Volatile Polymer Prices Create Margin Pressures
A 45% capacity jump in BOPET films and 20% in BOPP films collided with an 11% demand rise, pushing flexible-film margins to 8% in 2024. Sharp resin swings force converters to carry high working capital or hedge, neither of which suits debt-laden SMEs. Credit profiles are under stress despite the expected 5-6% volume recovery in packaged foods. Larger firms with backward-integrated resin lines remain better shielded from price shocks.
*Our forecasts treat driver/restraint impacts as directional, not additive. The impact forecasts reflect baseline growth, mix effects, and variable interactions.
Segment Analysis
By Material Type: Paper Gains Momentum as Regulations Tighten
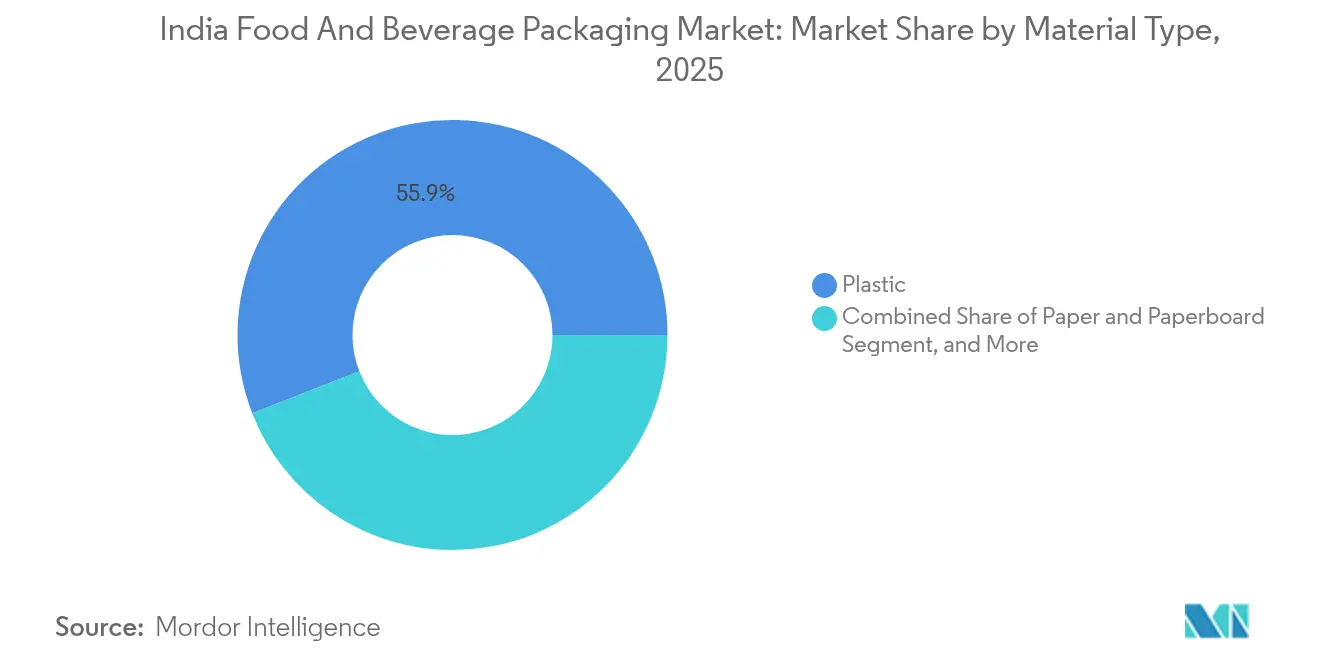
Paper and paperboard products captured 39.18% of the India food and beverage packaging market size in 2025. Plastic still holds the overall lead with 55.92% share, yet recycled-content mandates and consumer eco-preferences push kraft and barrier-coated papers forward at a 7.35% CAGR. The India food and beverage packaging market share for plastic is forecast to slip mildly as converters blend virgin with certified recyclate to meet rPET rules. FSSAI’s 2025 amendment now allows recycled PET in direct food contact once plants meet stringent tests. Barrier-paper innovators such as Koehler offer mono-material papers that pass grease and oxygen tests while easing curbside recycling.
Paper’s ascent is visible in beverage multipacks and QSR trays, yet polymer demand persists in high-humidity snacks and dairy pouches. Multilayer PE and BOPP remain cost-efficient for flavor retention. Metal cans hold a niche in premium ready drinks and export-oriented processed meats, buoyed by their unmatched light and gas barriers. Glass caters to high-value spices and condiments that target aroma conservation. Material strategies, therefore, converge on hybrid portfolios rather than outright substitution.

By Product Type: Metal Packs Accelerate under Premiumization
Paperboard cartons lead unit volumes, but metal containers are pacing fastest at a 6.96% CAGR through 2031. Craft beer, energy drinks, and nutraceutical powders favor 2-piece aluminum cans that chill rapidly and prolong shelf life. ITC’s INR 20,000 crore outlay earmarks a third for paperboards and moulded fiber, yet also supports high-stiffness laminated cartons for e-commerce shipping. Rigid plastic tubs address mass dairy, and flexible laminates dominate salty snacks. Single-use cellulose plates are rising in cloud kitchens.
Metal’s growth also draws on advances in BPA-non-intent coatings that align with global safety standards. Aerosol whipped-cream exports use internally lacquered steel to prevent flavor scalping. Consumer willingness to pay premiums for sleek matte finishes favors metal over alternative formats.
By Packaging Format: Rigid Offerings Outpace in Growth
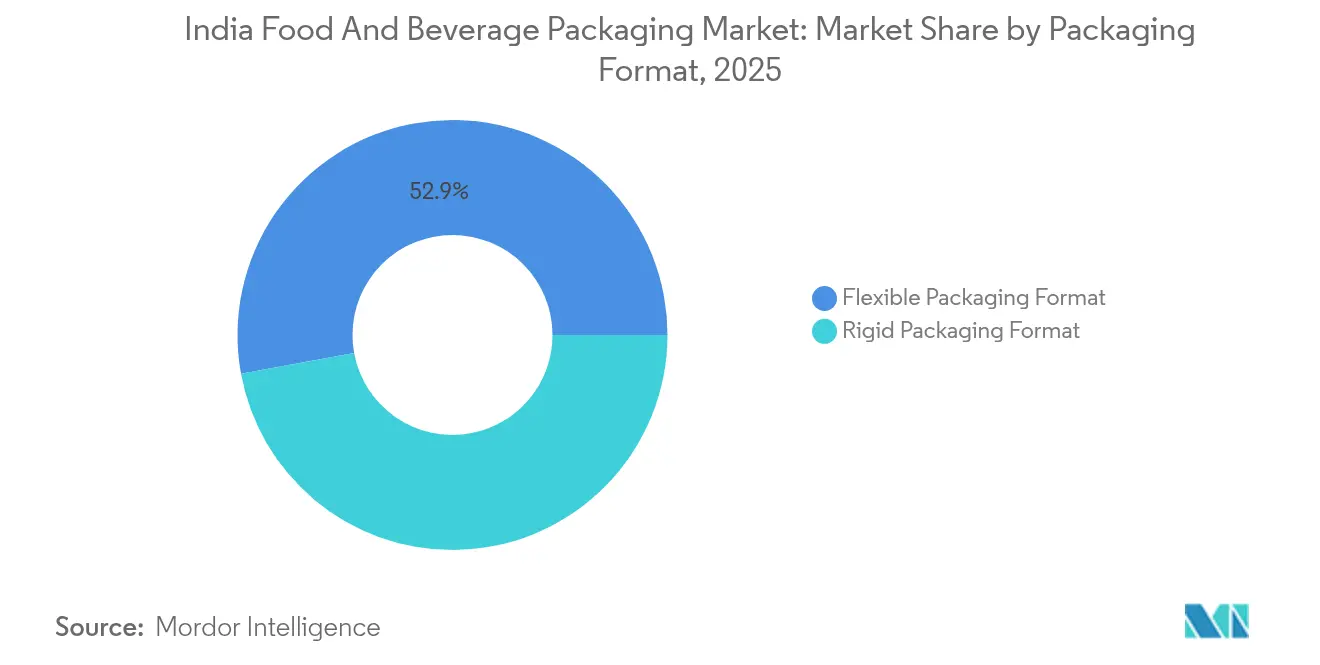
Flexible pouches still represented 52.88% of shipments in 2025, yet rigid containers are expanding at a 7.61% CAGR as exporters and premium beverage firms seek tamper-proof structures. Mold-Tek commissioned three new plants that lift injection-molded pail capacity by 5,500 MTA, signaling confidence in rigid demand from sauces, ice creams, and edible oils. Light-weighting and in-mold labeling mitigate material costs while retaining shelf appeal. Retort-ready stand-up pouches in flexible substrates maintain momentum for curry and khichdi meals, though cost inflation in aluminum foil raises converter caution.
Advanced blow-molding lines adopting digital twin controls cut resin use by 8-10% and allow easy rPET incorporation. Rigid PET bottles with 30% recyclate now roll out for flavored milk and cold brews, fulfilling the April 2025 rule without process downtime.
By End-Use Category: Beverages Mark Faster Lane
Food retained 44.38% revenue in 2025, but beverages are projected to log a 7.41% CAGR to 2031. Less than 10% of India’s milk output is packaged, leaving a vast headroom for aseptic cartons and multilayer pouches. SIG’s Ahmedabad plant will churn out 4 billion packs yearly, slashing lead times for dairies in the west and north. Functional drinks and plant-based protein shakes need oxygen-scavenging closures and UV-shield labels.
Nutraceutical gummies favor HDPE bottles with induction seals that block moisture ingress. Meat, poultry, and seafood rely on vacuum pouches and thermoformed trays that align with expanding cold chains. Bakery brands invest in metallized OPP wraps to maintain crispness in humid climates. Urban on-the-go consumers gravitate to resealable, slimline cans that fit ride-hailing cup-holders, reinforcing metal’s ascent.
Geography Analysis
Maharashtra heads the India food and beverage packaging market thanks to its diversified manufacturing clusters, strong cold-chain presence, and proximity to Mumbai’s consumption engine. Gujarat leverages port connectivity and investor-friendly policies to lure global majors such as Amcor, which acquired Phoenix Flexibles to deepen local laminates capacity. Karnataka marries tech talent with automation adoption, spurring uptake of vision-based QC systems that trim wastage in flexible lines.
Tamil Nadu tops ready-meal exports and champions retort pouch capability geared for European grocery chains. The state’s seafood processors require FDA-compliant barrier films and in-line metal detection. Haryana and Telangana are newer entrants. Haryana benefits from Delhi NCR demand and existing PET preform clusters, while Telangana utilizes its pharma coating expertise to craft odor-free food packs. The Production Linked Incentive Scheme has sanctioned 755 projects and INR 1.23 lakh crores of committed outlays, with a notable share mapped to these emerging hubs.
Cold-chain infrastructure remains uneven. Southern states host 40% of integrated cold stores, enabling long-haul movement of cut fruit in MAP trays toward Gulf retailers. Western corridors rely on reefer truck fleets that still trail best-practice temperature monitoring. Uniform national standards from BIS and FSSAI smooth interstate trade, yet enforcement intensity varies, nudging brand owners to impose their own supplier audits
Regulatory Landscape
India food and beverage packaging is regulated primarily by the Food Safety and Standards Authority of India (FSSAI) under the Food Safety and Standards (Packaging) Regulations, 2018, with Bureau of Indian Standards (BIS) requirements for food-contact materials. In March 2025, an FSSAI amendment enabled recycled PET in direct food-contact applications, subject to compliance conditions that increase testing and documentation requirements for converters and brand owners using rPET.
By 2026, regulatory attention has moved further toward circularity and format-specific restrictions. The Ministry of Environment, Forest and Climate Change notified the Plastic Waste Management (Amendment) Rules, 2026 (G.S.R. 237(E), dated March 31, 2026), which expands recycled-content obligations and reuse targets under EPR and requires PIBOs to register and report through the Central Pollution Control Board framework to maintain market access. FSSAI also issued draft amendments in April 2026 that add definitions for advanced formats such as aseptic packaging and modified atmosphere packaging, and proposed plastic-free packaging for pan masala, which affects material choices (paper, paperboard, cellulose, glass, or metal) and increases redesign and supplier qualification cycles.
Competitive Landscape
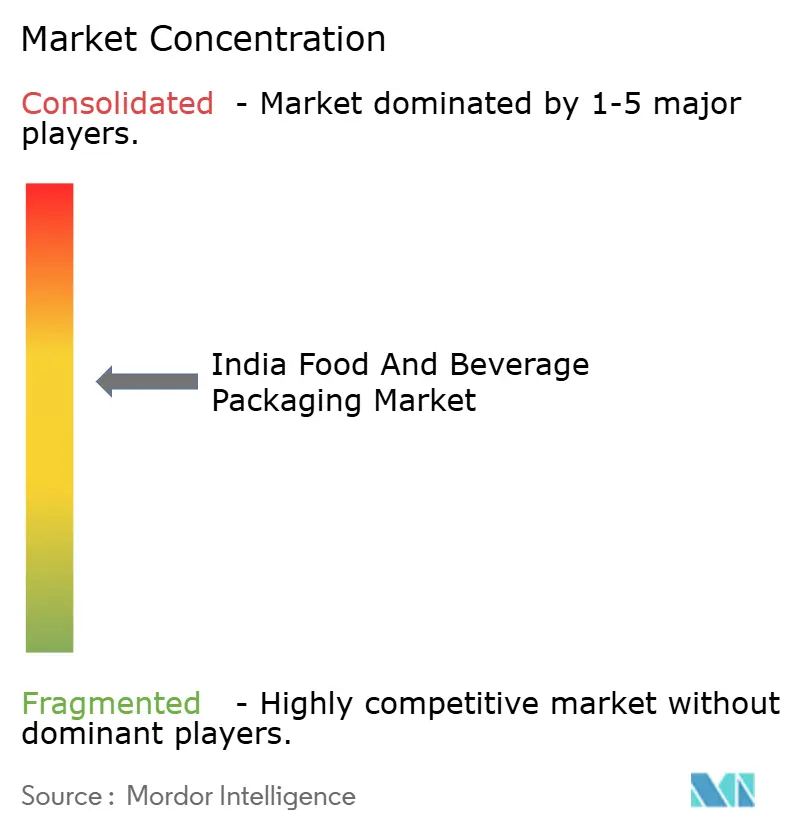
The India food and beverage packaging market features moderate concentration. Uflex combines PET resin, BOPP film, holographic security, and aseptic bricks under one roof, delivering price and lead-time advantages. TCPL Packaging diversifies through gravure, flexo, and digital presses, supplying folding cartons to multinational confectioners. EPL Limited holds global patents in laminated tubes, serving sauces and nut butters that need a high barrier with recyclability. Together, the three leaders hold about an 18% share, while the top ten account for 55%.
Competitors are racing to secure circular-economy credentials. Uflex is investing USD 200 million in an Egyptian PET chip plant tied to an aseptic pack line to serve Africa and the Middle East. TCPL trials water-based inks that meet toluene-free rules without curing delays. Balrampur Chini Mills is building a PLA plant valued at USD 240 million that will supply compostable resins to converters.[3]
Private-equity interest remains intense. PAG’s USD 204 million buyout of Pravesha Industries followed its USD 1 billion purchase of Manjushree Technopack, signaling confidence in scale economics and backward integration strategies. Smaller converters focus on niche playbooks such as blister backer cards for nutraceutical exports, acquired recently by Canpac Trends. Digital workflows, AI-based quality inspection, and blockchain batch tracking are moving from pilots to production across the sector.
India Food And Beverage Packaging Industry Leaders
-
Parekhplast India Limited
-
Pearl Polymers Ltd
-
Uflex Limited
-
TCPL Packaging Limited
-
EPL Limited
- *Disclaimer: Major Players sorted in no particular order
Market Opportunities and Future Outlook
Compliance-led redesign is creating near-term openings for certified recycled-content and reuse-ready packaging systems. The Plastic Waste Management (Amendment) Rules, 2026 (MoEFCC, March 31, 2026) formalize higher recycled-content requirements and reuse obligations for rigid packs under EPR, and require PIBO registration and compliance reporting, favoring converters that can provide traceable, food-contact compliant structures along with supporting documentation. At the same time, the April 2025 rPET mandate for beverage bottles (30% rPET) has highlighted a supply constraint (only five FSSAI-approved food-grade rPET plants covering about 15% of demand), supporting expansion in bottle-to-bottle resin capacity, lightweight bottle designs that can accommodate higher recyclate content, and tighter integration between recyclers, preform makers, and beverage fillers.
Material substitution opportunities are increasingly shaped by specific FSSAI proposals rather than broad sustainability narratives. The FSSAI draft packaging amendments published in April 2026 propose plastic-free packaging for pan masala, which provides a high-volume conversion route for paper, paperboard, and cellulose-based structures designed to meet barrier, shelf-life, and tamper-evidence needs without polymer laminates or metallized layers. Advanced preservation formats are also being codified in the same draft, which introduces definitions for aseptic packaging and modified atmosphere packaging and reinforces demand for higher-barrier films, certified inks and adhesives, and in-line inspection and traceability, particularly for processed foods, ready-to-eat meals, and export-linked supply chains.
Recent Industry Developments
- July 2026: EPL Limited invested about INR 144.54 million into its wholly owned subsidiary, EPL Packaging (Thailand) Co. Ltd. The move supports manufacturing and trading scale-up for laminated tubes, strengthening supply capability for food and beverage adjacencies such as sauces and condiments that use barrier tubes. This investment diversifies EPL's regional supply chain and expands capacity for barrier packaging solutions.
- March 2026: The Ministry of Environment, Forest and Climate Change notified the Plastic Waste Management (Amendment) Rules, 2026 (G.S.R. 237(E)). The notification expands compliance and reporting requirements for producers, importers, and brand owners. PIBO registration and compliance reporting are required under the new regime to maintain market access.
- March 2025: FSSAI issued an amendment enabling the use of recycled PET in direct food-contact packaging, subject to prescribed conditions and testing. This accelerated adoption of rPET in beverages and prompted converters to qualify approved recyclate sources while upgrading quality systems for food-contact compliance. The amendment also tightens testing and documentation protocols to ensure safety and traceability of recyclates.
Research Methodology Framework and Report Scope
Market Definition and Coverage
For this study, the market covers packaging used to pack food and beverage products that are manufactured and sold in India, measured in value terms. It includes the packaging formats and materials used to contain, protect, and distribute food and drinks through retail and foodservice channels.
Scope exclusions: Packaging used mainly for pharmaceuticals, personal care, home care, industrial goods, and bulk transport packaging for non-food uses is excluded.
Segmentation Overview
- By Material Type
- Paper and Paperboard
- Plastic
- Polyethylene Polypropylene (PP)
- High-density Polyethylene (HDPE) and Low-density Polyethylene (LDPE)
- Polyethylene Terephthalate (PET)
- Polyvinyl Chloride (PVC)
- Polystyrene (PS)
- Other Plastics
- Metal
- Container Glass
- By Product Type
- Paper and Paperboard Product Type
- Folding Carton and Rigid Boxes
- Corrugated Boxes and Containers
- Single-use Paper Products
- Other Paper and Paperboard Product Types
- Plastic Product Type
- Rigid Plastics
- Bottles and Jars
- Caps and Closures
- Bulk-Grade Products
- Other Rigid Plastics Product Types
- Flexible Plastics
- Pouches
- Bags
- Films and Wraps
- Other Flexible Plastics Product Types
- Rigid Plastics
- Metal Product Type
- Cans
- Caps and Closures
- Aerosol Containers
- Other Metal Product Types
- Container Glass Product Type
- Bottles
- Jars
- Paper and Paperboard Product Type
- By Packaging Format
- Rigid Packaging Format
- Flexible Packaging Format
- By End-Use Category
- Food
- Dairy Products
- Meat, Poultry and Seafood
- Bakery and Confectionery
- Fruits and Vegetables
- Ready-to-Eat and Meal Kits
- Snacks and Savouries
- Nutraceuticals and Supplements
- Other Food
- Beverage
- Carbonated Soft Drinks and Juices
- Beer
- Wine and Spirits
- Bottled Water
- Milk and Dairy Beverages
- Energy, Sports and Functional Drinks
- Other Beverage
- Food
Data Sources, Market Sizing, and Validation
Desk Research
Desk research was used to build the basic market picture and to set realistic ranges for volumes, prices, and conversion factors across packaging formats. We relied on public references such as the Ministry of Statistics and Programme Implementation, the Ministry of Commerce and Industry trade statistics, FSSAI notifications and standards, and datasets from the Central Pollution Control Board for packaging waste and compliance context. Where helpful, we also reviewed sources such as the Indian Institute of Packaging publications and peer-reviewed journals that discuss barrier needs, shelf-life, and material substitution in packaged foods.
To tie packaging demand back to end-market signals, we also used company annual reports, investor presentations, and credible press coverage on capacity additions, new packaging lines, and material shifts. Select paid subscriptions were used only for company financials, patent lookups, and shipment-level import and export checks when public series had gaps. These desk sources are illustrative and not exhaustive, and many other public and paid references were used for cross-checks and clarification.
Primary Interviews and Surveys
Primary work was used to pressure-test the desk assumptions that affect value the most, especially the split between flexible and rigid formats, typical pricing by material, and the pace of recycled content adoption. We spoke with packaging converters, material suppliers, brand procurement teams, and channel participants across major consuming belts, then we rechecked differences across packaged food categories and beverage types before finalizing totals.
Distribution of primary research fieldwork respondents
| Company type | Respondent position |
|---|---|
| Top tier: 27% | CXOs: 17% |
| Mid tier: 53% | Functional/Unit leaders: 34% |
| Smaller Players: 20% | Managers: 49% |
Market-Sizing & Forecasting
Sizing was built around a top-down demand pool, where packaged food and beverage output and trade flows are used to reconstruct packaging consumption, which is then converted into value using format and material level price ranges. The model uses variables that practitioners could track year to year, such as packaged food volumes by category directionally, beverage production mix, flexible versus rigid penetration in key packs, average pack weights (light-weighting effects), resin and paper price movement, and changes in recycled content requirements that influence material choice and cost.
Once the demand pool was shaped, results were corroborated with selective bottom-up approximations, including sampled converter revenue splits for India, capacity and utilization cues from plant announcements, and channel checks on fast-moving pack types. Where company disclosures were incomplete, gaps were handled by using conservative utilization bands and price ranges aligned in primary discussions, then adjusted so totals remained consistent with end-market signals.
For forecasting, scenario analysis was used, supported by short-run smoothing on key input series like material pricing and packaged food growth, and then refined using expert views on how quickly pack formats are shifting. The final forecast reflects a base case that aligns with observable consumption trends and policy-driven packaging changes, and it stays traceable to the same core inputs used for the historical build.
Data Validation & Update Cycle
Validation is done through multiple checkpoints so the final number does not rely on a single assumption. We compare outputs against independent signals such as packaging capacity additions, material price direction, and visible shifts in packaged food and beverage volumes, then investigate any large variances before sign-off. If a key input moves unusually, such as a sharp resin price swing or a major compliance change that affects material selection, the assumptions are rechecked through follow-up calls.
Each report is refreshed annually, and interim updates are triggered when material events materially change pricing, availability, or packaging mix. Before delivery, an analyst performs a fresh pass on the core inputs and the market math so clients receive an updated view aligned to the latest public releases.
Mordor Intelligence's India Food and Beverage Packaging Market Size Compared With Other Published Estimates
Published market sizes for India food and beverage packaging can look far apart, even when the topic sounds identical. The spread usually comes from what is counted as packaging value, how imported packaged goods are treated, and whether pricing is modeled at converter level or at a later point in the chain.
The table helps show how scope and pricing choices can push the estimate up or down. Some figures blend in adjacent packaging demand from non-food uses, apply aggressive price escalation, or treat materials in a way that double counts multi-layer structures when converting volumes into value, which then changes the final total.
Benchmark comparison
| Source | Market Size | Gaps in Research Methodology |
|---|---|---|
| Mordor Intelligence | USD 38.27 B (2025) | |
| Industry Publisher A | USD 26.25 B (2025) | Often narrows coverage toward select packaged food formats and applies simplified price points, which can understate value where rigid packs, closures, and higher-specification materials are used. |
| Global Consultancy B | USD 62.80 B (2026) | Tends to broaden the definition across a wider set of packaging activities and may apply higher chain-level pricing, which can inflate totals when compared with converter-level value boundaries. |
The table shows a wide range, and in Mordor Intelligence's model the value is kept at packaging supply level for food and beverage uses in India, with checks on pack mix and material pricing so multi-layer structures are not inadvertently counted twice. With these choices made explicit, the result stays easier to reconcile with observable demand signals and to recreate when assumptions are updated.
Key Questions Answered in the Report
How large is the India food and beverage packaging market in 2026?
It is valued at USD 40.73 billion and is projected to grow at 6.44% CAGR to reach USD 55.67 billion by 2031.
Which packaging format is growing fastest?
Rigid containers are expanding at a 7.61% CAGR, fueled by premium beverages and export-oriented ready meals.
What effect does the 30% rPET mandate have on bottle costs?
Converters estimate packaging costs could rise about 30% because supply of food-grade rPET covers only 15% of demand.
Which region is the main manufacturing hub?
Maharashtra leads due to its industrial base and consumption center proximity, followed by Gujarat with strong port access.
Who are the key market players?
Uflex, TCPL Packaging, and EPL Limited together hold about 18% share, backed by vertical integration across films, inks, and converting.
Why are SMEs struggling with compliance?
Many lack capital for solvent-free printing and advanced quality controls, leaving only 20% compliant with IS 15495 for toluene-free inks.