
Market Overview
| Study Period | 2020 - 2031 |
|---|---|
| Forecast Data Period | 2026 - 2031 |
| Historical Data Period | 2020 - 2024 |
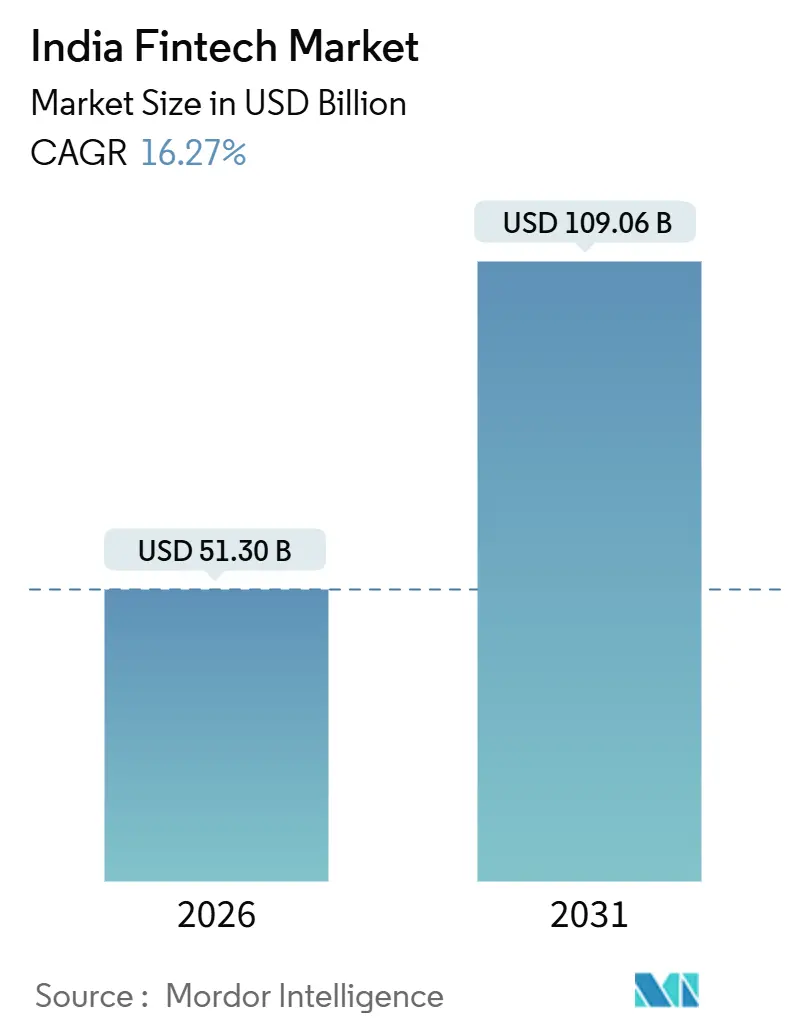
| Market Size (2026) | USD 51.30 Billion |
| Market Size (2031) | USD 109.06 Billion |
| Growth Rate (2026 - 2031) | 16.27 % |
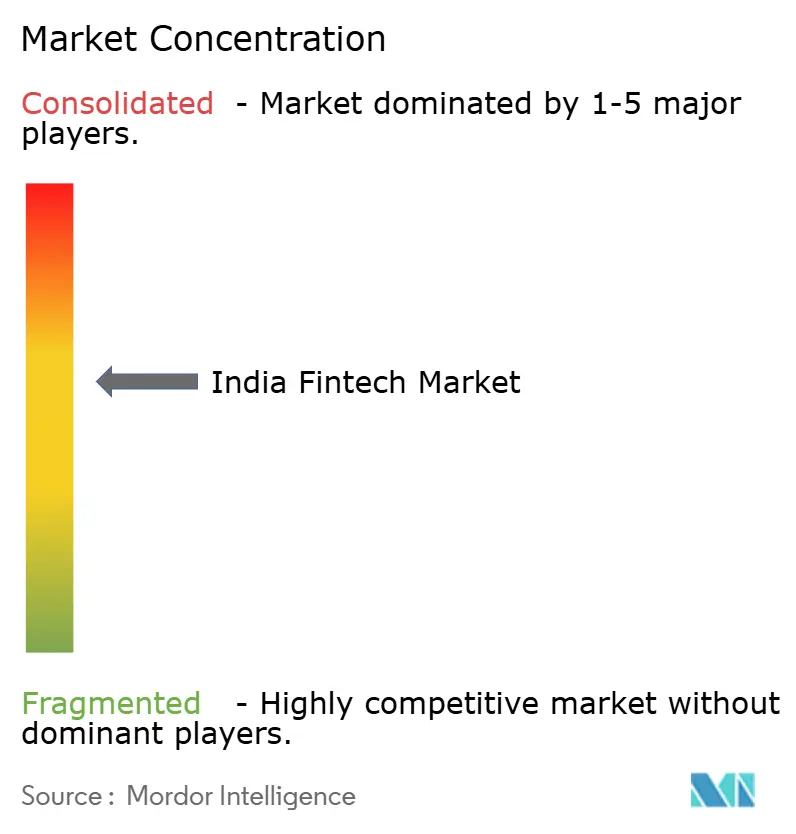
| Market Concentration | Medium |
Major Players *Disclaimer: Major Players sorted in no particular order Image © Mordor Intelligence. Reuse requires attribution under CC BY 4.0. | |
India Fintech Market Analysis by Mordor Intelligence
The India fintech market size is USD 51.30 billion in 2026 and is projected to reach USD 109.06 billion by 2031 at a 16.27% CAGR during the forecast period (2026-2031).
This expansion aligns with accelerating adoption of India’s digital public infrastructure, including UPI for instant payments, Aadhaar for e-KYC, and the Account Aggregator framework for consent-based data sharing that reduces underwriting friction across retail and MSME segments. India accounts for 49% of global real-time payment volumes in 2023, which sustains the transaction scale that anchors monetization across adjacent credit, insurance, and wealth products. Digital payments hold the largest segment share and remain the gateway for cross-sell, while neobanking is the fastest growing as multi-bank UPI and app-first interfaces expand access to deposits, credit, and spending tools. The India fintech market benefits from government incentives on low-value UPI P2M transactions, which drive merchant acceptance and sustain usage habits across small-ticket payments in semi-urban and rural areas. The Account Aggregator ecosystem’s scale-up, combined with Aadhaar authentication reaching near-universal adult coverage, enables faster onboarding and data-rich underwriting models that reduce acquisition costs and improve risk selection for regulated entities and fintech partners.
Key Report Takeaways
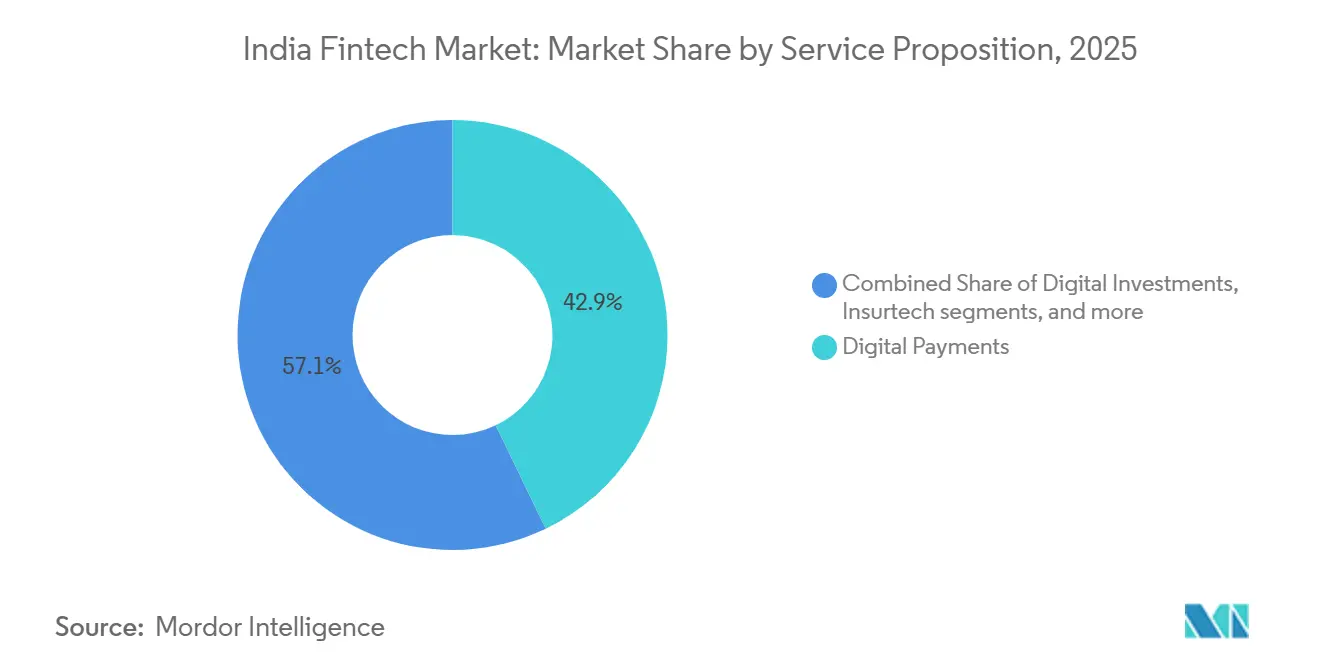
- By service proposition, digital payments led with 42.87% of the India fintech market share in 2025, while neobanking is projected to grow at a 19.64% CAGR during 2026 to 2031.
- By end-user, retail accounted for 66.24% of the India fintech market share in 2025, while business-facing solutions are projected to expand at a 17.52% CAGR through 2031.
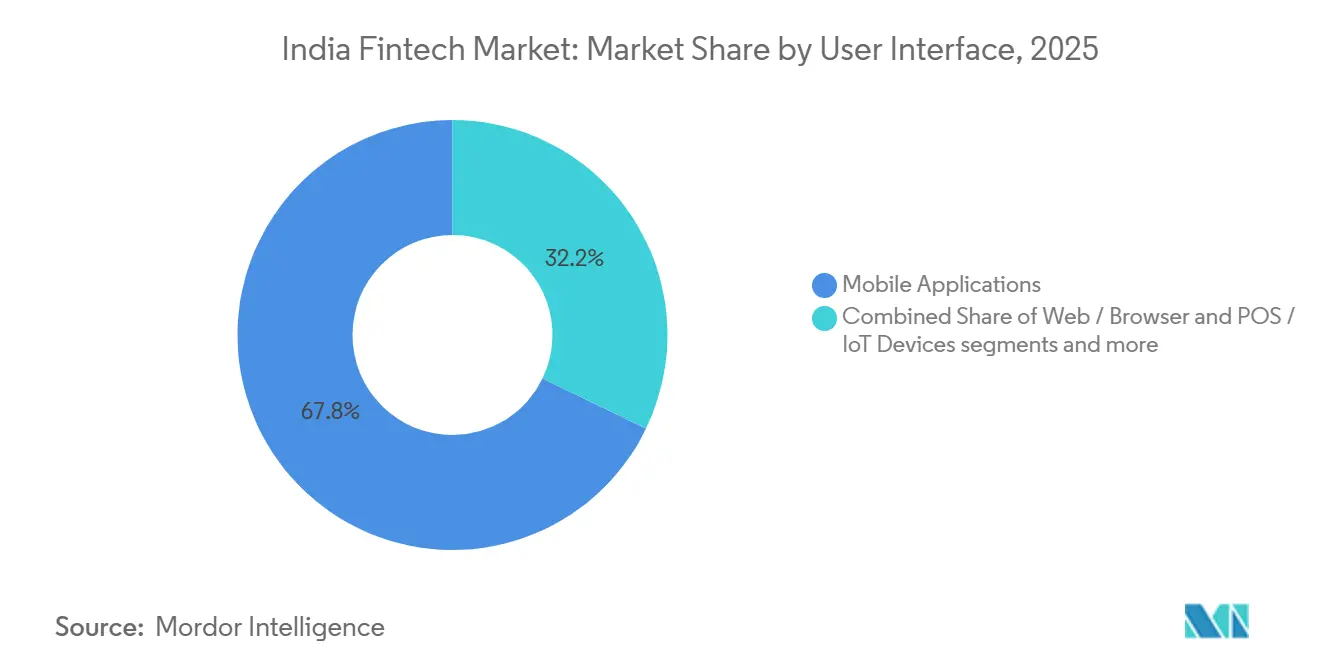
- By user interface, mobile applications commanded 67.83% of the India fintech market share in 2025 and are projected to grow at 18.39% through 2031.
Note: Market size and forecast figures in this report are generated using Mordor Intelligence’s proprietary estimation framework, updated with the latest available data and insights as of January 2026.
India Fintech Market Trends and Insights
Drivers Impact Analysis*
| Driver | (~) % Impact on CAGR Forecast | Geographic Relevance | Impact Timeline |
|---|---|---|---|
| Government-Built Digital Public Infrastructure Accelerating Adoption | + 4.2% | National, metros to rural via Aadhaar and UPI voice flows | Medium term (2-4 years) |
| Account Aggregator Framework Enabling Data-Driven Credit | + 2.8% | National, led by urban centres | Medium term (2-4 years) |
| Embedded-Finance Demand from E-commerce and Gig Platforms | + 3.1% | National, metro to tier-2 clusters | Short term (≤ 2 years) |
| Formalization of MSMEs post-GST is Creating New Demand Pools | + 2.5% | National, strong in industrial states | Medium term (2-4 years) |
| Millennial and Gen-Z Wealth Creation Boosting Robo-Advisory | + 1.9% | Urban India with tier-2 spillover | Medium term (2-4 years) |
| Cross-Border UPI Linkages Opening Remittance Revenues | + 1.8% | Corridors with ASEAN and the Middle East | Long term (≥ 4 years) |
| Source: Mordor Intelligence | |||
Government-Built Digital Public Infrastructure (UPI, Aadhaar, OCEN) Accelerating Mass-Market Adoption
India’s real-time payments infrastructure, Aadhaar-based identity, and interoperable data-sharing rails together remove friction that previously slowed onboarding and transactions at scale. India’s share of global real-time payments reached 49% in 2023, which supports recurring payment behaviours and merchant acceptance models that monetize at large daily volumes. Aadhaar authentication hit 2.21 billion in August 2025, with adult coverage at 99.7%, which closes KYC gaps and shortens onboarding in the India fintech market[1]Unique Identification Authority of India, “UIDAI Records 221 Crore Aadhaar Authentication Transactions in August 2025,” UIDAI, uidai.gov.in. The Account Aggregator network has linked consented users to over 2.61 billion enabled accounts, allowing lenders and insurance distributors to retrieve verified financial data within seconds, which compresses underwriting timelines for thin-file customers[2]Department of Financial Services, “Account Aggregator Framework,” Ministry of Finance, financialservices.gov.in. Together, these rails power scale economics that favour embedded journeys across payments, credit, insurance, and investments as the India fintech market deepens coverage in semi-urban and rural districts.
Account Aggregator Framework Unlocking Data-Driven Credit Underwriting
The Account Aggregator framework normalizes consent-based access to financial data and reduces the cost of risk assessment for banks and NBFCs partnering with fintech platforms. With users connecting bank accounts and other financial repositories through licensed AAs, lenders derive a real-time view of cash flows, which supports extensions of small-ticket working capital and personal credit to thin-file customers. RBI’s broader regulatory sandbox and digital lending directions strengthen disclosures and grievance processes, which support sustainable scale for the India fintech market as more lenders shift from screen-scraping to auditable consent models. Standardization across APIs and consent flows lowers manual verification delays that once kept micro-entrepreneurs and gig workers outside formal credit. Over time, underwriting that relies on verified transaction trails improves portfolio quality while increasing access for first-time borrowers in the India fintech market.
Embedded-Finance Demand from E-commerce and Gig-Economy Platforms
E-commerce checkouts, logistics apps, and service marketplaces embed payments, credit, and protection into transaction flows, shifting financial product discovery from standalone journeys to on-platform prompts. Payment aggregators introduced buyer protection and merchant tools such as corporate cards and checkout credit, which lift conversion and create post-transaction monetization paths at scale. Government incentives for low-value UPI P2M transactions encourage merchant acceptance and reduce resistance to digital settlement, which increases the utility of embedded finance across small merchants. Gig platforms that settle earnings digitally create demand for embedded credit and micro-insurance, which extends product reach to new-to-credit cohorts in the India fintech market. As API-led integrations spread, revenue models shift toward revenue sharing and subscription-like bundles that align platform growth with financial product scale in the India fintech market[3]Razorpay, “Everything We Launched at FTX 2025,” Razorpay, razorpay.com.
Formalization of MSMEs Post-GST Creating New SME Fintech Demand Pools
GST compliance and digital invoicing expand verifiable data trails that modern underwriting can use to assess MSME creditworthiness in the India fintech market. Registrations on the Udyam and Udyam Assist platforms create a formal base of micro and small businesses that can be addressed through API-driven lending and payments services. The RAMP program, which is supported by the World Bank and operational through FY 2026-27, supports technology upgrades, digital onboarding, and capacity building for MSMEs, which strengthens demand for embedded fintech in procurement and receivables. Incentives like per-transaction reimbursements under programs that target artisans and micro-entrepreneurs help build enduring digital payment habits among traditional businesses. These interventions shift MSMEs from cash-based informal operations toward bankable behaviours, which enlarges the addressable base for the fintech industry in India.
Restraints Impact Analysis*
| Restraint | (~) % Impact on CAGR Forecast | Geographic Relevance | Impact Timeline |
|---|---|---|---|
| RBI Digital-Lending and FLDG Norms Raising Compliance Cost | - 2.3% | National, heavier for smaller NBFCs | Short term (≤ 2 years) |
| Zero-MDR Policy Compressing Payment-Gateway Profit Pools | - 1.7% | National, for aggregators and acquirers | Medium term (2-4 years) |
| Escalating Cyber-Fraud Incidents Undermining Trust | - 1.4% | National, higher in urban centres | Short term (≤ 2 years) |
| Post-2022 Funding Winter Constraining Scale-Up Capital | - 1.3% | National, affecting mid to late stages | Medium term (2-4 years) |
| Source: Mordor Intelligence | |||
RBI’s Stricter Digital-Lending and FLDG Norms Raising Compliance Cost
RBI’s digital lending directions strengthen disclosures, escrow segregation, and grievance handling, which increases fixed compliance costs for platforms and their regulated partners in the India fintech market. Clarifications around risk retention and default guarantees shift capital requirements to lenders and co-lenders, which compresses margins for models that depended on risk transfer to bank partners. Larger lenders and well-capitalized platforms can absorb these costs, while smaller entities face exit or consolidation as compliance becomes a scale advantage in the India fintech market. RBI’s sandbox and supervisory focus push product design toward transparency and customer protection, which reduces regulatory risk but slows experimental rollouts. This recalibration prioritizes sustainable origination over rapid growth, which tempers expansion in digital lending before a new equilibrium emerges in the India fintech market.
Zero-MDR Policy Compressing Payment-Gateway Profit Pools
Zero MDR on RuPay debit and UPI transactions removes a direct revenue line for payment aggregators, which pushes monetization to value-added services such as corporate cards, working capital, and business banking in the India fintech market. The government’s UPI P2M incentive cushion supports smaller merchant transactions but does not replace MDR economics for large merchants or high-ticket volumes. Aggregators with credit and software stacks can cross-sell to defend margins, while subscale providers struggle to offset the revenue compression as the India fintech market shifts to bundled services. RBI’s guidance for payment aggregators, including net worth thresholds, increases entry barriers and deepens the need for diversified monetization for players that remain. These moves anchor long-term stability while reducing short-term profitability for pure-play payments in the Indian fintech market.
*Our forecasts treat driver/restraint impacts as directional, not additive. The impact forecasts reflect baseline growth, mix effects, and variable interactions.
Segment Analysis
By Service Proposition: Payments Dominate, Neobanking Ascends as Digital-First Banking Matures
Digital payments captured 42.87% of the India fintech market share in 2025, anchored by UPI’s scale and merchant acceptance that sustains habitual usage across daily purchases. India’s real-time rail supports checkout conversion and merchant trust, which anchors cross-sell into protection, loan, and wealth products across the India fintech market. The India fintech industry uses app-first journeys and interoperable rails to reduce acquisition friction and extend reach beyond metros into semi-urban districts. Aggregators ship enterprise and SMB tools, including buyer protection and export settlement accounts, which create monetization beyond MDR in the India fintech market. As regulatory guidance on payment aggregators raises net worth thresholds, scale advantages, and compliance maturity, it drives consolidation within payments.
The India fintech market size for neobanking is projected to expand at a 19.64% CAGR between 2026 and 2031 as multi-bank UPI models and app-centric accounts deepen usage among digital-first customers. Neobanks layer budgeting, credit access, and business banking features on top of existing rails, which improves retention and fee capture in the India fintech market. Digital lending growth moderates in the near term as risk retention norms and disclosure-heavy processes add cost, which encourages co-lending models with banks and more selective origination. Wealth and insurance aggregators scale by combining distribution with service layers, while maintaining customer acquisition through cross-sell on a large payment basis in the India fintech market. Over the forecast period, propositions that bundle payments, credit, and protection into unified interfaces are positioned to capture higher lifetime value per user in the India fintech market.


By End-User: Retail Leads, Yet Business Solutions Accelerate as Enterprises Digitize Treasury Functions
In 2025, retail accounted for a 66.24% share of the fintech market size in India, lifted by smartphone penetration, instant onboarding via Aadhaar e-KYC, and everyday UPI use across P2P and P2M transactions. Consumer journeys through payments, small-ticket credit, and investments continue to widen as app-first experiences simplify onboarding and service. Cross-sell along a large payments base drives growth for platforms that now bundle lending, protection, and wealth inside the same interface in the India fintech market. Over the last year, app-first brokers and aggregators deepened reach, while onboarding costs fell due to interoperable rails and consent-based data flows. Retail scale remains sensitive to income cycles and equity sentiment, yet penetration continues to rise from a low base in the India fintech market.
Business-facing solutions are projected to grow at a 17.52% CAGR from 2026 to 2031 as enterprises embed APIs for payouts, vendor payments, reconciliation, and expense management in the India fintech market. Payment aggregators ship corporate cards and business banking suites that integrate with ERP and accounting software to streamline treasury operations. MSME credit demand expands as GST data and Udyam registrations improve the reliability of underwriting inputs across lenders and co-lenders. Platforms broaden revenue from pure transactions to subscriptions and credit-linked services, which lifts average revenue per business user in the India fintech market. As interoperability gains and product breadth increase, business adoption becomes stickier due to integrations with procurement and reconciliation workflows in the India fintech market.
By User Interface: Mobile Applications Command, Biometric, and Offline UPI Extend Access
Mobile applications commanded 67.83% share of the India fintech market size in 2025 and are projected to grow at 18.39% through 2031, supported by UPI Lite, biometric authentication, and app-first account opening that improve completion rates. UPI’s expansion with low-value incentives supports small-ticket merchant payments and new user cohorts in semi-urban and rural areas. Voice-based 123PAY extends feature phone access, which broadens addressability for payments beyond smartphones in the India fintech market. Payment and business banking suites now include chat-native assistants that execute tasks inside conversations, which reduces drop-offs that occur during context switching. Web dashboards remain central for enterprise administrators who need granular control, while mobile-first remains the primary interface for end users in the India fintech market.
Point-of-sale and IoT devices continue to expand offline acceptance and provide real-time reconciliation through cloud dashboards, which support SMB digitization in the India fintech market. Offline merchant tools such as soundboxes and multi-mode POS become complementary to mobile, especially where bandwidth is variable. RBI’s guidance on payment aggregators clarifies compliance and net worth requirements for device-led acceptance models, which benefits well-capitalized providers over subscale entrants. As biometric and tokenization standards spread, checkout completion rates improve across in-app, web, and in-store contexts for the India fintech market. The combined effect is a hybrid interface strategy that pairs mobile dominance with merchant-point innovation in the India fintech market.
Geography Analysis
The India fintech market concentrates in metro and tier-1 centres where banking density and smartphone adoption are strongest, while policy and infrastructure spread usage outward to semi-urban districts. RBI’s Master Direction on payment aggregators specifies authorization norms and net worth thresholds, which strengthen compliance baselines for providers headquartered in these hubs. Aadhaar authentication at a national scale enables uniform KYC experiences that reduce onboarding delays across states and districts. Payment and insurance aggregators continue to deepen their reach across tier-2 and tier-3 markets through hybrid distribution that blends digital channels with local agents. The India fintech market keeps building on national platforms while local merchant acceptance and customer support adapt to regional contexts.
Semi-urban districts and tier-3 cities show faster adoption velocity as incentives and simplified user flows lower barriers to digital payments. Voice-based UPI improves accessibility in low-bandwidth and feature phone environments, which supports inclusion goals for the India fintech market. Company rollouts of merchant devices, settlement tools, and agent support help onboard small businesses that prefer assisted journeys. Insurance and wealth aggregators expand with localized partner networks that support advisory and claims service in new districts. The result is a broader reach without sacrificing service quality as the India fintech market scales.
Cross-border corridors become an additional growth lever as UPI connectivity expands, which supports exporter settlement and diaspora spending capture in the India fintech market. Exporter accounts tailored for marketplaces and faster settlement help ease liquidity constraints for small sellers who expand sales across borders. Merchant acceptance for inbound travellers and diaspora segments, paired with domestic payout efficiencies, increases the utility of platform-led services beyond India’s borders. Compliance clarity on payment aggregation and data-sharing practices reduces frictions for global enterprises that serve Indian customers. Over time, corridor expansion improves resilience by diversifying revenue beyond domestic transaction volumes for the India fintech market.
Regulatory Landscape
India fintech operates under multiple regulators, with the Reserve Bank of India (RBI) setting the core rulebook for payments and lending, and the Securities and Exchange Board of India (SEBI) governing market intermediaries and technology controls in securities. In April 2026, RBI issued the Digital Payments, E-mandate Framework, 2026 (effective April 21, 2026), consolidating earlier e-mandate instructions and tightening consistency for recurring payment authorization, authentication, and customer protections used by payment gateways and aggregators.
The compliance baseline for platforms is also shaped by RBI Master Directions and updates. This includes the September 2025 update to the Master Direction on Regulation of Payment Aggregators, which references security requirements such as PCI-DSS and PCI-SSF, along with updated directions for prepaid payment instruments (PPIs) under RBI Master Directions. Alongside RBI, SEBI updated its intermediary framework through the Securities and Exchange Board of India (Intermediaries) (Amendment) Regulations, 2026, and released a June 2026 consultation on technology and common IT-related provisions for market infrastructure institutions, reinforcing the need for documented, auditable controls for fintechs that distribute or enable investment and brokerage journeys.
Value Chain Analysis
The India fintech value chain starts with national digital public infrastructure (DPI) rails, primarily NPCI-operated UPI for real-time payments and linked extensions (for example, UPI Lite and feature-phone flows), Aadhaar-enabled identity and e-KYC for onboarding, and the Account Aggregator (AA) framework for consent-based data retrieval used in underwriting and distribution. On top of these rails sit regulated balance-sheet entities (banks and NBFCs), licensed payment and data intermediaries (payment aggregators, PPI issuers, AAs), and fintech application layers that deliver consumer and MSME experiences across payments, lending, wealth, insurance, and neobanking, typically via mobile apps and merchant devices.
Distribution and monetization run through merchant acquisition and acceptance (QR, soundboxes, POS/IoT devices), payment gateways for online checkout, and embedded finance integrations inside e-commerce, logistics, and gig platforms. For MSMEs, embedded working-capital and supply-chain finance models connect B2B SaaS platforms and fintechs with multi-lender banking networks through integration hubs, enabling invoice-led and cashflow-led credit at the point of workflow. Recent infrastructure additions showcased at Global Fintech Festival 2025, including Banking Connect via NPCI Bharat BillPay Limited and AI-enabled dispute support concepts, point to upstream capability upgrades that flow into faster merchant enablement, better reconciliation, and more automated servicing across the ecosystem.
Competitive Landscape
The India fintech market shows moderate concentration as large platforms and well-capitalized providers consolidate share in payments, distribution, and embedded finance while leaving room for mid-tier specialists. Multi-bank UPI architectures and device-led merchant acceptance strengthen reliability and retention in payments franchises. Payment aggregators ship corporate cards, buyer protection, and conversational agents to expand monetization and reduce checkout drop-offs. Insurance distribution scale comes from aggregator-led partner networks and improved unit economics in health and term products. AA-driven consent frameworks enable lenders to compete on data-rich underwriting, compressing acquisition costs across retail and MSME cohorts.
Compliance readiness and capital buffers increasingly serve as competitive moats due to RBI directions for digital lending and payment aggregation in the India fintech market. Government incentives encourage adoption in small-ticket P2M transactions, which fuels traffic and drives the need for value-added services to offset zero-MDR. Platforms with broad product suites and device ecosystems can cross-sell with higher conversion, which improves revenue per user in the India fintech market. Aggregators continue to extend into export settlement and automated reconciliation, which modernize treasury operations for SMBs and mid-market firms. The Account Aggregator ecosystem’s limited number of licensed entities underscores the value of partner-ready compliance in data-driven products.
Select players executed notable strategic moves in 2025 that illustrate consolidation, product breadth, and governance readiness. One large platform divested non-core consumer verticals, shifted to a multi-bank UPI model, and highlighted faster settlement and reliability for merchants and users in the India fintech market. A major aggregator launched corporate cards, buyer protection guarantees, and an agentic AI toolkit that executes transactions inside chat, which reduces friction during checkout and post-purchase actions. BharatPe achieved profitability at the PBT level and secured RBI authorization as an online payment aggregator, which enhances its ability to scale acceptance with banks and regulated partners. Across these moves, players align to regulatory direction while expanding into stickier, higher-margin services in the India fintech market.
India Fintech Industry Leaders
Paytm (One97 Communications Ltd)
PhonePe Pvt Ltd
Razorpay Software Pvt Ltd
Pine Labs Pvt Ltd
PayU Payments Pvt Ltd
- *Disclaimer: Major Players sorted in no particular order

Market Opportunities and Future Outlook
Cross-border UPI expansion is creating monetization whitespace across remittances, inbound traveler acceptance, and SME exporter settlement, moving fintech opportunity beyond domestic P2M scale alone. UPI acceptance has expanded internationally across multiple corridors and reached a new milestone with a June 2026 launch event in Greece, while India also announced progress on integrating UPI with Indonesia's payment system in July 2026. In parallel, NPCI and HSBC India announced real-time FX settlement for cross-border UPI in July 2026, improving price transparency at checkout and strengthening the product proposition for gateways and TPAPs serving travelers and cross-border merchants.
Consent-based data sharing and governance maturation in the AA ecosystem is opening product room for faster, auditable underwriting and compliant data-driven distribution across retail and MSME segments. RBI recognition of Sahamati as the Self-Regulatory Organization (SRO) for the Account Aggregator ecosystem in June 2026 adds an industry-led governance layer that supports standardized practices around consent flows, grievance handling, and operational discipline, aligning with the report context of underwriting and onboarding shifting away from informal data pulls. On the payments side, continued government support for low-value UPI P2M incentives and productization by leading platforms into value-added merchant tooling (for example, AI-led gateway integration and checkout tools) keeps the opportunity centered on bundling, where payments act as the entry point for credit, insurance distribution, and business banking services under a higher compliance bar.
Recent Industry Developments
- July 2026: NPCI partnered with HSBC India to enable real-time foreign exchange settlement for cross-border UPI transactions, allowing users to see the exact INR amount payable at international merchant points. This improves price transparency and reduces FX uncertainty, strengthening UPI-based acceptance for travel-led spending and cross-border merchant acquisition.
- June 2026: RBI recognized Sahamati as the Self-Regulatory Organization (SRO) for the Account Aggregator ecosystem. The move formalizes industry-led governance for consent-based data sharing, supporting more standardized operational practices for AA participants and fintechs building data-driven credit and distribution journeys.
- October 2025: At Global Fintech Festival 2025, RBI and NPCI unveiled new digital payment initiatives including AI-based UPI HELP for dispute resolution, IoT Payments with UPI, and Banking Connect for interoperable net banking via NPCI Bharat BillPay Limited. These infrastructure enhancements expand the upstream capability set available to gateways and merchant-facing fintechs, enabling richer acceptance and servicing workflows beyond basic UPI QR payments.


Research Methodology Framework and Report Scope
Market Definition and Coverage
For this methodology, the India fintech market is the revenue generated from digital-first financial products and services delivered in India, where customer onboarding, servicing, and transaction execution happen through online or app-led channels. It covers payments, lending, investing, insurtech distribution, and neobanking propositions used by consumers and businesses.
Scope exclusions: We exclude generic IT services, core banking implementation projects, and back-office enterprise software that does not directly enable a financial product or customer transaction.
Segmentation Overview
- By Service Proposition
- Digital Payments
- Digital Lending and Financing
- Digital Investments
- Insurtech
- Neobanking
- By End-User
- Retail
- Businesses
- By User Interface
- Mobile Applications
- Web / Browser
- POS / IoT Devices
Data Sources, Market Sizing, and Validation
Desk Research
Desk research is used to build the base layer of demand signals and policy context that shape fintech revenue in India, before any assumptions are added. We rely on non-paywalled, official sources such as Reserve Bank of India (RBI) payment system releases, National Payments Corporation of India (NPCI) ecosystem updates, SEBI publications, IRDAI annual reports, and Government of India digital economy notes (including MeitY releases) to anchor activity growth and the timing of regulatory changes.
Company annual reports, investor presentations, and audited financial statements are reviewed to understand revenue classifications, fee models, and channel mix, and then cross-checked against reputed press and association commentary to confirm shifts in monetization. In areas where disclosures are limited, paid company financials and intelligence subscription and a patent database are used selectively to confirm business lines and product direction. These examples are not exhaustive, and other public sources were also referred to for data collection, validation, and research clarification.
Primary Interviews and Surveys
Primary interviews and surveys are used to validate how activity converts into revenue, especially for take-rate ranges, fee pass-through, and pricing drift across large use cases like merchant acquiring, consumer credit, and digital distribution of savings and protection products. We speak with senior leaders, functional owners, and operating managers across platforms, regulated entities, and enabling partners, so the assumptions reflect different parts of the value chain and different customer cohorts across India.
Distribution of primary research fieldwork respondents
| Company type | Respondent position |
|---|---|
| Top tier: 33% | CXOs: 16% |
| Mid tier: 45% | Functional/Unit leaders: 39% |
| Smaller Players: 22% | Managers: 45% |
Market-Sizing & Forecasting
Market sizing uses a top-down and bottom-up approach, where system-level digital finance indicators are first used to reconstruct the demand pool and are then translated into revenue through realistic monetization. The top-down build is informed by measurable inputs such as digital transaction volumes and values, active user and merchant bases, digitally originated credit disbursal trends, and digital distribution flows for investment and insurance products, which are then converted using fee-rate and yield assumptions.
To keep totals practical, we corroborate the outputs with selective bottom-up approximations such as sampled player revenue splits, channel checks on common pricing, and blended fee per transaction or spread-based revenue logic where it is applicable. If a segment has limited disclosure, gaps are handled using peer benchmarks and regulatory-linked constraints, followed by confirmation with interview feedback before totals are finalized.
Forecasting is built using scenario analysis because fintech growth can shift with regulation, funding conditions, and credit risk appetite. Key forward drivers include RBI and NPCI activity trajectories, smartphone and internet penetration, merchant acceptance expansion, cost of funds movement, delinquency direction for digital credit, and expected changes in product pricing, and then the final scenario path is adjusted to match expert consensus from primary discussions.
Data Validation & Update Cycle
Validation is done through multiple cross-checks so the model does not drift away from real market signals, even when some inputs are estimated. Outputs are compared against independent metrics such as payment rail growth, credit and deposit direction, and publicly visible pricing changes, and then anomalies are reviewed at the assumption level before sign-off.
The report is refreshed annually, and interim updates are triggered when material events occur such as major regulatory circulars, large pricing resets, or clear breaks in transaction momentum. Before delivery, analysts run a fresh pass on key drivers and currency consistency so clients receive the latest updated view.
Mordor Intelligence's India Fintech Market Size Measured Against Other Published Estimates
Published India fintech numbers often diverge because different authors measure different things, and they also assume different monetization paths over time. The biggest gaps usually come from mixing transaction value pools, addressable opportunity, and service revenue into a single figure.
Some public estimates read like a sector-wide projection and can implicitly treat payments value or ecosystem scale as market size, which pushes totals up quickly as usage rises. The market size here is limited to service revenues from payments, digital lending, digital investments, insurtech distribution, and neobanking in India, and Mordor Intelligence also excludes generic IT services and pure back-office software that do not directly enable a customer financial product.
Benchmark comparison
| Source | Market Size | Gaps in Research Methodology |
|---|---|---|
| Mordor Intelligence | USD 51.30 B (2026) | |
| Industry Body Statement A | USD 420.00 B (2029) | Stated as a broad fintech industry projection with limited detail on whether the value represents revenue versus transaction value, and with limited visibility on fee-rate assumptions or segment inclusion rules. |
| Business Media Quote B | USD 990.45 B (2032) | Long-horizon projection with limited transparency on how revenue is derived, which can lead to mixing ecosystem opportunity with market size, and with unclear validation against observable rails, credit flows, and pricing signals. |
Taken together, the spread is mainly explained by scope and what is being counted, and not only by different growth expectations. A revenue-tied model that stays connected to observable activity pools and repeatable fee logic is easier to audit and update as conditions change.


Key Questions Answered in the Report
What is the India fintech market size in 2026, and how fast will it grow by 2031?
The India fintech market size is USD 51.30 billion in 2026 and is projected to reach USD 109.06 billion by 2031 at a 16.27% CAGR.
Which service propositions lead and which are growing fastest in the India fintech market?
Digital payments lead with a 42.87% share in 2025, while neobanking records the fastest projected growth at a 19.64% CAGR from 2026 to 2031.
How important are mobile applications in channel adoption for the India fintech market?
Mobile applications command a 67.83% share in 2025 and also hold the fastest growth trajectory at 18.39%, supported by UPI Lite, biometrics, and app-first onboarding.
What are the main regulatory levers shaping the economics in the India fintech market?
RBI's digital lending directions and payment aggregator master direction increase compliance baselines and net worth thresholds, which push monetization toward value-added services and sustainable origination models.
Where is geographic growth strongest within the India fintech market?
Growth originates in metro and tier-1 centres but accelerates in tier-2 and tier-3 districts due to UPI incentives and Aadhaar-enabled e-KYC, while offline devices extend merchant acceptance.
What differentiates leading competitors in the India fintech market today?
Leading platforms combine multi-bank UPI reliability, device-led merchant acceptance, and value-added services like corporate cards and buyer protection, while maintaining a strong compliance posture and cross-sell breadth.
Page last updated on:


 Your data is secure and never sold or shared.


