
| Study Period | 2017 - 2030 |
| Base Year For Estimation | 2024 |
| Forecast Data Period | 2025 - 2030 |
| Market Size (2025) | USD 45.89 Billion |
| Market Size (2030) | USD 62.83 Billion |
| CAGR (2025 - 2030) | 6.49 % |
| Market Concentration | Low |
Major Players*Disclaimer: Major Players sorted in no particular order |


India Fertilizers Market Analysis
The India Fertilizers Market size is estimated at 45.89 billion USD in 2025, and is expected to reach 62.83 billion USD by 2030, growing at a CAGR of 6.49% during the forecast period (2025-2030).
India's fertilizer industry overview reveals a significant transformation driven by technological innovation and sustainable agricultural practices. The sector has witnessed a notable shift toward precision farming techniques, with conventional fertilizers accounting for 94.7% of the total market value in 2022. This transition is further supported by the government's emphasis on digital farming solutions, including the integration of soil health monitoring systems and smart nutrient management applications. The industry's focus on sustainability has led to increased adoption of bio-enriched fertilizers and organic alternatives, particularly among progressive farmers seeking to reduce chemical inputs while maintaining productivity.
The structural composition of India's agricultural sector continues to influence fertilizer market trends, with small and marginal farmers comprising 44% of the farming population and operating on an average landholding of just 0.38 hectares. This fragmented landholding pattern has prompted fertilizer manufacturers to develop specialized products and packaging solutions tailored to small-scale farming operations. The industry has responded by introducing smaller pack sizes, improved delivery mechanisms, and enhanced distribution networks to better serve this crucial market segment. Additionally, manufacturers are investing in farmer education programs and digital platforms to promote optimal fertilizer usage practices.
The market is experiencing a notable shift in product formulations and application technologies. Primary macronutrient variants dominated the industry with a 57.6% market share in 2022, reflecting the continued importance of balanced crop nutrition. Manufacturers are increasingly focusing on developing enhanced efficiency fertilizers (EEFs) that offer improved nutrient absorption rates and reduced environmental impact. The fertilizer industry in India has also witnessed significant investments in research and development of nano-fertilizers and customized nutrient solutions designed for specific crop requirements and soil conditions.
The distribution landscape is evolving with the integration of e-commerce platforms and digital marketing channels. Leading fertilizer companies are partnering with agtech startups to develop innovative delivery models and improve last-mile connectivity. The sector has seen the emergence of integrated farming solutions that combine fertilizer products with advisory services and crop monitoring tools. These developments are complemented by the establishment of farmer producer organizations (FPOs) and cooperative societies that facilitate bulk purchasing and knowledge sharing among farming communities, creating a more efficient and responsive market ecosystem. This evolution underscores the growth of the fertilizer market and the dynamic nature of the fertilizer sector in India.
India Fertilizers Market Trends
The rising consumer demand domestically and internationally is the major driving factor for the rising acreage in India
- During the study period, the country witnessed a 6% increase in field crop cultivation. This surge in the cultivation of cereals, pulses, and oilseeds, driven by both domestic and international consumer demand, played a pivotal role in expanding the acreage.
- Breaking down the crops, rice, wheat, and soybean dominated the country's agricultural landscape in 2022, accounting for 25.4%, 17.4%, and 7.5%, respectively. Rice, a staple in India, commands a significant share, covering a quarter of the total cropped area and feeding nearly half the population. It finds cultivation across the nation, with key states being West Bengal, Uttar Pradesh, Andhra Pradesh, Punjab, and Tamil Nadu. However, India's rice production dipped by 6% (104.99 million tons) in the kharif season of 2022, primarily due to reduced paddy acreage in states like Jharkhand, Madhya Pradesh, and West Bengal, grappling with rainfall deficits.
- Punjab, West Bengal, Haryana, and Rajasthan emerge as the primary wheat cultivators in India. From 2017 to 2022, wheat cultivation in India witnessed a 5% increase. However, the wheat output dipped to 107.74 million tonnes in 2022 from the previous year's 109.59 million tonnes. This decline can be attributed to heavy rainfall and hailstorms that battered the fertile plains of northern, central, and western India. These natural calamities inflicted significant damage on the maturing winter-planted crops, including wheat, leading to substantial losses for farmers.
- Given the robust cereal cultivation in India, bolstered by surging domestic and international demand, the Indian fertilizer market is poised for growth during 2023-2030.

Understand The Key Trends Shaping This Market
Download PDF
Among the primary nutrients, nitrogen is the most-applied nutrient in field crops, with an average application rate of 223.5 kg per hectare
- In 2021, the average application rate for primary nutrients stood at 125.1 kg/ha. Notably, nitrogen topped the list with an average application rate of 223.5 kg/ha. Given the intensive cultivation of crops like rice in the country, it is no surprise that nitrogen, being a crucial nutrient, plays a pivotal role. However, the deficiency of this nutrient in the soil is hampering rice productivity nationwide.
- The soil health in India, as highlighted in the State of Biofertilizers and Organic Fertilizers report, is a cause for concern. It reveals a rising trend in the consumption of chemical fertilizers, with 97.0%, 83.0%, and 71.0% of tested soils showing deficiencies in nitrogen, phosphorous, and potassium, respectively.
- Among the major crops, wheat, rice, and corn/maize led the pack in nutrient application rates in 2021, with averages of 231, 156, and 149 kg/ha, respectively. Wheat and rice, being staple foods both domestically and globally, face significant yield and profit reductions due to multiple nutrient deficiencies. Apart from nitrogen, phosphorous, and potassium, these crops also rely on micronutrients like sulfur, boron, iron, and zinc for optimal growth. Given the critical role of nutrient management in successful crop production, the market is witnessing growth.
- Field crops, especially grains and cereals, have a voracious appetite for primary nutrients, particularly nitrogen fertilizers. With the extensive cultivation of these crops depleting the soil's nutrient content, the demand for fertilizers is expected to surge during 2023-2030, driving market growth.

OTHER KEY INDUSTRY TRENDS COVERED IN THE REPORT
- The area under horticulture is steadily increasing over the years due to the increasing demand for fruits and vegetables.
- In 2022, manganese and copper are the highly applied nutrients in India owing to their widespread deficiencies in soil
- Due to its critical function in the development of plant tissues and its contribution to overall plant growth, calcium is the secondary macronutrient that receives the highest application
- More than half of India’s cultivated land has access to assured irrigation
- Widespread micronutrient deficiency in the soils of India is leading to reduced crop yield
- Of the primary nutrients, nitrogen is used in larger amounts to aid in rapid vegetative growth and the production of fruits
- Vegetable crops predominantly rely on calcium and magnesium as their primary secondary macronutrients, with application rates peaking at 33 kg/ha and 31 kg/ha, respectively
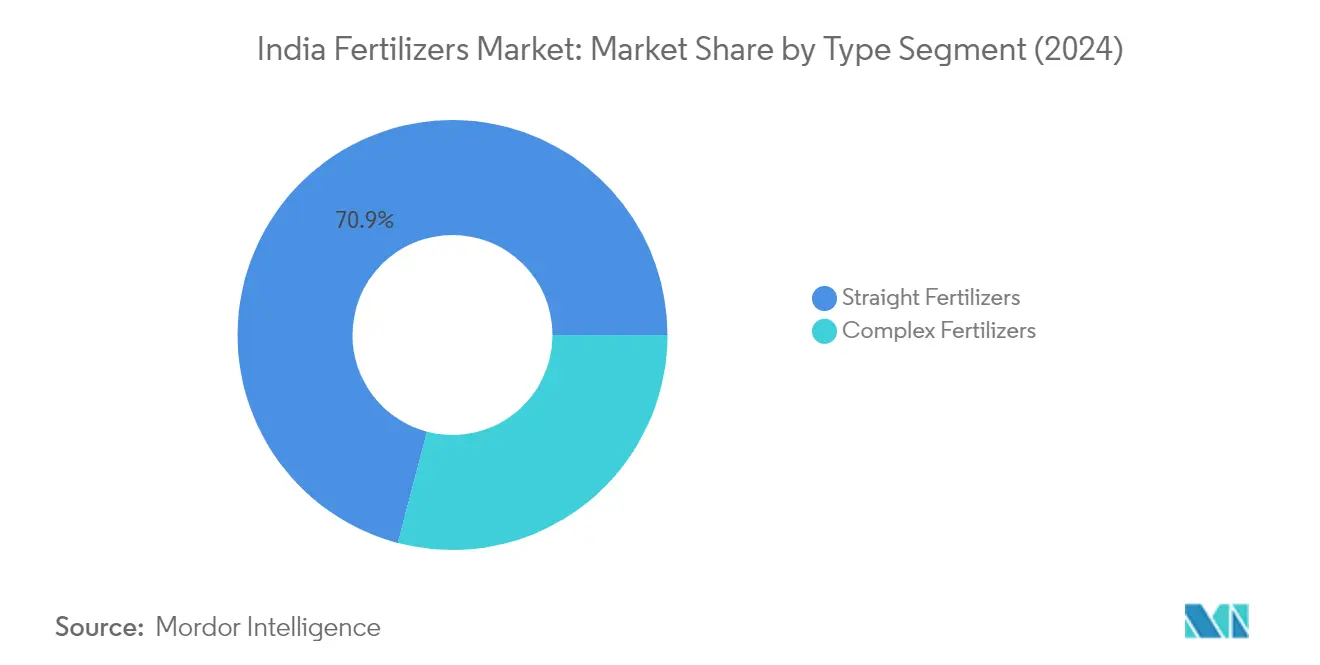
Segment Analysis: Type
Straight Fertilizers Segment in India Fertilizers Market
Straight fertilizers continue to dominate the Indian fertilizers market, commanding approximately 71% market share in 2024. This segment's prominence is primarily driven by nitrogenous fertilizers, particularly urea, which accounts for about 45% of the straight fertilizer market value. The dominance of straight fertilizers can be attributed to their lower costs, widespread availability, and substantial government subsidies that make them more accessible to small and marginal farmers. Additionally, the segment benefits from an established distribution network and farmers' familiarity with application methods. The segment's strength is further reinforced by the government's focus on ensuring food security through sustained agricultural productivity, leading to continued support through various subsidy schemes and distribution programs.
Complex Fertilizers Segment in India Fertilizers Market
The complex fertilizers market is experiencing robust growth in the Indian market, projected to grow at approximately 6% through 2024-2029. This growth is primarily driven by increasing awareness among farmers about the benefits of balanced crop nutrition and the advantages of having multiple nutrients in a single granule. The segment's expansion is supported by technological advancements in manufacturing processes, leading to more efficient nutrient combinations and improved absorption rates. Types of complex fertilizers are gaining particular traction in regions with intensive farming practices and among farmers growing high-value crops. The segment's growth is further bolstered by the rising adoption of precision farming techniques and the increasing focus on improving crop quality alongside yield improvements.
Segment Analysis: Form
Conventional Segment in India Fertilizers Market
Conventional fertilizers continue to dominate the Indian fertilizer market, commanding approximately 97% market share in 2024. This dominance is primarily attributed to their cost-effectiveness and widespread availability across the country. Small and marginal farmers, who constitute about 44% of India's farming population with average landholdings of 0.38 hectares, predominantly opt for conventional fertilizers due to their affordability and government subsidy support. Primary macronutrient variants, particularly nitrogenous fertilizers, represent the largest portion within conventional fertilizers, accounting for nearly 58% of this segment. The segment's strong position is further reinforced by established distribution networks and farmers' familiarity with traditional application methods, making it the preferred choice for most agricultural operations across India.
Controlled Release Fertilizers (CRF) Segment in India Fertilizers Market
The Controlled Release Fertilizers (CRF) segment is emerging as the most dynamic growth sector in India's fertilizer market, with projections indicating robust expansion through 2024-2029. This growth is primarily driven by increasing awareness among farmers about the benefits of extended nutrient release periods, ranging from 3 to 15 months, particularly beneficial for major crops like wheat, rice, and maize. The segment's expansion is further supported by government initiatives promoting innovative fertilizer technologies and growing environmental concerns regarding nutrient leaching. Field crops, occupying 90% of cultivated area, represent the primary application area for CRF, with controlled-release urea emerging as the preferred variant due to its superior nitrogen utilization efficiency and reduced losses compared to conventional alternatives.
Remaining Segments in Form Segmentation
The other specialty fertilizer segments, including liquid fertilizers, slow-release fertilizers (SRF), and water-soluble fertilizers, each play distinct roles in India's evolving agricultural landscape. Liquid fertilizers are gaining traction due to their compatibility with modern irrigation systems and precision farming techniques. Water-soluble fertilizers are particularly valuable in greenhouse cultivation and high-value crop production, offering superior nutrient absorption rates. Meanwhile, slow-release fertilizers are finding increased adoption in sustainable farming practices, particularly in regions focusing on environmental conservation. These segments collectively contribute to the market's diversification, offering farmers specialized solutions for different crop requirements and cultivation conditions.
Segment Analysis: Application Mode
Soil Application Segment in India Fertilizers Market
Soil application continues to dominate the Indian fertilizers market, commanding approximately 86% of the total market share in 2024. This dominance can be attributed to several factors, including the method's widespread accessibility, cost-effectiveness, and simplicity of application. Broadcasting, placement, and localized placements are the primary techniques employed in soil application. The segment's strength is further reinforced by the extensive agricultural land base in India, which expanded from 196 million hectares to 202 million hectares, indicating increased agricultural activity. Field crops hold the majority share at nearly 95%, followed by horticulture crops at around 11%, demonstrating the method's versatility across different crop types. Additionally, when compared to other application methods, soil application of nitrogen has shown the highest consumption, reaching approximately 43 million metric tonnes, highlighting its crucial role in meeting plants' nutritional requirements.
Fertigation Segment in India Fertilizers Market
The fertigation fertilizer market is emerging as the fastest-growing application method in the Indian fertilizers market, driven by its superior efficiency in delivering plant nutrients through irrigation systems. This method has gained significant traction due to its ability to reduce both fertilizer and water usage while simultaneously curbing soil erosion. Specialty fertilizers, particularly water-soluble and liquid variants, are increasingly preferred in sprinkler and drip systems, as they leverage irrigation to distribute fertilizer solutions evenly. The segment's growth is further propelled by the expanding irrigation infrastructure across India and the rising adoption of specialty fertilizers. The method's popularity is particularly evident in regions with advanced irrigation systems, where farmers are increasingly recognizing its benefits in terms of improved nutrient absorption and reduced waste. The precision offered by fertigation in delivering nutrients directly to the root zone has made it especially attractive for high-value crops and intensive farming systems.
Remaining Segments in Application Mode
Foliar application represents another significant segment in the Indian fertilizers market, primarily utilized for secondary macronutrients and micronutrients. This method involves spraying fertilizers directly onto plant leaves, making it particularly effective when plant roots are not functioning optimally. The technique has gained prominence among farmers due to its ability to address immediate nutrient deficiencies and provide rapid plant response. Foliar application is especially valuable during critical growth stages when quick nutrient absorption is essential. The method's effectiveness in delivering micronutrients and its role in supplementing soil-based nutrition has made it an integral part of modern farming practices, particularly in intensive cultivation systems where optimal nutrient management is crucial for maximizing yields.
Segment Analysis: Crop Type
India Fertilizers Industry Overview
Top Companies in India Fertilizers Market
The Indian fertilizer market is characterized by robust product innovation and strategic expansion initiatives among key players. Companies are increasingly focusing on developing specialty fertilizers, including controlled-release and water-soluble variants, to meet evolving agricultural needs. Operational agility is demonstrated through the establishment of extensive distribution networks and dealer relationships across rural India. Strategic moves in the sector primarily revolve around partnerships with agricultural technology providers and investments in digital platforms for farmer engagement. Market leaders are expanding their presence through acquisitions and joint ventures, particularly in high-growth regional markets. The industry also witnesses significant investment in research and development, especially in areas of nano-fertilizers and bio-fertilizers, showcasing a commitment to sustainable agricultural practices. Leading fertilizer companies in India are at the forefront of these innovations, driving the market forward.
Mixed Market with Strong Domestic Players
The Indian fertilizer market exhibits a unique blend of public sector undertakings, private companies, and cooperative societies, creating a diverse competitive landscape. State-owned enterprises maintain a significant presence, particularly in urea production and distribution, while private players dominate the specialty fertilizer segment. The market structure is characterized by moderate consolidation, with established domestic players like National Fertilizers Ltd and Coromandel International holding substantial market shares. These companies leverage their deep understanding of local agricultural conditions and established distribution networks to maintain their competitive positions. The market share of fertilizer companies in India is influenced by these dynamics.
The industry witnesses strategic collaborations between domestic and international players, particularly in technology transfer and product development. Mergers and acquisitions activity is primarily focused on vertical integration and geographic expansion within the country. Local players are increasingly partnering with global companies to enhance their product portfolio and technical capabilities, while international companies seek to establish stronger footholds in the Indian market through joint ventures with established domestic players. This dynamic creates a balanced competitive environment where both local expertise and global technology play crucial roles.
Innovation and Distribution Drive Market Success
Success in the Indian fertilizer market increasingly depends on companies' ability to innovate while maintaining cost competitiveness. Market leaders are investing in advanced manufacturing technologies and developing customized products for different agro-climatic zones. The ability to maintain an efficient supply chain and extensive distribution network, particularly in rural areas, remains crucial for market success. Companies are also focusing on developing direct farmer relationships through digital platforms and agricultural advisory services, creating stronger brand loyalty and market presence. The fertilizer market share is heavily influenced by these strategic initiatives.
Future market success will require companies to navigate regulatory changes, particularly regarding subsidy mechanisms and environmental compliance. Players must balance product innovation with affordability, given the price-sensitive nature of the Indian agricultural sector. The development of sustainable and environmentally friendly products, coupled with effective farmer education programs, will be crucial for long-term success. Companies entering the market need to establish strong local partnerships and develop region-specific strategies to overcome entry barriers and gain market share. The ability to provide comprehensive crop nutrition solutions, rather than standalone products, will become increasingly important for maintaining competitive advantage. The competition in the fertilizer market is expected to intensify as more players adopt these strategies.
India Fertilizers Market Leaders
-
Chambal Fertilizers & Chemicals Ltd
-
Coromandel International Ltd.
-
ICL Group Ltd
-
Indian Farmers Fertiliser Cooperative Limited
-
National Fertilizers Ltd
- *Disclaimer: Major Players sorted in no particular order

Need More Details on Market Players and Competiters?
Download PDF
India Fertilizers Market News
- January 2023: ICL has entered into a strategic partnership agreement with General Mills, in which it will be the supplier of strategic specialty phosphate solutions to General Mills. The long-term agreement will also focus on international expansion.
- May 2022: ICL launched three new NPK formulations of Solinure, a product with increased trace elements to optimize yields.
- May 2022: ICL signed an agreement with customers in India and China to supply 600,000 and 700,000 metric tons of potash, respectively, in 2022 at USD 590 per ton.
Free With This Report
Along with the report, We also offer a comprehensive and exhaustive data pack with 25+ graphs on area under cultivation and average application rate per hectare. The data pack includes Globe, North America, Europe, Asia-Pacific, South America, and Africa.


India Fertilizers Market Report - Table of Contents
1. EXECUTIVE SUMMARY & KEY FINDINGS
2. REPORT OFFERS
3. INTRODUCTION
- 3.1 Study Assumptions & Market Definition
- 3.2 Scope of the Study
- 3.3 Research Methodology
4. KEY INDUSTRY TRENDS
-
4.1 Acreage Of Major Crop Types
- 4.1.1 Field Crops
- 4.1.2 Horticultural Crops
-
4.2 Average Nutrient Application Rates
- 4.2.1 Micronutrients
- 4.2.1.1 Field Crops
- 4.2.1.2 Horticultural Crops
- 4.2.2 Primary Nutrients
- 4.2.2.1 Field Crops
- 4.2.2.2 Horticultural Crops
- 4.2.3 Secondary Macronutrients
- 4.2.3.1 Field Crops
- 4.2.3.2 Horticultural Crops
- 4.3 Agricultural Land Equipped For Irrigation
- 4.4 Regulatory Framework
- 4.5 Value Chain & Distribution Channel Analysis
5. MARKET SEGMENTATION (includes market size in Value in USD and Volume, Forecasts up to 2030 and analysis of growth prospects)
-
5.1 Type
- 5.1.1 Complex
- 5.1.2 Straight
- 5.1.2.1 Micronutrients
- 5.1.2.1.1 Boron
- 5.1.2.1.2 Copper
- 5.1.2.1.3 Iron
- 5.1.2.1.4 Manganese
- 5.1.2.1.5 Molybdenum
- 5.1.2.1.6 Zinc
- 5.1.2.1.7 Others
- 5.1.2.2 Nitrogenous
- 5.1.2.2.1 Urea
- 5.1.2.2.2 Others
- 5.1.2.3 Phosphatic
- 5.1.2.3.1 DAP
- 5.1.2.3.2 MAP
- 5.1.2.3.3 SSP
- 5.1.2.3.4 Others
- 5.1.2.4 Potassic
- 5.1.2.4.1 MoP
- 5.1.2.5 Secondary Macronutrients
- 5.1.2.5.1 Calcium
- 5.1.2.5.2 Magnesium
- 5.1.2.5.3 Sulfur
-
5.2 Form
- 5.2.1 Conventional
- 5.2.2 Speciality
- 5.2.2.1 CRF
- 5.2.2.2 Liquid Fertilizer
- 5.2.2.3 SRF
- 5.2.2.4 Water Soluble
-
5.3 Application Mode
- 5.3.1 Fertigation
- 5.3.2 Foliar
- 5.3.3 Soil
-
5.4 Crop Type
- 5.4.1 Field Crops
- 5.4.2 Horticultural Crops
- 5.4.3 Turf & Ornamental
6. COMPETITIVE LANDSCAPE
- 6.1 Key Strategic Moves
- 6.2 Market Share Analysis
- 6.3 Company Landscape
-
6.4 Company Profiles
- 6.4.1 Chambal Fertilizers & Chemicals Ltd
- 6.4.2 Coromandel International Ltd.
- 6.4.3 Gujarat Narmada Valley Fertilizers & Chemicals Ltd
- 6.4.4 Haifa Group
- 6.4.5 ICL Group Ltd
- 6.4.6 Indian Farmers Fertiliser Cooperative Limited
- 6.4.7 National Fertilizers Ltd
- 6.4.8 Rashtriya Chemicals & Fertilizers Ltd
- 6.4.9 Sociedad Quimica y Minera de Chile SA
- 6.4.10 Yara International ASA
- *List Not Exhaustive
7. KEY STRATEGIC QUESTIONS FOR FERTILIZER CEOS
8. APPENDIX
-
8.1 Global Overview
- 8.1.1 Overview
- 8.1.2 Porter’s Five Forces Framework
- 8.1.3 Global Value Chain Analysis
- 8.1.4 Market Dynamics (DROs)
- 8.2 Sources & References
- 8.3 List of Tables & Figures
- 8.4 Primary Insights
- 8.5 Data Pack
- 8.6 Glossary of Terms
You Can Purchase Parts Of This Report. Check Out Prices For Specific Sections
Get Price Break-up Now
List of Tables & Figures
- Figure 1:
- CULTIVATION OF FIELD CROPS IN HECTARE, INDIA, 2017 - 2022
- Figure 2:
- CULTIVATION OF HORTICULTURAL CROPS IN HECTARE, INDIA, 2017 - 2022
- Figure 3:
- CONSUMPTION OF MICRONUTRIENTS BY FIELD CROPS IN KG/HECTARE, INDIA, 2022
- Figure 4:
- CONSUMPTION OF MICRONUTRIENTS BY HORTICULTURAL CROPS IN KG/HECTARE, INDIA, 2022
- Figure 5:
- CONSUMPTION OF PRIMARY NUTRIENTS BY FIELD CROPS IN KG/HECTARE, INDIA, 2022
- Figure 6:
- CONSUMPTION OF PRIMARY NUTRIENTS BY HORTICULTURAL CROPS IN KG/HECTARE, INDIA, 2022
- Figure 7:
- CONSUMPTION OF SECONDARY MACRONUTRIENTS BY FIELD CROPS IN KG/HECTARE, INDIA, 2022
- Figure 8:
- CONSUMPTION OF SECONDARY MACRONUTRIENTS BY HORTICULTURAL CROPS IN KG/HECTARE, INDIA, 2022
- Figure 9:
- AGRICULTURAL LAND EQUIPPED FOR IRRIGATION IN HECTARE, INDIA, 2022
- Figure 10:
- FERTILIZER FERTILIZER CONSUMPTION IN METRIC TON, INDIA, 2017 - 2030
- Figure 11:
- FERTILIZER FERTILIZER CONSUMPTION IN USD, INDIA, 2017 - 2030
- Figure 12:
- FERTILIZER CONSUMPTION BY TYPE IN METRIC TON, INDIA, 2017 - 2030
- Figure 13:
- FERTILIZER CONSUMPTION BY TYPE IN USD, INDIA, 2017 - 2030
- Figure 14:
- FERTILIZER CONSUMPTION VOLUME BY TYPE IN %, INDIA, 2017 VS 2023 VS 2030
- Figure 15:
- FERTILIZER CONSUMPTION VALUE BY TYPE IN %, INDIA, 2017 VS 2023 VS 2030
- Figure 16:
- FERTILIZER CONSUMPTION IN METRIC TON, INDIA, 2017 - 2030
- Figure 17:
- FERTILIZER CONSUMPTION IN USD, INDIA, 2017 - 2030
- Figure 18:
- FERTILIZER CONSUMPTION VALUE BY CROP TYPE IN %, INDIA, 2023 VS 2030
- Figure 19:
- STRAIGHT FERTILIZER CONSUMPTION BY NUTRIENT IN METRIC TON, INDIA, 2017 - 2030
- Figure 20:
- STRAIGHT FERTILIZER CONSUMPTION BY NUTRIENT IN USD, INDIA, 2017 - 2030
- Figure 21:
- STRAIGHT FERTILIZER CONSUMPTION VOLUME BY NUTRIENT IN %, INDIA, 2017 VS 2023 VS 2030
- Figure 22:
- STRAIGHT FERTILIZER CONSUMPTION VALUE BY NUTRIENT IN %, INDIA, 2017 VS 2023 VS 2030
- Figure 23:
- MICRONUTRIENTS FERTILIZER CONSUMPTION BY PRODUCT IN METRIC TON, INDIA, 2017 - 2030
- Figure 24:
- MICRONUTRIENTS FERTILIZER CONSUMPTION BY PRODUCT IN USD, INDIA, 2017 - 2030
- Figure 25:
- MICRONUTRIENTS FERTILIZER CONSUMPTION VOLUME BY PRODUCT IN %, INDIA, 2017 VS 2023 VS 2030
- Figure 26:
- MICRONUTRIENTS FERTILIZER CONSUMPTION VALUE BY PRODUCT IN %, INDIA, 2017 VS 2023 VS 2030
- Figure 27:
- BORON FERTILIZER CONSUMPTION IN METRIC TON, INDIA, 2017 - 2030
- Figure 28:
- BORON FERTILIZER CONSUMPTION IN USD, INDIA, 2017 - 2030
- Figure 29:
- BORON FERTILIZER CONSUMPTION VALUE BY CROP TYPE IN %, INDIA, 2023 VS 2030
- Figure 30:
- COPPER FERTILIZER CONSUMPTION IN METRIC TON, INDIA, 2017 - 2030
- Figure 31:
- COPPER FERTILIZER CONSUMPTION IN USD, INDIA, 2017 - 2030
- Figure 32:
- COPPER FERTILIZER CONSUMPTION VALUE BY CROP TYPE IN %, INDIA, 2023 VS 2030
- Figure 33:
- IRON FERTILIZER CONSUMPTION IN METRIC TON, INDIA, 2017 - 2030
- Figure 34:
- IRON FERTILIZER CONSUMPTION IN USD, INDIA, 2017 - 2030
- Figure 35:
- IRON FERTILIZER CONSUMPTION VALUE BY CROP TYPE IN %, INDIA, 2023 VS 2030
- Figure 36:
- MANGANESE FERTILIZER CONSUMPTION IN METRIC TON, INDIA, 2017 - 2030
- Figure 37:
- MANGANESE FERTILIZER CONSUMPTION IN USD, INDIA, 2017 - 2030
- Figure 38:
- MANGANESE FERTILIZER CONSUMPTION VALUE BY CROP TYPE IN %, INDIA, 2023 VS 2030
- Figure 39:
- MOLYBDENUM FERTILIZER CONSUMPTION IN METRIC TON, INDIA, 2017 - 2030
- Figure 40:
- MOLYBDENUM FERTILIZER CONSUMPTION IN USD, INDIA, 2017 - 2030
- Figure 41:
- MOLYBDENUM FERTILIZER CONSUMPTION VALUE BY CROP TYPE IN %, INDIA, 2023 VS 2030
- Figure 42:
- ZINC FERTILIZER CONSUMPTION IN METRIC TON, INDIA, 2017 - 2030
- Figure 43:
- ZINC FERTILIZER CONSUMPTION IN USD, INDIA, 2017 - 2030
- Figure 44:
- ZINC FERTILIZER CONSUMPTION VALUE BY CROP TYPE IN %, INDIA, 2023 VS 2030
- Figure 45:
- OTHERS FERTILIZER CONSUMPTION IN METRIC TON, INDIA, 2017 - 2030
- Figure 46:
- OTHERS FERTILIZER CONSUMPTION IN USD, INDIA, 2017 - 2030
- Figure 47:
- OTHERS FERTILIZER CONSUMPTION VALUE BY CROP TYPE IN %, INDIA, 2023 VS 2030
- Figure 48:
- NITROGENOUS FERTILIZER CONSUMPTION BY PRODUCT IN METRIC TON, INDIA, 2017 - 2030
- Figure 49:
- NITROGENOUS FERTILIZER CONSUMPTION BY PRODUCT IN USD, INDIA, 2017 - 2030
- Figure 50:
- NITROGENOUS FERTILIZER CONSUMPTION VOLUME BY PRODUCT IN %, INDIA, 2017 VS 2023 VS 2030
- Figure 51:
- NITROGENOUS FERTILIZER CONSUMPTION VALUE BY PRODUCT IN %, INDIA, 2017 VS 2023 VS 2030
- Figure 52:
- UREA UREA FERTILIZER CONSUMPTION IN METRIC TON, INDIA, 2017 - 2030
- Figure 53:
- UREA UREA FERTILIZER CONSUMPTION IN USD, INDIA, 2017 - 2030
- Figure 54:
- UREA FERTILIZER CONSUMPTION VALUE BY CROP TYPE IN USD, INDIA, 2017 - 2030
- Figure 55:
- OTHERS FERTILIZER CONSUMPTION IN METRIC TON, INDIA, 2017 - 2030
- Figure 56:
- OTHERS FERTILIZER CONSUMPTION IN USD, INDIA, 2017 - 2030
- Figure 57:
- OTHERS FERTILIZER CONSUMPTION VALUE BY CROP TYPE IN %, INDIA, 2023 VS 2030
- Figure 58:
- PHOSPHATIC FERTILIZER CONSUMPTION BY PRODUCT IN METRIC TON, INDIA, 2017 - 2030
- Figure 59:
- PHOSPHATIC FERTILIZER CONSUMPTION BY PRODUCT IN USD, INDIA, 2017 - 2030
- Figure 60:
- PHOSPHATIC FERTILIZER CONSUMPTION VOLUME BY PRODUCT IN %, INDIA, 2017 VS 2023 VS 2030
- Figure 61:
- PHOSPHATIC FERTILIZER CONSUMPTION VALUE BY PRODUCT IN %, INDIA, 2017 VS 2023 VS 2030
- Figure 62:
- DAP FERTILIZER CONSUMPTION IN METRIC TON, INDIA, 2017 - 2030
- Figure 63:
- DAP FERTILIZER CONSUMPTION IN USD, INDIA, 2017 - 2030
- Figure 64:
- DAP FERTILIZER CONSUMPTION VALUE BY CROP TYPE IN %, INDIA, 2023 VS 2030
- Figure 65:
- MAP FERTILIZER CONSUMPTION IN METRIC TON, INDIA, 2017 - 2030
- Figure 66:
- MAP FERTILIZER CONSUMPTION IN USD, INDIA, 2017 - 2030
- Figure 67:
- MAP FERTILIZER CONSUMPTION VALUE BY CROP TYPE IN %, INDIA, 2023 VS 2030
- Figure 68:
- SSP FERTILIZER CONSUMPTION IN METRIC TON, INDIA, 2017 - 2030
- Figure 69:
- SSP FERTILIZER CONSUMPTION IN USD, INDIA, 2017 - 2030
- Figure 70:
- SSP FERTILIZER CONSUMPTION VALUE BY CROP TYPE IN %, INDIA, 2023 VS 2030
- Figure 71:
- OTHERS FERTILIZER CONSUMPTION IN METRIC TON, INDIA, 2017 - 2030
- Figure 72:
- OTHERS FERTILIZER CONSUMPTION IN USD, INDIA, 2017 - 2030
- Figure 73:
- OTHERS FERTILIZER CONSUMPTION VALUE BY CROP TYPE IN %, INDIA, 2023 VS 2030
- Figure 74:
- POTASSIC FERTILIZER CONSUMPTION BY PRODUCT IN METRIC TON, INDIA, 2017 - 2030
- Figure 75:
- POTASSIC FERTILIZER CONSUMPTION BY PRODUCT IN USD, INDIA, 2017 - 2030
- Figure 76:
- POTASSIC FERTILIZER CONSUMPTION VOLUME BY PRODUCT IN %, INDIA, 2017 VS 2023 VS 2030
- Figure 77:
- POTASSIC FERTILIZER CONSUMPTION VALUE BY PRODUCT IN %, INDIA, 2017 VS 2023 VS 2030
- Figure 78:
- MOP FERTILIZER CONSUMPTION IN METRIC TON, INDIA, 2017 - 2030
- Figure 79:
- MOP FERTILIZER CONSUMPTION IN USD, INDIA, 2017 - 2030
- Figure 80:
- MOP FERTILIZER CONSUMPTION VALUE BY CROP TYPE IN %, INDIA, 2023 VS 2030
- Figure 81:
- SECONDARY MACRONUTRIENTS FERTILIZER CONSUMPTION BY PRODUCT IN METRIC TON, INDIA, 2017 - 2030
- Figure 82:
- SECONDARY MACRONUTRIENTS FERTILIZER CONSUMPTION BY PRODUCT IN USD, INDIA, 2017 - 2030
- Figure 83:
- SECONDARY MACRONUTRIENTS FERTILIZER CONSUMPTION VOLUME BY PRODUCT IN %, INDIA, 2017 VS 2023 VS 2030
- Figure 84:
- SECONDARY MACRONUTRIENTS FERTILIZER CONSUMPTION VALUE BY PRODUCT IN %, INDIA, 2017 VS 2023 VS 2030
- Figure 85:
- CALCIUM FERTILIZER CONSUMPTION IN METRIC TON, INDIA, 2017 - 2030
- Figure 86:
- CALCIUM FERTILIZER CONSUMPTION IN USD, INDIA, 2017 - 2030
- Figure 87:
- CALCIUM FERTILIZER CONSUMPTION VALUE BY CROP TYPE IN %, INDIA, 2023 VS 2030
- Figure 88:
- MAGNESIUM FERTILIZER CONSUMPTION IN METRIC TON, INDIA, 2017 - 2030
- Figure 89:
- MAGNESIUM FERTILIZER CONSUMPTION IN USD, INDIA, 2017 - 2030
- Figure 90:
- MAGNESIUM FERTILIZER CONSUMPTION VALUE BY CROP TYPE IN %, INDIA, 2023 VS 2030
- Figure 91:
- SULFUR FERTILIZER CONSUMPTION IN METRIC TON, INDIA, 2017 - 2030
- Figure 92:
- SULFUR FERTILIZER CONSUMPTION IN USD, INDIA, 2017 - 2030
- Figure 93:
- SULFUR FERTILIZER CONSUMPTION VALUE BY CROP TYPE IN %, INDIA, 2023 VS 2030
- Figure 94:
- FERTILIZER CONSUMPTION BY FORM IN METRIC TON, INDIA, 2017 - 2030
- Figure 95:
- FERTILIZER CONSUMPTION BY FORM IN USD, INDIA, 2017 - 2030
- Figure 96:
- FERTILIZER CONSUMPTION VOLUME BY FORM IN %, INDIA, 2017 VS 2023 VS 2030
- Figure 97:
- FERTILIZER CONSUMPTION VALUE BY FORM IN %, INDIA, 2017 VS 2023 VS 2030
- Figure 98:
- FERTILIZER CONSUMPTION IN METRIC TON, INDIA, 2017 - 2030
- Figure 99:
- FERTILIZER CONSUMPTION IN USD, INDIA, 2017 - 2030
- Figure 100:
- FERTILIZER CONSUMPTION VALUE BY CROP TYPE IN %, INDIA, 2023 VS 2030
- Figure 101:
- FERTILIZER CONSUMPTION BY SPECIALITY TYPE IN METRIC TON, INDIA, 2017 - 2030
- Figure 102:
- FERTILIZER CONSUMPTION BY SPECIALITY TYPE IN USD, INDIA, 2017 - 2030
- Figure 103:
- FERTILIZER CONSUMPTION VOLUME BY SPECIALITY TYPE IN %, INDIA, 2017 VS 2023 VS 2030
- Figure 104:
- FERTILIZER CONSUMPTION VALUE BY SPECIALITY TYPE IN %, INDIA, 2017 VS 2023 VS 2030
- Figure 105:
- CRF FERTILIZER CONSUMPTION IN METRIC TON, INDIA, 2017 - 2030
- Figure 106:
- CRF FERTILIZER CONSUMPTION IN USD, INDIA, 2017 - 2030
- Figure 107:
- CRF FERTILIZER CONSUMPTION VALUE BY CROP TYPE IN %, INDIA, 2023 VS 2030
- Figure 108:
- LIQUID FERTILIZER CONSUMPTION IN METRIC TON, INDIA, 2017 - 2030
- Figure 109:
- LIQUID FERTILIZER CONSUMPTION IN USD, INDIA, 2017 - 2030
- Figure 110:
- LIQUID FERTILIZER CONSUMPTION VALUE BY CROP TYPE IN %, INDIA, 2023 VS 2030
- Figure 111:
- SRF FERTILIZER CONSUMPTION IN METRIC TON, INDIA, 2017 - 2030
- Figure 112:
- SRF FERTILIZER CONSUMPTION IN USD, INDIA, 2017 - 2030
- Figure 113:
- SRF FERTILIZER CONSUMPTION VALUE BY CROP TYPE IN %, INDIA, 2023 VS 2030
- Figure 114:
- WATER SOLUBLE FERTILIZER CONSUMPTION IN METRIC TON, INDIA, 2017 - 2030
- Figure 115:
- WATER SOLUBLE FERTILIZER CONSUMPTION IN USD, INDIA, 2017 - 2030
- Figure 116:
- WATER SOLUBLE FERTILIZER CONSUMPTION VALUE BY CROP TYPE IN %, INDIA, 2023 VS 2030
- Figure 117:
- FERTILIZER CONSUMPTION BY APPLICATION MODE IN METRIC TON, INDIA, 2017 - 2030
- Figure 118:
- FERTILIZER CONSUMPTION BY APPLICATION MODE IN USD, INDIA, 2017 - 2030
- Figure 119:
- FERTILIZER CONSUMPTION VOLUME BY APPLICATION MODE IN %, INDIA, 2017 VS 2023 VS 2030
- Figure 120:
- FERTILIZER CONSUMPTION VALUE BY APPLICATION MODE IN %, INDIA, 2017 VS 2023 VS 2030
- Figure 121:
- FERTIGATION APPLICATION OF FERTILIZER IN METRIC TON, INDIA, 2017 - 2030
- Figure 122:
- FERTIGATION APPLICATION OF FERTILIZER IN USD, INDIA, 2017 - 2030
- Figure 123:
- FERTIGATION APPLICATION OF FERTILIZER IN VALUE BY CROP TYPE IN %, INDIA, 2023 VS 2030
- Figure 124:
- FOLIAR APPLICATION OF FERTILIZER IN METRIC TON, INDIA, 2017 - 2030
- Figure 125:
- FOLIAR APPLICATION OF FERTILIZER IN USD, INDIA, 2017 - 2030
- Figure 126:
- FOLIAR APPLICATION OF FERTILIZER IN VALUE BY CROP TYPE IN %, INDIA, 2023 VS 2030
- Figure 127:
- SOIL APPLICATION OF FERTILIZER IN METRIC TON, INDIA, 2017 - 2030
- Figure 128:
- SOIL APPLICATION OF FERTILIZER IN USD, INDIA, 2017 - 2030
- Figure 129:
- SOIL APPLICATION OF FERTILIZER IN VALUE BY CROP TYPE IN %, INDIA, 2023 VS 2030
- Figure 130:
- FERTILIZER CONSUMPTION BY CROP TYPE IN METRIC TON, INDIA, 2017 - 2030
- Figure 131:
- FERTILIZER CONSUMPTION BY CROP TYPE IN USD, INDIA, 2017 - 2030
- Figure 132:
- FERTILIZER CONSUMPTION VOLUME BY CROP TYPE IN %, INDIA, 2017 VS 2023 VS 2030
- Figure 133:
- FERTILIZER CONSUMPTION VALUE BY CROP TYPE IN %, INDIA, 2017 VS 2023 VS 2030
- Figure 134:
- FERTILIZER CONSUMPTION BY FIELD CROPS IN METRIC TON, INDIA, 2017 - 2030
- Figure 135:
- FERTILIZER CONSUMPTION BY FIELD CROPS IN USD, INDIA, 2017 - 2030
- Figure 136:
- FERTILIZER CONSUMPTION VALUE BY TYPE IN %, INDIA, 2023 VS 2030
- Figure 137:
- FERTILIZER CONSUMPTION BY HORTICULTURAL CROPS IN METRIC TON, INDIA, 2017 - 2030
- Figure 138:
- FERTILIZER CONSUMPTION BY HORTICULTURAL CROPS IN USD, INDIA, 2017 - 2030
- Figure 139:
- FERTILIZER CONSUMPTION VALUE BY TYPE IN %, INDIA, 2023 VS 2030
- Figure 140:
- FERTILIZER CONSUMPTION BY TURF & ORNAMENTAL IN METRIC TON, INDIA, 2017 - 2030
- Figure 141:
- FERTILIZER CONSUMPTION BY TURF & ORNAMENTAL IN USD, INDIA, 2017 - 2030
- Figure 142:
- FERTILIZER CONSUMPTION VALUE BY TYPE IN %, INDIA, 2023 VS 2030
- Figure 143:
- MOST ACTIVE COMPANIES BY NUMBER OF STRATEGIC MOVES, INDIA, 2017 - 2030
- Figure 144:
- INDIA FERTILIZERS MARKET, MOST ADOPTED STRATEGIES, 2018 - 2021
- Figure 145:
- MARKET SHARE OF MAJOR PLAYERS IN %, INDIA
India Fertilizers Industry Segmentation
Complex, Straight are covered as segments by Type. Conventional, Speciality are covered as segments by Form. Fertigation, Foliar, Soil are covered as segments by Application Mode. Field Crops, Horticultural Crops, Turf & Ornamental are covered as segments by Crop Type.| Type | Complex | |||
| Straight | Micronutrients | Boron | ||
| Copper | ||||
| Iron | ||||
| Manganese | ||||
| Molybdenum | ||||
| Zinc | ||||
| Others | ||||
| Nitrogenous | Urea | |||
| Others | ||||
| Phosphatic | DAP | |||
| MAP | ||||
| SSP | ||||
| Others | ||||
| Potassic | MoP | |||
| Secondary Macronutrients | Calcium | |||
| Magnesium | ||||
| Sulfur | ||||
| Form | Conventional | |||
| Speciality | CRF | |||
| Liquid Fertilizer | ||||
| SRF | ||||
| Water Soluble | ||||
| Application Mode | Fertigation | |||
| Foliar | ||||
| Soil | ||||
| Crop Type | Field Crops | |||
| Horticultural Crops | ||||
| Turf & Ornamental | ||||
Need A Different Region or Segment?
Customize Now
Market Definition
- MARKET ESTIMATION LEVEL - Market Estimations for various types of fertilizers has been done at the product-level and not at the nutrient-level.
- NUTRIENT TYPES COVERED - Primary Nutrients: N, P and K, Secondary Macronutrients: Ca, Mg and S, Micronutients: Zn, Mn, Cu, Fe, Mo, B, and Others
- AVERAGE NUTRIENT APPLICATION RATE - This refers to the average volume of nutrient consumed per hectare of farmland in each country.
- CROP TYPES COVERED - Field Crops: Cereals, Pulses, Oilseeds, and Fiber Crops Horticulture: Fruits, Vegetables, Plantation Crops and Spices, Turf Grass and Ornamentals
| Keyword | Definition |
|---|---|
| Fertilizer | Chemical substance applied to crops to ensure nutritional requirements, available in various forms such as granules, powders, liquid, water soluble, etc. |
| Specialty Fertilizer | Used for enhanced efficiency and nutrient availability applied through soil, foliar, and fertigation. Includes CRF, SRF, liquid fertilizer, and water soluble fertilizers. |
| Controlled-Release Fertilizers (CRF) | Coated with materials such as polymer, polymer-sulfur, and other materials such as resins to ensure nutrient availability to the crop for its entire life cycle. |
| Slow-Release Fertilizers (SRF) | Coated with materials such as sulfur, neem, etc., to ensure nutrient availability to the crop for a longer period. |
| Foliar Fertilizers | Consist of both liquid and water soluble fertilizers applied through foliar application. |
| Water-Soluble Fertilizers | Available in various forms including liquid, powder, etc., used in foliar and fertigation mode of fertilizer application. |
| Fertigation | Fertilizers applied through different irrigation systems such as drip irrigation, micro irrigation, sprinkler irrigation, etc. |
| Anhydrous Ammonia | Used as fertilizer, directly injected into the soil, available in gaseous liquid form. |
| Single Super Phosphate (SSP) | Phosphorus fertilizer containing only phosphorus which has lesser than or equal to 35%. |
| Triple Super Phosphate (TSP) | Phosphorus fertilizer containing only phosphorus greater than 35%. |
| Enhanced Efficiency Fertilizers | Fertilizers coated or treated with additional layers of various ingredients to make it more efficient compared to other fertilizers. |
| Conventional Fertilizer | Fertilizers applied to crops through traditional methods including broadcasting, row placement, ploughing soil placement, etc. |
| Chelated Micronutrients | Micronutrient fertilizers coated with chelating agents such as EDTA, EDDHA, DTPA, HEDTA, etc. |
| Liquid Fertilizers | Available in liquid form, majorly used for application of fertilizers to crops through foliar and fertigation. |
Need More Details on Market Definition?
Ask a Question
Research Methodology
Mordor Intelligence follows a four-step methodology in all our reports.
- Step-1: IDENTIFY KEY VARIABLES: In order to build a robust forecasting methodology, the variables and factors identified in Step-1 are tested against available historical market numbers. Through an iterative process, the variables required for market forecast are set and the model is built on the basis of these variables.
- Step-2: Build a Market Model: Market-size estimations for the forecast years are in nominal terms. Inflation is not a part of the pricing, and the average selling price (ASP) is kept constant throughout the forecast period for each country.
- Step-3: Validate and Finalize: In this important step, all market numbers, variables and analyst calls are validated through an extensive network of primary research experts from the market studied. The respondents are selected across levels and functions to generate a holistic picture of the market studied.
- Step-4: Research Outputs: Syndicated Reports, Custom Consulting Assignments, Databases & Subscription Platforms

Get More Details On Research Methodology
Download PDF


