Market Overview
| Study Period | 2017 - 2030 |
|---|---|
| Base Year For Estimation | 2024 |
| Forecast Data Period | 2025 - 2030 |
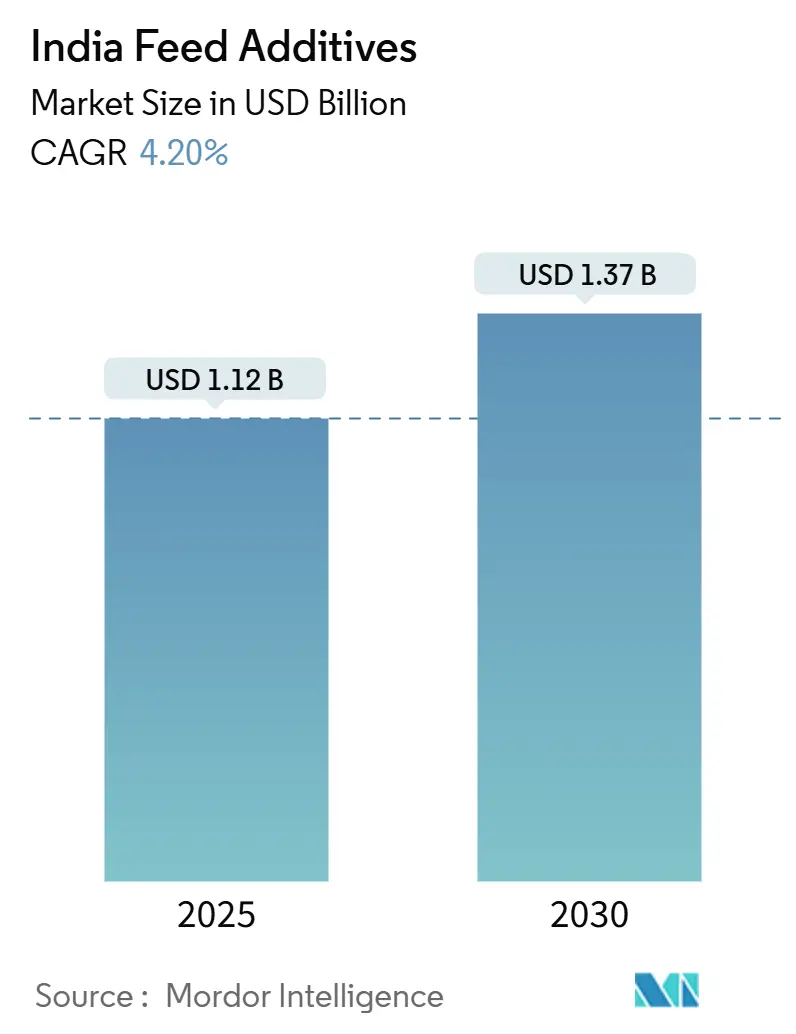
| Market Size (2025) | USD 1.12 Billion |
| Market Size (2030) | USD 1.37 Billion |
| Growth Rate (2025 - 2030) | 4.20% CAGR |
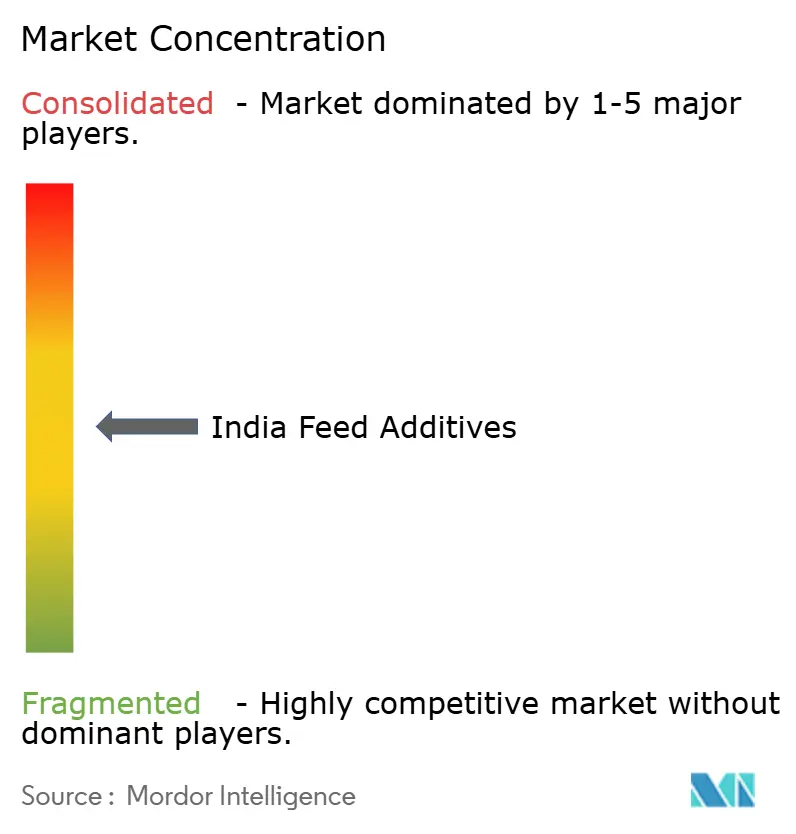
| Market Concentration | Medium |
Major Players
*Disclaimer: Major Players sorted in no particular order Image © Mordor Intelligence. Reuse requires attribution under CC BY 4.0. |
|
Analysis of India Feed Additives by Mordor Intelligence
The India feed additives market size reached USD 1.12 billion in 2025 and is forecast to expand to USD 1.37 billion by 2030, registering a 4.2% CAGR over the period. Steady population growth, rising protein consumption, and commercial livestock integration sustain demand even as cost pressures mount. The India feed additives market is benefiting from government incentives that encourage domestic amino-acid production, stricter rules that prohibit antibiotic growth promoters, and expanding aquaculture output that requires high-quality specialty additives. Precision livestock farming tools are also enabling micro-dosing, which favors value-added products that optimize feed conversion. Competitive intensity remains moderate because top suppliers continue to dominate enzymes, vitamins, and probiotics while local firms increase share in amino acids. Persistent bottlenecks in cold-chain logistics and raw-material price volatility are the chief brakes on near-term growth. [1]Source: Department of Animal Husbandry and Dairying, “Annual Report 2024-25,” Government of India, dahd.nic.in
Key Report Takeaways
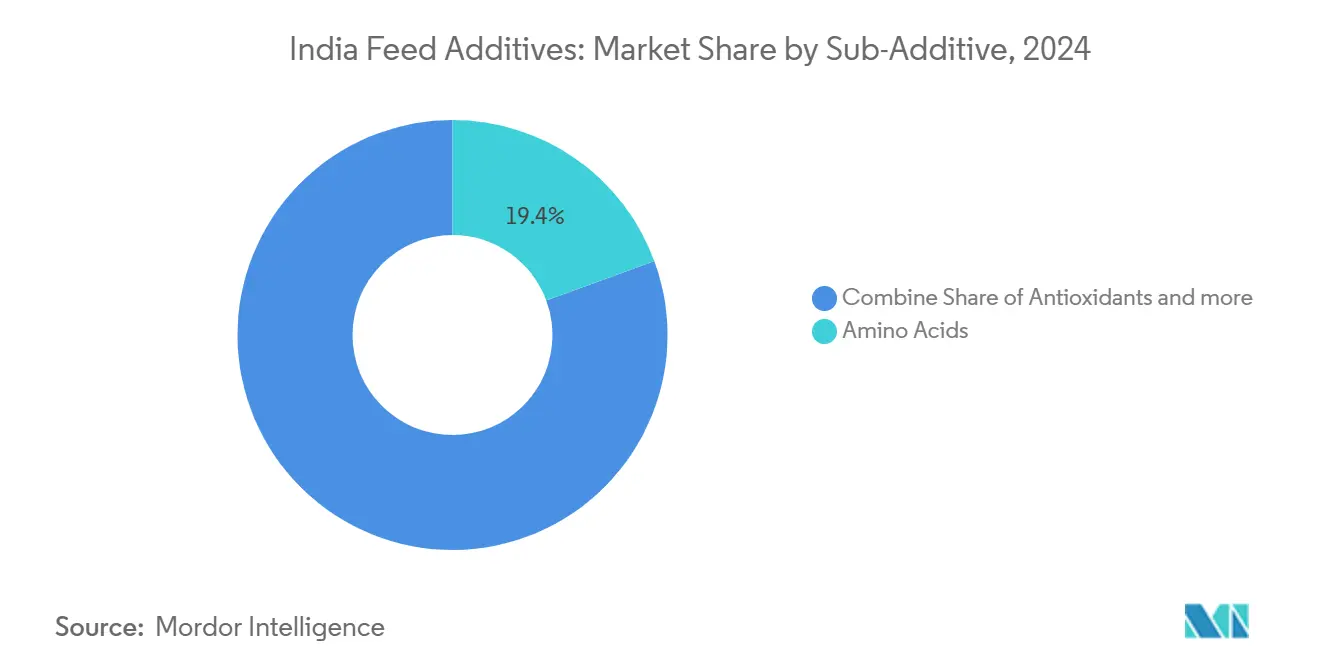
- By additive, amino acids led with a 19.4% share of the India feed additives market in 2024, while antioxidants are projected to post the fastest 4.9% CAGR through 2030.
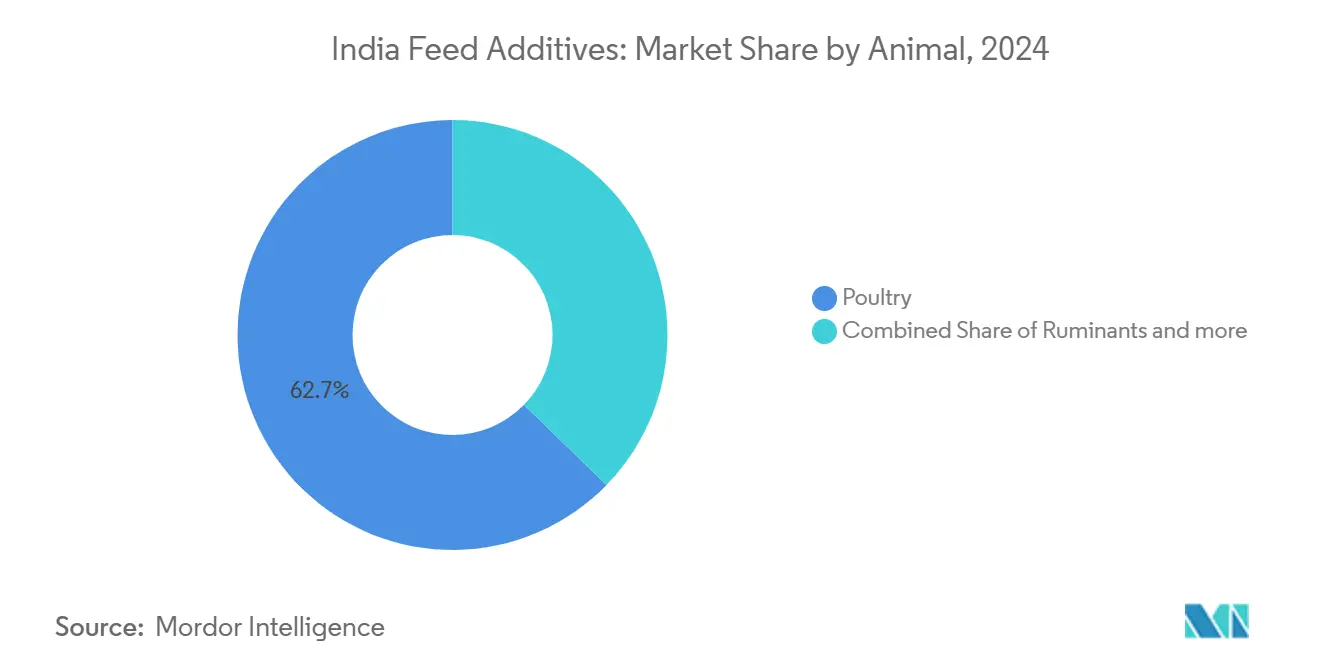
- By animal, poultry accounted for 62.7% of the Indian feed additives market size in 2024 and is expected to advance at a 4.3% CAGR through 2030.
Insights and Trends of India Feed Additives
Drivers Impact Analysis
| Driver | (~) % Impact on CAGR Forecast | Geographic Relevance | Impact Timeline |
|---|---|---|---|
| Rising industrial poultry production | +1.2% | Global, strongest in India, Asia-Pacific core | Medium term (2-4 years) |
| Ban on antibiotic growth promoters | +0.9% | India, spill-over to Asia-Pacific , Middle East and Africa | Short term (≤ 2 years) |
| Growing aquaculture output and export incentives | +0.7% | India coastal states, Asia-Pacific core | Medium term (2-4 years) |
| Expansion of integrated feed mills | +0.6% | India, North America and European Union | Long term (≥ 4 years) |
| PLI scheme lowering domestic amino-acid costs | +0.4% | National, early gains in Gujarat, Tamil Nadu | Long term (≥ 4 years) |
| Precision livestock farming enabling micro-dosing | +0.4% | Global, concentrated in developed regions | Long term (≥ 4 years) |
| Source: Mordor Intelligence | |||
Rising Industrial Poultry Production
Commercial broiler and layer farms produced more than 4.5 million tons of chicken meat and over 140 billion eggs in 2024. Integration levels crossed 80%, creating uniform nutritional protocols that rely on enzymes, amino acids, and organic acids. Major integrators linked performance bonuses to feed conversion ratios, so nutritionists aggressively adopt solutions demonstrated to deliver a measurable return. Standardized housing and automated feeders enable precise inclusion rates for heat-stable phytogenics and next-generation phytases. Early adopters report a 4% improvement in feed efficiency when phytase is combined with probiotics, further entrenching demand for premium functional additives. These practices reinforce the long-term expansion path of the India feed additives market.
Ban on Antibiotic Growth Promoters
The Food Safety and Standards Authority of India banned colistin, chloramphenicol, and nitrofurans in 2024. Eliminating these growth promoters pushed integrators toward probiotics, prebiotics, enzymes, and phytogenics that safeguard gut health without antimicrobial residues. Probiotic sales rose 23% year over year in 2025 as poultry integrators reformulated rations to comply with updated maximum-residue thresholds. Feed compounders also replaced in-feed antibiotics with organic acids that lower gut pH and suppress pathogens. International suppliers capitalized on this inflection by launching heat-stable Bacillus spores engineered to survive pelleting temperatures up to 90 °C. As the ban expands to cover additional molecules, the India feed additives market will increasingly favor natural performance enhancers.[2]Source: Food Safety and Standards Authority of India, “Notification on Antibiotic Growth Promoters,” fssai.gov.in
Growing Aquaculture Output and Export Incentives
The government lifted import duties on fish-meal replacements and increased the fisheries budget by 54% in 2025. Shrimp exporters received cash subsidies tied to good-aquaculture-practice certification, prompting farmers to adopt vitamin C, β-glucan, and nucleotides that strengthen immunity against white-spot virus. Coastal feed mills doubled capacity between 2023 and 2025, triggering a surge in specialty additives designed for pelleted and extruded feeds. Domestic lysine suppliers tapped this momentum by offering water-stable coated forms that withstand high salinity. Aquatic nutritionists now allocate up to 3% of formulation cost to functional additives, compared with 1.5% five years ago, supporting continued growth in the India feed additives market.
Expansion of Integrated Feed Mills
Large poultry groups invested INR 2,000 crore (USD 240 million) in new mills and processing plants between 2024 and 2025. Vertical integration allows real-time collaboration between feed formulators and additive vendors on custom premixes. Automated batching systems deliver tighter dosage control, enabling safe inclusion of potent enzymes and essential oils. Localized mills shorten lead times and protect additive potency by trimming transport distances. Suppliers bundle technical services such as near-infrared nutrient calibration to demonstrate cost savings, deepening partnerships. This structural shift accelerates demand for high-value products within the India feed additives market.
Restraints Impact Analysis
| Restraint | (~) % Impact on CAGR Forecast | Geographic Relevance | Impact Timeline |
|---|---|---|---|
| Raw-material price volatility | -1.1% | Global, acute in import-dependent regions | Short term (≤ 2 years) |
| Regulatory uncertainty on antibiotic residue limits | -0.6% | India, Asia-Pacific core, spill-over to Middle East and Africa | Medium term (2-4 years) |
| Cold-chain gaps restraining probiotic viability | -0.4% | India, Middle East and Africa, emerging Asia-Pacific markets | Medium term (2-4 years) |
| Backyard desi poultry limiting additive uptake | -0.3% | India rural belts, traditional farming regions | Long term (≥ 4 years) |
| Source: Mordor Intelligence | |||
Raw-Material Price Volatility
Maize prices climbed to INR 2,425 per quintal (USD 293 per metric ton) in early 2025 due to ethanol diversion, while soybean meal hovered at INR 52,000 per ton (USD 630 per metric ton). Feed accounts for 65% of poultry production cost, so any spike immediately erodes margins. Feed mills responded by stockpiling 60-day inventory and reformulating with enzymes that unlock non-starch polysaccharides, reducing corn inclusion by 3-5 percentage points. However, currency swings and freight charges still feed uncertainty into pricing. Small dairy and swine farms cut additive budgets first, temporarily damping overall volumes in the India feed additives market.
Cold-Chain Gaps Restraining Probiotic Viability
India has 31.8 million tons of cold-storage capacity against 400 million tons of perishables. More than 80% of operators remain unorganized and lack sensor-based temperature logging. Probiotics often lose viability when exposed to ambient loading docks in summer, forcing suppliers to over-formulate by up to 25% to guarantee label claims at farm gate. Extra buffering agents and specialized packaging inflate costs, discouraging price-sensitive buyers. Multinationals with local fermentation plants circumvent the issue by shipping direct in refrigerated trucks, but smaller firms struggle. The infrastructure deficit therefore suppresses potential in the India feed additives market until investment improves.
Segment Analysis
By Additive: Amino Acids Lead Amid Cost Optimization Pressures
Amino acids retained a 19.4% share of the India feed additives market in 2024, while antioxidants, though smaller, are growing fastest at a 4.9% CAGR because volatile ingredient prices lengthen feed storage cycles and raise rancidity risk. are forecast to rise at a 3.8% CAGR through 2030 as feed formulators fine-tune protein levels for margin relief. The category commanded USD 213 million of the India feed additives market size in 2025 and benefits from the Production Linked Incentive scheme that encourages domestic lysine and methionine capacity. Local fermentation reduces freight premiums and mitigates Chinese supply risk, allowing integrators to lock in contracts at steady prices. Tryptophan usage doubled since 2023, reflecting adoption in specialty layer rations aimed at stress reduction. Enzyme portfolios continue to diversify with xylanases and proteases tailored to high-fiber regional diets. Probiotics and phytogenics see variable uptake depending on cold chain access, but heat-stable Bacillus spores and turmeric-derived essential oils post above-market growth. BIS quality mandates are pushing out sub-scale blenders and consolidating share toward established brands, including DSM-Firmenich and Trouw Nutrition, which both operate ISO-certified premix lines.
Demand for vitamin and mineral premixes remains stable across livestock species. Mycotoxin detoxifiers are gaining traction after aflatoxin outbreaks in maize shipments heightened awareness in dairy cooperatives. Yeast cell-wall derivatives used as immune modulators are entering poultry starter diets as antibiotic replacements. Collectively, these trends underpin steady gains for additive suppliers that offer scientifically validated products and robust local distribution, reinforcing revenue momentum in the India feed additives market. [3]Source: Department of Chemicals and Petrochemicals, “Production Linked Incentive Scheme Guidelines,” chemicals.nic.in
Note: Segment shares of all individual segments available upon report purchase
Get Detailed Market Forecasts at the Most Granular Levels
Download PDF
By Animal: Poultry Dominance Underscores Commercial Scale
Poultry consumed 62.7% of all additives sold in 2024, equaling USD 690 million of the India feed additives market size and advancing at a 4.3% CAGR to 2030. Broilers alone eat 65% of poultry additives, and integrators maintain real-time sensor grids that make micro-dosing enzymes economically feasible. Layers adopt higher antioxidant and vitamin levels to sustain shell quality over extended cycles. Shrimp farming propels aquaculture to a 5.1% CAGR as exports near USD 8 billion and farmers integrate nucleotides and glucans to mitigate early mortality syndrome. Fish feed formulators add coated methionine to balance soy-based diets, ensuring amino-acid score parity with fish meal.
Dairy cattle receive rumen-protected choline and bypass methionine that improve milk yield by 0.3 kg per head per day in trials reported by ICAR-National Dairy Research Institute. Swine remains niche owing to cultural preferences but pockets of commercial farms in Punjab and Uttar Pradesh trial acidifiers and zinc chelates to curb post-weaning diarrhea. Companion-animal nutrition emerges fastest in urban clusters, though still below 2% of the India feed additives market, as premium dog foods incorporate joint-health glucosamine and yeast beta-glucans.
Get Detailed Market Forecasts at the Most Granular Levels
Download PDF
Geography Analysis
Southern states anchored by Tamil Nadu, Andhra Pradesh, and Karnataka account for almost half of India feed additives market turnover thanks to dense poultry and shrimp clusters linked to port infrastructure. In 2025 Andhra Pradesh alone represented USD 270 million in additive demand, reflecting its status as the country’s top shrimp exporter. Northern dairy hubs in Punjab and Haryana expanded mineral-vitamin premix usage at 6% year over year as cooperatives formalized feed procurement to meet residue standards. Western corridors around Maharashtra and Gujarat act as distribution pivots because of motorway and cold-chain projects under the Sagarmala scheme, cutting delivery times to inland dairies by one day. Eastern markets led by West Bengal grew 3.5% in 2025; low commercial feed penetration keeps volumes modest but represents white-space for phytogenic suppliers. The Inland Waterways project on the Brahmaputra promises cheaper logistics for Assam poultry integrators, which could unlock latent additive demand after 2027.
Coastal zones receive the lion’s share of high-value temperature-sensitive enzymes and probiotics because refrigerated depots cluster near port cities. Inland drought-prone regions like Rajasthan rely on urea-molasses blocks and bypass protein rather than premium additives, so suppliers target them with low-cost acidifiers. Regional policies harmonize via FSSAI, but execution varies; for instance, Telangana mandates batch-wise additive disclosure on feed labels, tightening traceability versus Bihar, which is still finalizing state-level feed rules. State animal husbandry departments increasingly require vendor certification, nudging the India feed additives market toward larger compliant producers.
Competitive Landscape
The India feed additives market exhibits moderate concentration, accounting for 42% market share with fragmented competitive dynamics, as established multinational corporations compete alongside emerging domestic manufacturers across diverse product categories. Market leadership remains distributed among specialized players, with IFF (Danisco Animal Nutrition) commanding a high market share through its comprehensive enzyme and probiotic portfolio, while DSM Nutritional Products AG leverages its vitamin and nutritional expertise. The competitive intensity has intensified following regulatory changes eliminating antibiotic growth promoters, creating opportunities for companies positioned in alternative performance enhancement technologies.
Strategic differentiation increasingly centers on technical service capabilities and localized production, as demonstrated by DSM-Firmenich's recent mycotoxin solutions plant opening in Jadcherla and Trouw Nutrition's automated premix facility in Hyderabad [Company Press Releases]. White-space opportunities exist in precision dosing technologies and cold chain-stable formulations, addressing infrastructure constraints that limit market penetration for temperature-sensitive products. Emerging disruptors include domestic biotechnology companies like Tex Biosciences, which completed Rs 32 crore fermentation capacity expansion to compete with established international suppliers through cost-effective local production AgroSpectrum.
Technology adoption has become a key competitive differentiator, with companies investing in IoT-enabled monitoring systems and data analytics platforms to demonstrate additive efficacy and optimize application protocols. The Bureau of Indian Standards (BIS) certification requirements have created barriers to entry while supporting market consolidation toward suppliers with established quality systems and regulatory compliance capabilities. Regulatory influence from the Food Safety and Standards Authority of India (FSSAI) continues shaping competitive positioning, as companies with robust approval processes and documentation capabilities gain advantages in novel product introductions and market access.
Leaders of India Feed Additives
-
DSM Nutritional Products AG
-
Alltech, Inc.
-
Adisseo
-
Archer Daniel Midland Co.
-
IFF(Danisco Animal Nutrition)
- *Disclaimer: Major Players sorted in no particular order
Need More Details on Market Players and Competitors?
Download PDF
Recent Industry Developments
- September 2025: DSM-Firmenich inaugurated a specialized mycotoxin solutions plant in Jadcherla. The USD 65 million unit integrates spray-dryers, vacuum coolers, and real-time spectrometers that tailor binder ratios to Indian corn contaminant spectra. Management expects the site to cut delivery lead time to integrators by five days and boost regional R&D staffing by 20%.
- July 2025: IFB Agro completed the takeover of Cargill India’s aquafeed business. The deal adds two coastal plants that together raise IFB’s aquatic feed capacity to 180,000 tons and brings 40 sales staff under its banner, helping the company target shrimp farmers in Andhra Pradesh and Odisha.
- March 2025: Indian Poultry Alliance unveiled a INR 2,000 crore (USD 240 million) capex roadmap that includes greenfield processing sites in Bihar and Telangana, plus feed mills designed for 30 tons per hour each. Integrated pellet coolers and vacuum coaters will support direct probiotic addition and essential oil coating.
Scope of Report on India Feed Additives
Additive
| Acidifiers | By Sub Additive | Fumaric Acid |
| Lactic Acid | ||
| Propionic Acid | ||
| Other Acidifiers | ||
| Amino Acids | By Sub Additive | Lysine |
| Methionine | ||
| Threonine | ||
| Tryptophan | ||
| Other Amino Acids | ||
| Antibiotics | By Sub Additive | Bacitracin |
| Penicillins | ||
| Tetracyclines | ||
| Tylosin | ||
| Other Antibiotics | ||
| Antioxidants | By Sub Additive | Butylated Hydroxyanisole (BHA) |
| Butylated Hydroxytoluene (BHT) | ||
| Citric Acid | ||
| Ethoxyquin | ||
| Propyl Gallate | ||
| Tocopherols | ||
| Other Antioxidants | ||
| Binders | By Sub Additive | Natural Binders |
| Synthetic Binders | ||
| Enzymes | By Sub Additive | Carbohydrases |
| Phytases | ||
| Other Enzymes | ||
| Flavors & Sweeteners | By Sub Additive | Flavors |
| Sweeteners | ||
| Minerals | By Sub Additive | Macrominerals |
| Microminerals | ||
| Mycotoxin Detoxifiers | By Sub Additive | Binders |
| Biotransformers | ||
| Phytogenics | By Sub Additive | Essential Oil |
| Herbs & Spices | ||
| Other Phytogenics | ||
| Pigments | By Sub Additive | Carotenoids |
| Curcumin & Spirulina | ||
| Prebiotics | By Sub Additive | Fructo Oligosaccharides |
| Galacto Oligosaccharides | ||
| Inulin | ||
| Lactulose | ||
| Mannan Oligosaccharides | ||
| Xylo Oligosaccharides | ||
| Other Prebiotics | ||
| Probiotics | By Sub Additive | Bifidobacteria |
| Enterococcus | ||
| Lactobacilli | ||
| Pediococcus | ||
| Streptococcus | ||
| Other Probiotics | ||
| Vitamins | By Sub Additive | Vitamin A |
| Vitamin B | ||
| Vitamin C | ||
| Vitamin E | ||
| Other Vitamins | ||
| Yeast | By Sub Additive | Live Yeast |
| Selenium Yeast | ||
| Spent Yeast | ||
| Torula Dried Yeast | ||
| Whey Yeast | ||
| Yeast Derivatives |
By Animal
| Aquaculture | By Sub Animal | Fish |
| Shrimp | ||
| Other Aquaculture Species | ||
| Poultry | By Sub Animal | Broiler |
| Layer | ||
| Other Poultry Birds | ||
| Ruminants | By Sub Animal | Beef Cattle |
| Dairy Cattle | ||
| Other Ruminants | ||
| Swine | ||
| Other Animals |
| Additive | Acidifiers | By Sub Additive | Fumaric Acid |
| Lactic Acid | |||
| Propionic Acid | |||
| Other Acidifiers | |||
| Amino Acids | By Sub Additive | Lysine | |
| Methionine | |||
| Threonine | |||
| Tryptophan | |||
| Other Amino Acids | |||
| Antibiotics | By Sub Additive | Bacitracin | |
| Penicillins | |||
| Tetracyclines | |||
| Tylosin | |||
| Other Antibiotics | |||
| Antioxidants | By Sub Additive | Butylated Hydroxyanisole (BHA) | |
| Butylated Hydroxytoluene (BHT) | |||
| Citric Acid | |||
| Ethoxyquin | |||
| Propyl Gallate | |||
| Tocopherols | |||
| Other Antioxidants | |||
| Binders | By Sub Additive | Natural Binders | |
| Synthetic Binders | |||
| Enzymes | By Sub Additive | Carbohydrases | |
| Phytases | |||
| Other Enzymes | |||
| Flavors & Sweeteners | By Sub Additive | Flavors | |
| Sweeteners | |||
| Minerals | By Sub Additive | Macrominerals | |
| Microminerals | |||
| Mycotoxin Detoxifiers | By Sub Additive | Binders | |
| Biotransformers | |||
| Phytogenics | By Sub Additive | Essential Oil | |
| Herbs & Spices | |||
| Other Phytogenics | |||
| Pigments | By Sub Additive | Carotenoids | |
| Curcumin & Spirulina | |||
| Prebiotics | By Sub Additive | Fructo Oligosaccharides | |
| Galacto Oligosaccharides | |||
| Inulin | |||
| Lactulose | |||
| Mannan Oligosaccharides | |||
| Xylo Oligosaccharides | |||
| Other Prebiotics | |||
| Probiotics | By Sub Additive | Bifidobacteria | |
| Enterococcus | |||
| Lactobacilli | |||
| Pediococcus | |||
| Streptococcus | |||
| Other Probiotics | |||
| Vitamins | By Sub Additive | Vitamin A | |
| Vitamin B | |||
| Vitamin C | |||
| Vitamin E | |||
| Other Vitamins | |||
| Yeast | By Sub Additive | Live Yeast | |
| Selenium Yeast | |||
| Spent Yeast | |||
| Torula Dried Yeast | |||
| Whey Yeast | |||
| Yeast Derivatives | |||
| By Animal | Aquaculture | By Sub Animal | Fish |
| Shrimp | |||
| Other Aquaculture Species | |||
| Poultry | By Sub Animal | Broiler | |
| Layer | |||
| Other Poultry Birds | |||
| Ruminants | By Sub Animal | Beef Cattle | |
| Dairy Cattle | |||
| Other Ruminants | |||
| Swine | |||
| Other Animals | |||
Need A Different Region or Segment?
Customize Now
Market Definition
- FUNCTIONS - For the study, feed additives are considered to be commercially manufactured products that are used to enhance characteristics such as weight gain, feed conversion ratio, and feed intake when fed in appropriate proportions.
- RESELLERS - Companies engaged in reselling feed additives without value addition have been excluded from the market scope, to avoid double counting.
- END CONSUMERS - Compound feed manufacturers are considered to be end-consumers in the market studied. The scope excludes farmers buying feed additives to be used directly as supplements or premixes.
- INTERNAL COMPANY CONSUMPTION - Companies engaged in the production of compound feed as well as the manufacturing of feed additives are part of the study. However, while estimating the market sizes, the internal consumption of feed additives by such companies has been excluded.
| Keyword | Definition |
|---|---|
| Feed additives | Feed additives are products used in animal nutrition for purposes of improving the quality of feed and the quality of food from animal origin, or to improve the animals’ performance and health. |
| Probiotics | Probiotics are microorganisms introduced into the body for their beneficial qualities. (It maintains or restores beneficial bacteria to the gut). |
| Antibiotics | Antibiotic is a drug that is specifically used to inhibit the growth of bacteria. |
| Prebiotics | A non-digestible food ingredient that promotes the growth of beneficial microorganisms in the intestines. |
| Antioxidants | Antioxidants are compounds that inhibit oxidation, a chemical reaction that produces free radicals. |
| Phytogenics | Phytogenics are a group of natural and non-antibiotic growth promoters derived from herbs, spices, essential oils, and oleoresins. |
| Vitamins | Vitamins are organic compounds, which are required for normal growth and maintenance of the body. |
| Metabolism | A chemical process that occurs within a living organism in order to maintain life. |
| Amino acids | Amino acids are the building blocks of proteins and play an important role in metabolic pathways. |
| Enzymes | Enzyme is a substance that acts as a catalyst to bring about a specific biochemical reaction. |
| Anti-microbial resistance | The ability of a microorganism to resist the effects of an antimicrobial agent. |
| Anti-microbial | Destroying or inhibiting the growth of microorganisms. |
| Osmotic balance | It is a process of maintaining salt and water balance across membranes within the body's fluids. |
| Bacteriocin | Bacteriocins are the toxins produced by bacteria to inhibit the growth of similar or closely related bacterial strains. |
| Biohydrogenation | It is a process that occurs in the rumen of an animal in which bacteria convert unsaturated fatty acids (USFA) to saturated fatty acids (SFA). |
| Oxidative rancidity | It is a reaction of fatty acids with oxygen, which generally causes unpleasant odors in animals. To prevent these, antioxidants were added. |
| Mycotoxicosis | Any condition or disease caused by fungal toxins, mainly due to contamination of animal feed with mycotoxins. |
| Mycotoxins | Mycotoxins are toxin compounds that are naturally produced by certain types of molds (fungi). |
| Feed Probiotics | Microbial feed supplements positively affect gastrointestinal microbial balance. |
| Probiotic yeast | Feed yeast (single-cell fungi) and other fungi used as probiotics. |
| Feed enzymes | They are used to supplement digestive enzymes in an animal’s stomach to break down food. Enzymes also ensure that meat and egg production is improved. |
| Mycotoxin detoxifiers | They are used to prevent fungal growth and to stop any harmful mold from being absorbed in the gut and blood. |
| Feed antibiotics | They are used both for the prevention and treatment of diseases but also for rapid growth and development. |
| Feed antioxidants | They are used to protect the deterioration of other feed nutrients in the feed such as fats, vitamins, pigments, and flavoring agents, thus providing nutrient security to the animals. |
| Feed phytogenics | Phytogenics are natural substances, added to livestock feed to promote growth, aid in digestion, and act as anti-microbial agents. |
| Feed vitamins | They are used to maintain the normal physiological function and normal growth and development of animals. |
| Feed flavors and sweetners | These flavors and sweeteners help to mask tastes and odors during changes in additives or medications and make them ideal for animal diets undergoing transition. |
| Feed acidifiers | Animal feed acidifiers are organic acids incorporated into the feed for nutritional or preservative purposes. Acidifiers enhance congestion and microbiological balance in the alimentary and digestive tracts of livestock. |
| Feed minerals | Feed minerals play an important role in the regular dietary requirements of animal feed. |
| Feed binders | Feed binders are the binding agents used in the manufacture of safe animal feed products. It enhances the taste of food and prolongs the storage period of the feed. |
| Key Terms | Abbreviation |
| LSDV | Lumpy Skin Disease Virus |
| ASF | African Swine Fever |
| GPA | Growth Promoter Antibiotics |
| NSP | Non-Starch Polysaccharides |
| PUFA | Polyunsaturated Fatty Acid |
| Afs | Aflatoxins |
| AGP | Antibiotic Growth Promoters |
| FAO | The Food And Agriculture Organization of the United Nations |
| USDA | The United States Department of Agriculture |
Need More Details on Market Definition?
Ask a Question
Research Methodology
Mordor Intelligence follows a four-step methodology in all our reports.
- Step-1: IDENTIFY KEY VARIABLES: In order to build a robust forecasting methodology, the variables and factors identified in Step-1 are tested against available historical market numbers. Through an iterative process, the variables required for market forecast are set and the model is built on the basis of these variables.
- Step-2: Build a Market Model: Market-size estimations for the forecast years are in nominal terms. Inflation is not a part of the pricing, and the average selling price (ASP) is kept constant throughout the forecast period.
- Step-3: Validate and Finalize: In this important step, all market numbers, variables and analyst calls are validated through an extensive network of primary research experts from the market studied. The respondents are selected across levels and functions to generate a holistic picture of the market studied.
- Step-4: Research Outputs: Syndicated Reports, Custom Consulting Assignments, Databases & Subscription Platforms

Get More Details On Research Methodology
Download PDF


