
Market Overview
| Study Period | 2020 - 2031 |
|---|---|
| Forecast Data Period | 2026 - 2031 |
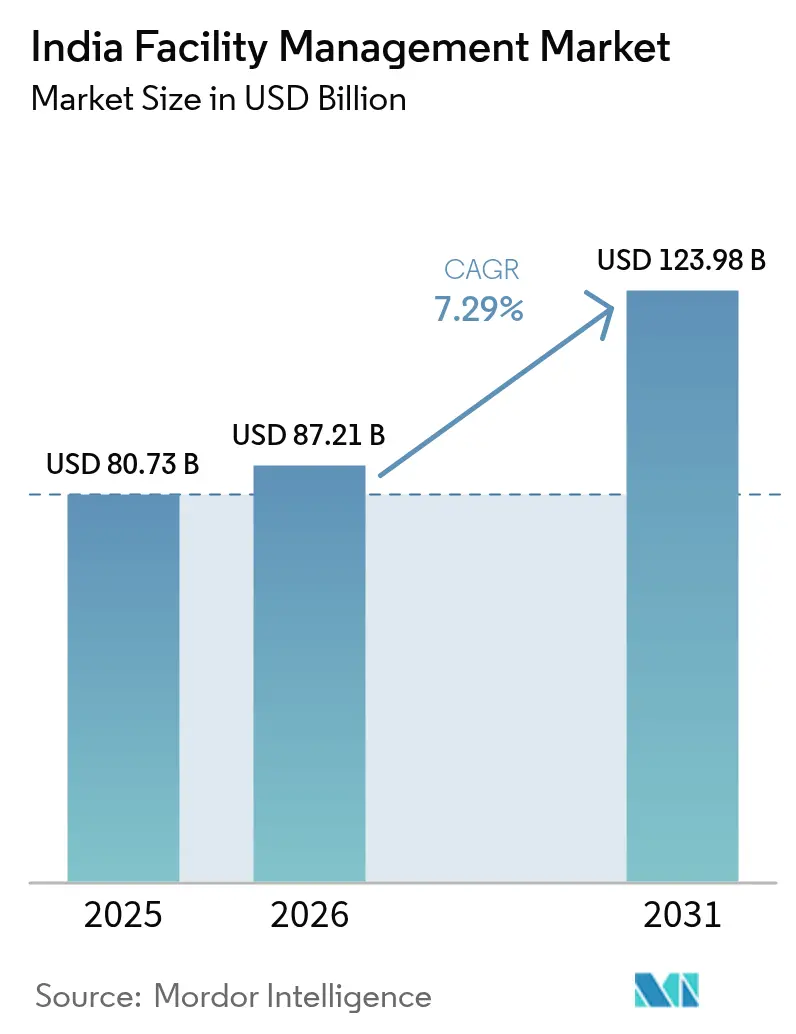
| Base Year Market Size (2025) | USD 80.73 Billion |
| Market Size (2026) | USD 87.21 Billion |
| Market Size (2031) | USD 123.98 Billion |
| Growth Rate (2026 - 2031) | 7.29% CAGR |
| Market Concentration | Medium |
Major Players *Disclaimer: Major Players sorted in no particular order Image © Mordor Intelligence. Reuse requires attribution under CC BY 4.0. | |
India Facility Management Market Analysis by Mordor Intelligence
The India facility management market size is expected to increase from USD 87.21 billion in 2026 to reach USD 123.98 billion by 2031, growing at a CAGR of 7.29% over 2026-2031. Early adoption of predictive-maintenance platforms, sustainability-linked retrofits and integrated contracts is translating into larger average deal values. Grade A offices in technology corridors are running near capacity, which elevates demand for 24-hour mechanical, electrical and plumbing support, while semiconductor and electronics plants require cleanroom certification and uninterrupted power. Corporate landlords now embed energy-performance guarantees in service-level agreements, rewarding providers that invest in Internet of Things (IoT) sensors and analytics. At the same time, the Production Linked Incentive (PLI) scheme keeps industrial project pipelines full and expands the addressable pool for hard-services specialists.
Key Report Takeaways
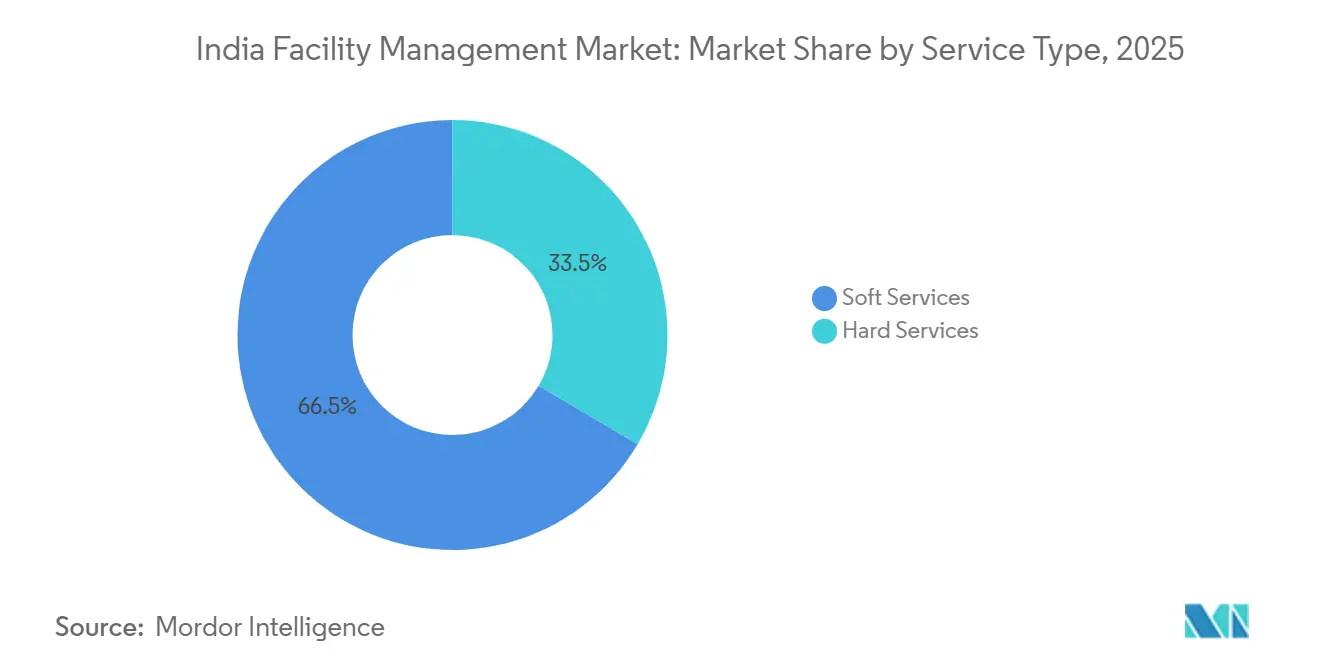
- By service type, soft services led with 66.52% of the India facility management market share in 2025. Hard services are projected to expand at an 8.37% CAGR through 2031, outpacing the India facility management market.
- By offering type, in-house models retained 67.56% share of the India facility management market size in 2025, but outsourced integrated contracts are growing at 9.03% annually.
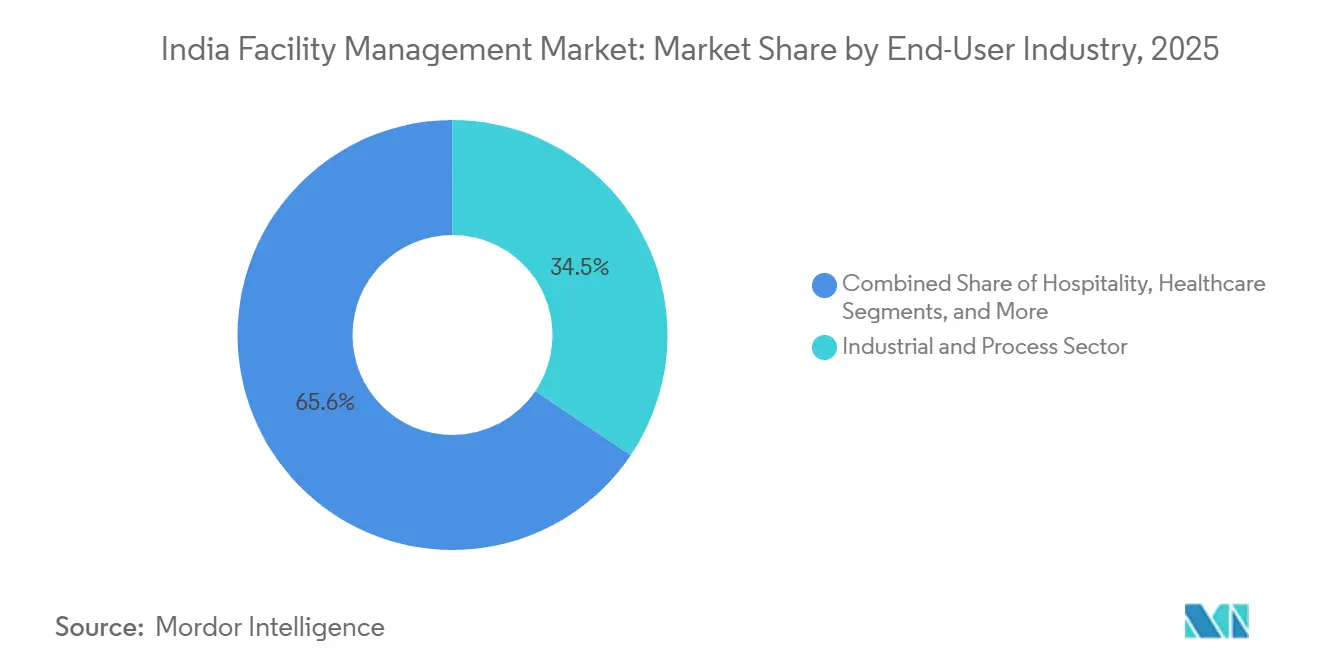
- By end-user, industrial facilities commanded 34.42% of 2025 revenue, while healthcare is advancing at a 9.42% CAGR through 2031.
Note: Market size and forecast figures in this report are generated using Mordor Intelligence’s proprietary estimation framework, updated with the latest available data and insights as of 2026.
India Facility Management Market Trends and Insights
Drivers Impact Analysis*
| Driver | (~) % Impact On CAGR Forecast | Geographic Relevance | Impact Timeline |
|---|---|---|---|
| Rapid Commercial Real Estate Expansion | +1.8% | National, Concentrated In Bengaluru, Mumbai, Delhi NCR, Hyderabad, Pune, Chennai | Medium Term (2–4 Years) |
| Technology Integration, IoT, AI And Automation | +1.5% | National, Early Adoption In Metro And GCC Hubs | Long Term (≥ 4 Years) |
| Increasing Outsourcing Trend | +1.3% | National, Accelerating In Tier-2 Cities Such As Ahmedabad, Jaipur, Kochi, Chandigarh | Medium Term (2–4 Years) |
| Hygiene And Health Compliance Mandates | +1.0% | National, Heightened In Healthcare And Hospitality | Short Term (≤ 2 Years) |
| Uptake Of Outcome-Based FM Contracts In Tier-2 Cities | +0.8% | Tier-2 And Tier-3 Urban Centers | Medium Term (2–4 Years) |
| ESG-Linked Lending Driving Green Facility Upgrades | +0.7% | National, Led By BRSR-Compliant Corporates And IGBC-Certified Projects | Long Term (≥ 4 Years) |
| Source: Mordor Intelligence | |||
Rapid Commercial Real Estate Expansion
Developers completed more than 79 million sq ft of Grade A offices during 2025, keeping Bengaluru, Hyderabad and Pune below 13% vacancy. New-build specifications call for smart meters, LEED or IGBC certification and fire-safety systems aligned with the National Building Code 2016.[1]“India Office Market Overview,” CBRE, cbre.co.in Facility managers therefore handle round-the-clock HVAC optimization, periodic fire-audits and predictive analytics that minimize downtime. Flexible workspace operators added capacity in core micro-markets, creating variable daily occupancy that drives use of occupancy sensors and space-utilization dashboards.[2]“Office Leasing and Real Estate Trends,” JLL India, jll.co.in Collectively, these trends push bundled hard-and-soft contracts to the forefront of landlord strategy. Providers that can integrate mechanical, cleaning, security and energy services under performance-linked fees win longer tenures and higher margins.
Technology Integration, IoT, AI and Automation
IoT sensors now track temperature, vibration and power in more than 500 million sq ft of commercial and industrial space, feeding cloud platforms that flag anomalies well before failure.[3]“Building Automation and Smart Building Solutions,” Johnson Controls, johnsoncontrols.com Artificial intelligence tools evaluate historical work orders and asset telemetry, enabling maintenance interventions that cut unplanned downtime by up to 30%. Digital twins simulate refurbishments and renewable-energy additions to guide capex decisions. The Securities and Exchange Board of India (SEBI) asked the top 1,000 listed firms to disclose energy-use data, so clients can increasingly demand real-time dashboards. Service providers able to connect building-management software with enterprise resource planning platforms gain competitive insulation.
Increasing Outsourcing Trend
Integrated facility management (IFM) contracts expanded 9.03% in 2025 as chief financial officers sought variable-cost structures and single-vendor accountability. Outcome-based terms now appear in roughly one-quarter of new awards, tying payments to uptime and energy savings. Secondary cities such as Kochi, Ahmedabad and Jaipur, which host new GCC sites, often have no legacy facility teams, so they outsource from day one. Tier-2 penetration of IFM is therefore running ahead of metro levels. Higher contractual risk pushes incumbents to invest in staff training, technology platforms and command centers, raising the capital bar for newcomers.
Hygiene and Health Compliance Mandates
Post-pandemic rules require daily sanitization of high-touch surfaces and continuous indoor-air monitoring in healthcare and hospitality. Hospitals under the Ayushman Bharat Health Infrastructure Mission must demonstrate such compliance to secure federal funding, fuelling demand for certified cleaning, biomedical-waste handling and 24-hour HVAC oversight. Commercial landlords in Mumbai, Bengaluru and Delhi NCR adopt similar hygiene scores to reassure multinational tenants. Hotels deploy touchless check-in and antimicrobial coatings, lifting technical complexity. Vendors that certify staff under ISO 9001 and ISO 45001 gain pricing power while low-skill outfits face erosion.
Restraints Impact Analysis*
| Restraint | (~) % Impact On CAGR Forecast | Geographic Relevance | Impact Timeline |
|---|---|---|---|
| Labor Shortages And Skill Gaps | -1.2% | National, Acute In Metros With High Attrition | Short Term (≤ 2 Years) |
| Margin Pressure From Rising Operational Costs | -1.0% | National, Pronounced In Labor-Intensive Soft Services | Short Term (≤ 2 Years) |
| High Client Price Sensitivity And Fragmented Procurement Practices | -0.6% | National, Severe In Public Sector And SME Segments | Medium Term (2–4 Years) |
| Smart-Building Automation Reducing Manned-Guarding Demand | -0.4% | National, Early Impact In New Grade A Offices | Medium Term (2–4 Years) |
| Source: Mordor Intelligence | |||
Labour Shortages and Skill Gaps
Metro attrition in housekeeping and guarding exceeded 40% in 2025 as workers jumped to e-commerce and gig platforms. Technical trades show deeper deficits: vocational institutes graduate fewer than 50,000 HVAC and BMS technicians against 150,000 annual demand. Providers therefore run academies and apprenticeship programs, lifting recruitment costs and elongating ramp-up times. Wage inflation of 10%-12% compresses margins when contracts lack automatic escalation clauses. Some firms pilot remote monitoring to cut site headcount, but regulations and client preferences for physical presence still limit scale.
Margin Pressure from Rising Operational Costs
Diesel for backup generators rose 8% year-over-year in 2025, cleaning chemicals by 6%-10% and insurance premiums by up to 15%.[4]“Input Cost Inflation Squeezes FM Margins,” Business Standard, business-standard.com Yet public-sector undertakings and small businesses hold rates flat, forcing vendors to absorb the increases. Fragmented tendering, each building issues separate bids, prevents scale benefits in consumables and staffing. Lowest-price procurement clauses further erode profitability. Larger groups cross-subsidize thin-margin contracts with advisory services, whereas mid-tier specialists lack diversification and struggle to invest in technology.
*Our forecasts treat driver/restraint impacts as directional, not additive. The impact forecasts reflect baseline growth, mix effects, and variable interactions.
Segment Analysis
By Service Type: Hard Services Outpace Soft on Technology Tailwinds
Hard services generated faster growth than the overall India facility management market, expanding at an 8.37% CAGR thanks to mandatory compliance and energy-saving retrofits. The National Building Code 2016 obliges fire-detection and suppression in high-rise assets, spurring retrofit programs across older stock. Bureau of Energy Efficiency (BEE) codes encourage chiller replacement and variable-frequency drives that trim consumption by up to 35%. Consequently, institutional landlords deploy condition-based monitoring suites, creating sticky recurring revenue anchored to the India facility management market size.
Soft services still delivered 66.52% of 2025 revenue by virtue of daily cleaning, office support and guarding. However, manned-security posts are falling as access control and video analytics spread, particularly in new Grade A offices, reducing guard density by almost one-third. Cleaning moves toward rope-access facade works and post-construction deep cleans that command premiums. Catering digitizes menus and tracks waste to satisfy wellness targets. Fragmentation persists, constraining economies of scale, but niche operators carve profit in specialized disinfection or linen sterilization.


By Offering Type: Outsourcing Gains as Outcome Models Mature
Integrated facility management, which bundles multiple service lines, is the fastest rising slice of the India facility management market size, growing 9.03% annually. Multinationals favor IFM for single invoicing and data transparency; payments hinge on uptime or energy-saving metrics, deepening engagement length. Vendors must therefore deploy IoT gateways, mobility apps and centralized command centers. Bundled deals combining two or three services remain popular in Tier-2 cities, bridging clients from single-line outsourcing toward full integration.
Despite the shift, in-house models still represented 67.56% of 2025 revenue because many public agencies and conglomerates view facilities as strategic. Security-sensitive functions or GMP-driven assembly lines keep staffing internal to safeguard compliance. Yet talent scarcity and the opportunity cost of capex stored in non-core assets push several conglomerates to externalize gradually, often beginning with single-service pilots such as housekeeping before graduating to bundled portfolios
By End-User Industry: Healthcare Surges on Infrastructure Push
Healthcare is the fastest advancing vertical at a 9.42% CAGR, underpinned by the rollout of 1.5 lakh Health and Wellness Centres and critical-care blocks that need infection control, biomedical-waste segregation and ISO-certified HVAC routines. Private chains added up to 18,000 beds in 2025 and outsource non-clinical operations for cost efficiency and audit traceability. Pharmaceutical plants built under the PLI scheme adopt ISO Class 5-8 cleanrooms and continuous particulate monitoring, anchoring high-value long-term contracts.
Industrial and process facilities contributed 34.42% of 2025 revenue, the largest slice of the India facility management market share. Semiconductor fabs, electronics lines and automotive clusters demand uninterrupted power and ISO 14001 and ISO 45001 compliance. Commercial real estate, especially GCC-dominated offices, retains a robust pipeline, while hospitality saw occupancy rebound to 68%-70% in 2025, boosting need for guest-experience housekeeping. Institutional campuses and transport hubs offer volume but low margins due to price-sensitive tendering.

Geography Analysis
Metros, Bengaluru, Mumbai, Delhi NCR, Hyderabad, Pune and Chennai, accounted for roughly two-thirds of 2025 facility-management revenue. Bengaluru alone leased close to 20 million sq ft of offices, driving requirement for constant HVAC runtime and BMS analytics. Mumbai’s premium districts recorded 8%-10% rent growth, prompting landlords to adopt IFM to safeguard asset value. Delhi NCR added between 12 million and 14 million sq ft, with professional-services occupiers insisting on bundled contracts.
Tier-2 cities such as Ahmedabad, Jaipur, Kochi and Chandigarh are rising fast, posting 15%-18% leasing growth in 2025 and offering greenfield opportunities for the India facility management market. Outcome-based contracts already make up one-third of awards here, higher than the national average, because occupants lack legacy staff and demand turnkey engagement. However, procurement remains price driven and margins thinner.
Central and state Smart Cities Mission budgets inject funds for command-and-control centers, energy-efficient public buildings and integrated transport nodes. These projects demand BMS integration and preventive-maintenance regimes aligned to ISO 50001, distributing India facility management market revenues beyond the six metros.
Regulatory Landscape
Facility management in India operates under overlapping building, safety, labor, energy, and digital-compliance requirements that increasingly shape SLAs and audit trails. The National Building Code 2016 continues to anchor fire and life-safety obligations for high-rise assets, while energy-efficiency expectations are reinforced through Bureau of Energy Efficiency codes and client-side ESG disclosure. This includes SEBI-led energy-use reporting requirements for large listed companies, which is pushing demand for metering, dashboards, and documented operating procedures.
In 2026, multiple central actions added new compliance layers relevant to FM contractors and property operators. The Ministry of Labour and Employment notified the Occupational Safety, Health and Working Conditions (Central) Rules, 2026, superseding several legacy rules, including the Contract Labour (Regulation and Abolition) Central Rules, 1971. This raises the bar for standardized EHS processes and contractor management. TRAI issued the Rating of Properties for Digital Connectivity (Amendment) Regulations, 2026 (effective May 13, 2026), introducing structured assessment for under-construction properties and optional digital connectivity audits, which expands the FM remit toward in-building telecom readiness. DPIIT also notified the Transition Facilitation (Quality Control) Order, 2026, creating an alternative compliance pathway for selected Quality Control Orders that cover equipment commonly procured in building operations such as air conditioners and household electrical appliances, affecting procurement documentation and supplier qualification.
Value Chain Analysis
The India facility management value chain begins with upstream inputs (facility labor, consumables, equipment spares, and OEM service ecosystems for HVAC, fire systems, elevators, BMS, and power backup) and moves into on-site delivery through either single-service vendors, bundled contracts, or integrated facility management (IFM). Large buyers, especially Grade A offices and industrial campuses, increasingly separate CAFM/CMMS and IoT platform procurement from manpower delivery to retain control over data architecture and cybersecurity. They then ask service providers to integrate work orders, asset telemetry, and compliance reporting into client systems.
Midstream, national and regional IFM players build multi-skill delivery teams and subcontract specialized scopes (façade access, deep cleaning, pest control, and select MEP jobs) while using centralized command centers and field mobility to manage multi-site SLAs. Downstream, enterprise and institutional clients contract directly and assess vendors on measurable outcomes such as uptime, energy optimization, and audit readiness, with procurement shaped by standards and codes referenced in tenders (including BIS-aligned product requirements, BEE-linked efficiency expectations, and National Building Code 2016 fire-safety practices). Execution bottlenecks still center on technician availability (HVAC/BMS) and the ability to standardize compliance across dispersed sites, which tends to favor providers with training pipelines, pan-India recruitment engines, and proven technology integration.
Competitive Landscape
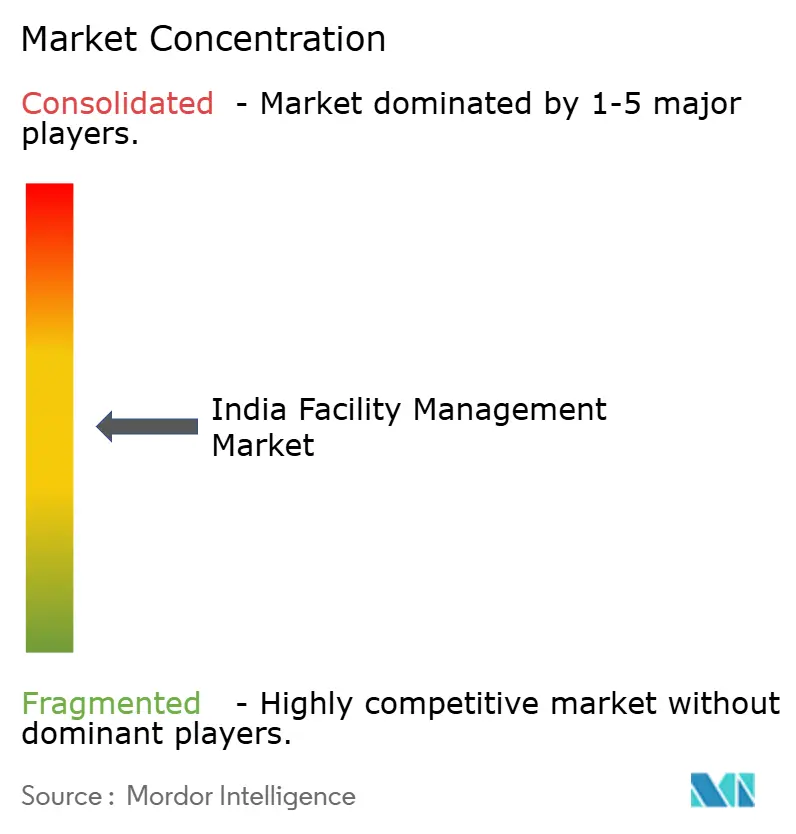
Top 10 players captured about 35%-40% of 2025 revenue, indicating moderate concentration. Multinationals ISS and Sodexo compete with domestic groups Quess, BVG India and Dusters Total, while real-estate advisers CBRE, JLL and Knight Frank cross-sell IFM alongside brokerage. Technology stands out as a differentiator: ISS opened a USD 15 million command center in Mumbai for remote asset monitoring. CBRE launched a healthcare vertical with Apollo Hospitals, installing IoT BMS across 2.5 million sq ft.
Quess, the largest domestic employer, reported INR 5,451 crore (USD 654 million) revenue in Q2 FY25, with double-digit growth in IFM. BVG India won state hospital contracts for HVAC monitoring and biomedical waste. Knight Frank bought a Pune-based industrial FM firm, adding 10 million sq ft of managed space.
Emerging disruptors deploy proprietary IoT devices, AI analytics and tenant apps. Yet capital demands and data-integration concerns limit scale for pure-tech entrants, favoring hybrids that blend digital platforms with on-ground execution. Vendors race to embed ESG measurement dashboards to align with SEBI’s Business Responsibility and Sustainability Reporting, a capability now central in RFP scoring.
India Facility Management Industry Leaders
ISS Facility Management
Sodexo Facilities Management Services India Pvt. Ltd.
Quess Corporation
Updater Services Pvt. Ltd.
BVG India Ltd.
- *Disclaimer: Major Players sorted in no particular order

Market Opportunities and Future Outlook
A whitespace is forming around measurable, audit-ready FM services that combine hard services, energy management, and digital compliance into outcome-based IFM contracts. Demand is being pulled by Grade A office additions, with more than 79 million sq ft completed during 2025, that specify smart meters, LEED/IGBC-aligned features, and fire-safety systems aligned with the National Building Code 2016. Industrial projects also add momentum through schemes such as PLI that require cleanroom routines and uninterrupted power. Providers that can bundle MEP, fire and safety, indoor-air monitoring, and reporting into performance-linked SLAs are being selected more often as landlords embed energy-performance guarantees and clients request real-time dashboards.
Regulatory and quasi-regulatory shifts also create service-led opportunities tied to compliance operations rather than basic staffing. TRAI’s Rating of Properties for Digital Connectivity (Amendment) Regulations, 2026 expands the scope of building readiness checks and optional connectivity audits, which supports coordinated in-building digital infrastructure maintenance alongside traditional FM. The Ministry of Labour and Employment’s Occupational Safety, Health and Working Conditions (Central) Rules, 2026 increases the need for standardized contractor governance, EHS documentation, and digitized workforce records, which benefits organized players with integrated HR-payroll, training, and site-audit tooling. On the buyer side, investments such as ISS’s Mumbai command center (USD 15 million) and CBRE’s healthcare vertical with Apollo Hospitals (IoT BMS across 2.5 million sq ft) indicate that customers are paying for centralized monitoring, sector-specialized SOPs, and tech-enabled delivery models, not just labor hours.
Recent Industry Developments
- May 2026: Sodexo India commenced operations at a new high-capacity MasterKitchen in Sector 37, Gurugram, expanding its centralized food-services capability for corporate and institutional accounts. The facility supports scale delivery and tighter process control, strengthening Sodexo’s ability to bundle food with integrated workplace services in North India.
- January 2026: Quess Corporation secured INR 250 crore (USD 30 million) in multi-year Tier-2 integrated facility management contracts across Ahmedabad, Jaipur, and Kochi. The wins deepen Quess’s footprint in fast-growing secondary markets where turnkey IFM adoption is rising and increase competitive pressure on smaller regional vendors.
- October 2025: ISS Facility Services invested USD 15 million in a Mumbai command center for 24-hour remote asset monitoring and oversight. This upgrade strengthens ISS’s ability to deliver outcome-based SLAs across multi-site portfolios by combining centralized analytics with on-ground execution.


Research Methodology Framework and Report Scope
Market Definition and Coverage
This market covers paid services that keep buildings and sites running safely and smoothly in India, including on-site operations, maintenance, and support work delivered through in-house teams or outsourced partners.
Scope exclusions: We exclude informal, unrecorded household help and ad hoc handyman work that is not contracted as a facility management service.
Segmentation Overview
- By Service Type
- Hard Services
- Asset Management
- MEP and HVAC Services
- Fire Systems and Safety
- Other Hard Facility Management Services
- Soft Services
- Office Support and Security
- Cleaning Services
- Catering Services
- Other Soft Facility Management Services
- Hard Services
- By Offering Type
- In-house
- Outsourced
- Single Facility Management
- Bundled Facility Management
- Integrated Facility Management
- By End-User Industry
- Commercial
- Hospitality
- Institutional and Public Infrastructure
- Healthcare (Public Facilities, Private Facilities)
- Industrial and Process
- Other End-User Industries
Data Sources, Market Sizing, and Validation
Desk Research
Desk work was used to build the starting structure for the India facility management model and to set guardrails on what should be counted as market revenue. We relied on public sources such as India's Ministry of Statistics and Programme Implementation, Central Public Works Department tender disclosures, and Reserve Bank of India macro series to understand construction stock growth, services inflation, and spending trends.
To connect the demand pool with service revenues, we also reviewed sources such as Energy Efficiency Services Limited programs, Bureau of Energy Efficiency guidance (where it signals retrofit activity), and industry association publications on commercial real estate, industrial parks, and healthcare facilities. Company annual reports, investor decks, and credible business press were used to capture outsourcing shifts and contract language. Where needed, a paid subscription database was used only for company financials, contract announcements, and patent look-ups tied to maintenance tools. The desk sources listed here are illustrative, and many other public documents and datasets were also checked for collection, validation, and clarification.
Primary Interviews and Surveys
Primary conversations helped us pressure-test the service boundary and the real billing mechanics in India, since contract scopes can differ a lot across sites. We spoke with service providers, building owners, and procurement and site operations teams across key metros and industrial clusters to confirm outsourcing rates, typical contract tenures, and how hard and soft services are bundled (or kept separate) in practice.
Distribution of primary research fieldwork respondents
| Company type | Respondent position | Region |
|---|---|---|
| Top tier: 31% | CXOs: 17% | |
| Mid tier: 49% | Functional/Unit leaders: 24% | |
| Smaller Players: 20% | Managers: 59% |
Market-Sizing & Forecasting
Sizing starts with a top-down build where commercial, institutional, industrial, and hospitality facility stock in India is converted into an addressable services spend using observed outsourcing penetration and service intensity by facility type. After the first pass, the totals are checked with selective bottom-up approximations, such as sampled contract values, provider revenue splits, and typical price-per-area or price-per-site ranges, and then adjusted where the story does not align.
A few practical inputs kept the model grounded, including growth in built-up area and occupied space, mix shifts between hard services and soft services, staffing intensity and wage inflation for outsourced manpower, MEP and HVAC maintenance cycles, and the rate at which sites move from single service contracts to bundled or integrated setups. Forecasting was done using scenario analysis, because outsourcing behavior and pricing can change quickly with compliance needs and customer cost pressure. Scenarios were anchored on expected real estate additions, services inflation, and contract rebidding dynamics that were repeatedly highlighted in interviews, and gaps in provider disclosures were handled using conservative ranges that were cross-checked with buyer-side procurement benchmarks.
Data Validation & Update Cycle
Validation is done by comparing the model outputs with independent signals such as commercial real estate activity, construction completion trends, services CPI movement, and major multi-site contract announcements. When a number looks off, the assumptions are reopened, and specific follow-up calls are triggered to confirm whether the issue is scope, pricing, or penetration.
Before sign-off, the work goes through step-by-step analyst reviews that check arithmetic, currency consistency, and whether year-to-year movements match real operating conditions. Reports are refreshed annually, and interim updates are made when material events happen, such as policy shifts, sharp wage changes, or a visible change in outsourcing patterns. Right before delivery, we do a final pass so the published view reflects the latest available updates.
Mordor Intelligence's India Facility Management Market Size Compared With Other Published Estimates
Published market sizes for India facility management can be far apart, and this usually happens because the service boundary is drawn differently and the revenue base is not built from the same demand signals. Another common driver is whether the estimate treats in-house delivery as part of the market or counts only outsourced contracts.
By tracking contract scope language, refreshing pricing ranges by service line, and then testing the totals against demand-side facility counts, Mordor Intelligence keeps the 2025 value tied to hard and soft FM delivered through both in-house and outsourced models, which can widen the gap versus studies that count only a narrow subset of outsourced services.
Benchmark comparison
| Source | Market Size | Gaps in Research Methodology |
|---|---|---|
| Mordor Intelligence | USD 80.73 B (2025) | |
| Industry Publisher A | USD 2.86 B (2025) | Often reflects only organized, outsourced soft services revenue, and it typically excludes in-house delivery and several hard services line items that are material in multi-site contracts. |
| Industry Publisher B | USD 3.14 B (2025) | Commonly applies a narrow definition focused on contracted FM services, with limited visibility on integrated bundles and limited checks against facility stock and service-intensity differences by end user. |
The spread in the table mainly points back to what is counted as facility management in India and how strongly the estimate is tied to facility stock and contract realities. When the scope is stated clearly and the pricing and penetration assumptions are checked against buyer and provider inputs, the market total becomes easier to reproduce and to explain on a year-by-year basis.


Key Questions Answered in the Report
How large will facilities outsourcing become in India by 2031?
Outsourced integrated contracts are forecast to reach nearly one-third of the India facility management market by 2031, expanding at 9.03% annually as corporations shift from in-house delivery.
Which end-user vertical is set to grow the fastest?
Healthcare facilities, boosted by the Ayushman Bharat Health Infrastructure Mission, are advancing at a 9.42% CAGR through 2031, outpacing all other segments.
What role does technology play in Indian FM contracts?
IoT sensors, AI analytics and digital twins now underpin outcome-based agreements, helping providers commit to 99.5% uptime and double-digit energy savings.
Why are hard services growing quicker than soft services?
Regulatory fire-safety retrofits, energy-efficiency mandates and predictive-maintenance adoption drive an 8.37% CAGR for hard services, above the market average.
Which cities outside the six metros offer expansion potential?
Tier-2 hubs such as Ahmedabad, Jaipur, Kochi and Chandigarh show 15%-18% office-leasing growth, making them prime targets for new integrated FM contracts.
How is ESG influencing vendor selection?
Corporates subject to SEBI sustainability reporting favor providers that supply real-time carbon dashboards and ISO 50001 advisory, boosting demand for green FM capabilities.
Page last updated on:


