
India Electrical Enclosures Market Size and Share
Market Overview
| Study Period | 2020 - 2031 |
|---|---|
| Forecast Data Period | 2026 - 2031 |
| Historical Data Period | 2020 - 2024 |
| Growth Rate | 5.31 % |
| Market Concentration | Medium |
Major Players *Disclaimer: Major Players sorted in no particular order Image © Mordor Intelligence. Reuse requires attribution under CC BY 4.0. | |
India Electrical Enclosures Market Analysis by Mordor Intelligence
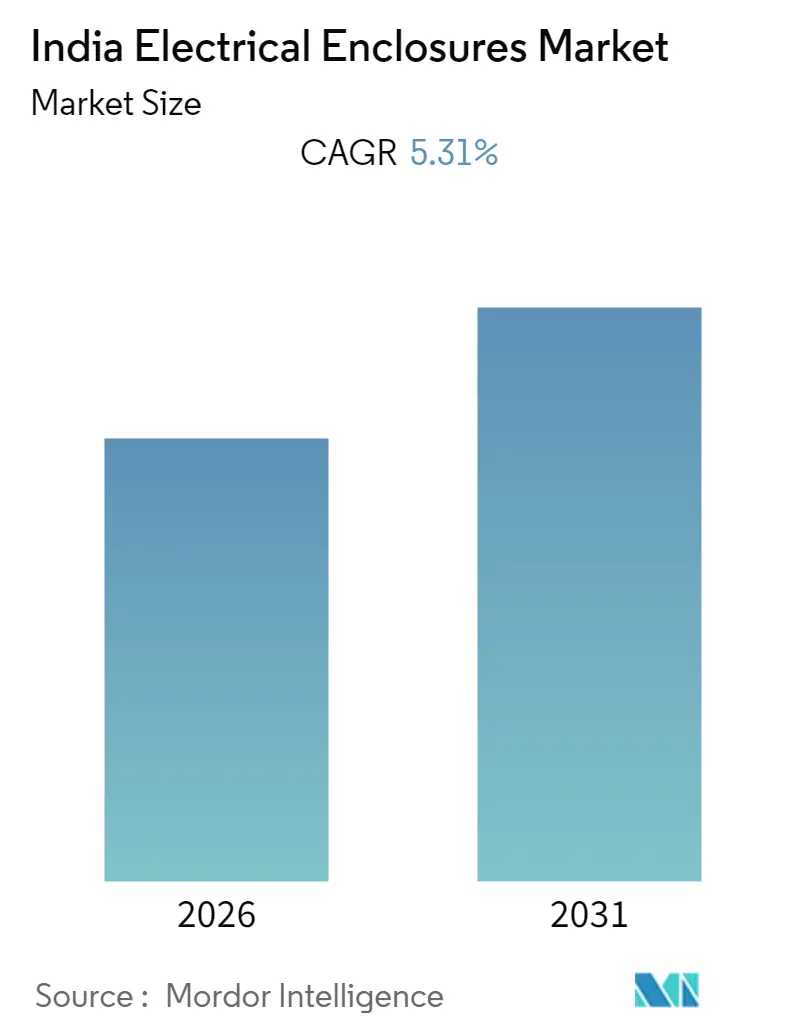
India electrical enclosures market size is expected to register a CAGR of 5.31% during the forecast period.[1] Rapid grid-modernization programs, hyperscale data-center expansion, and stringent fire-safety regulations are accelerating procurement of robust, smart, and weather-resistant enclosures. Accelerating state-utility CAPEX exceeding INR 1 lakh crore, particularly for 765 kV transmission corridors, is lifting unit volumes, while mix shifts toward higher-spec metallic designs sustains value growth. Hyperscale facilities scaling from 1,150 MW in 2024 to an expected 2,100 MW by 2027 are driving fresh demand for IP54-plus, thermally managed cabinets, especially in Mumbai, Chennai, and Hyderabad.[2] Compliance with the National Building Code 2016 is stimulating retrofit orders across hospitals, schools, and public offices, and Indian Railways’ 98% network electrification milestone is underpinning recurring maintenance demand. Together, these vectors create a multi-year runway for the India electrical enclosures market amid moderate competitive intensity and increasing localization incentives.
Key Report Takeaways
- By application, power generation and distribution commanded 29.05% of the India electrical enclosures market share in 2025, while commercial buildings and data centers are expanding at an 7.88% CAGR through 2031.
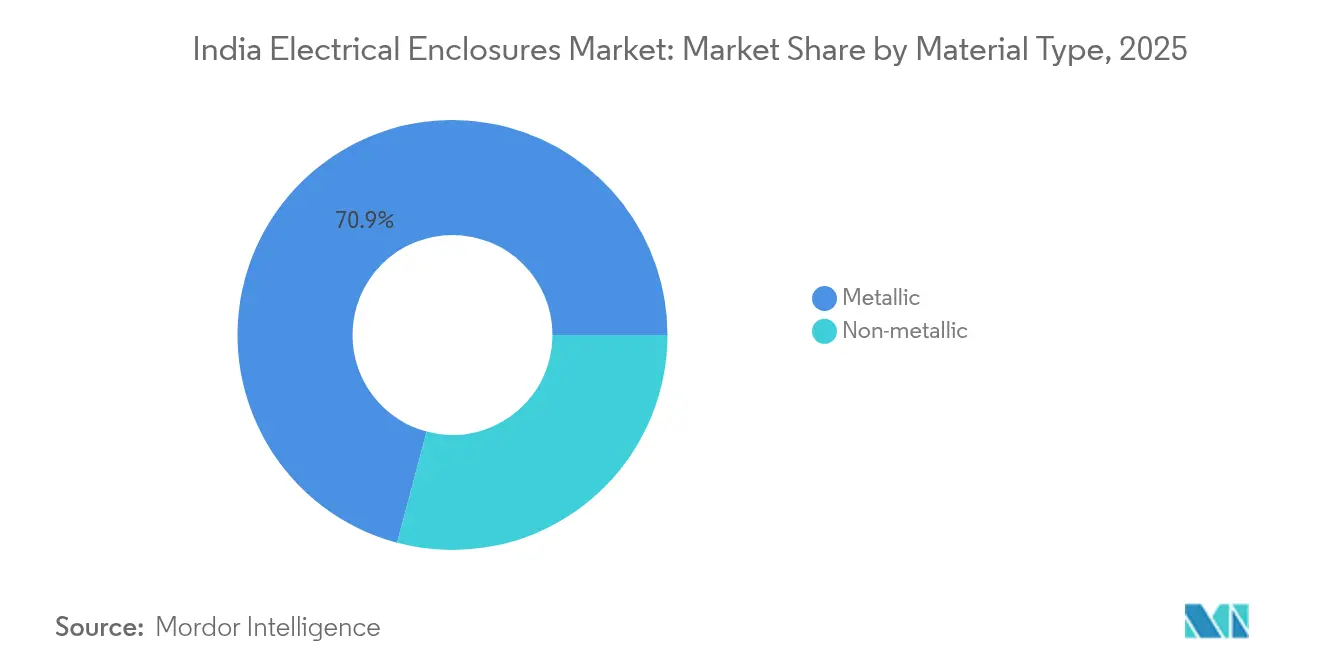
- By material type, metallic solutions captured 70.85% market share of the India electrical enclosures market size in 2025. Non-metallic alternatives are projected to log a 7.42% CAGR to 2031.
- By form factor, wall-mount units led with 36.25% share in 2025; modular and custom formats are forecast to grow at 6.98% CAGR.
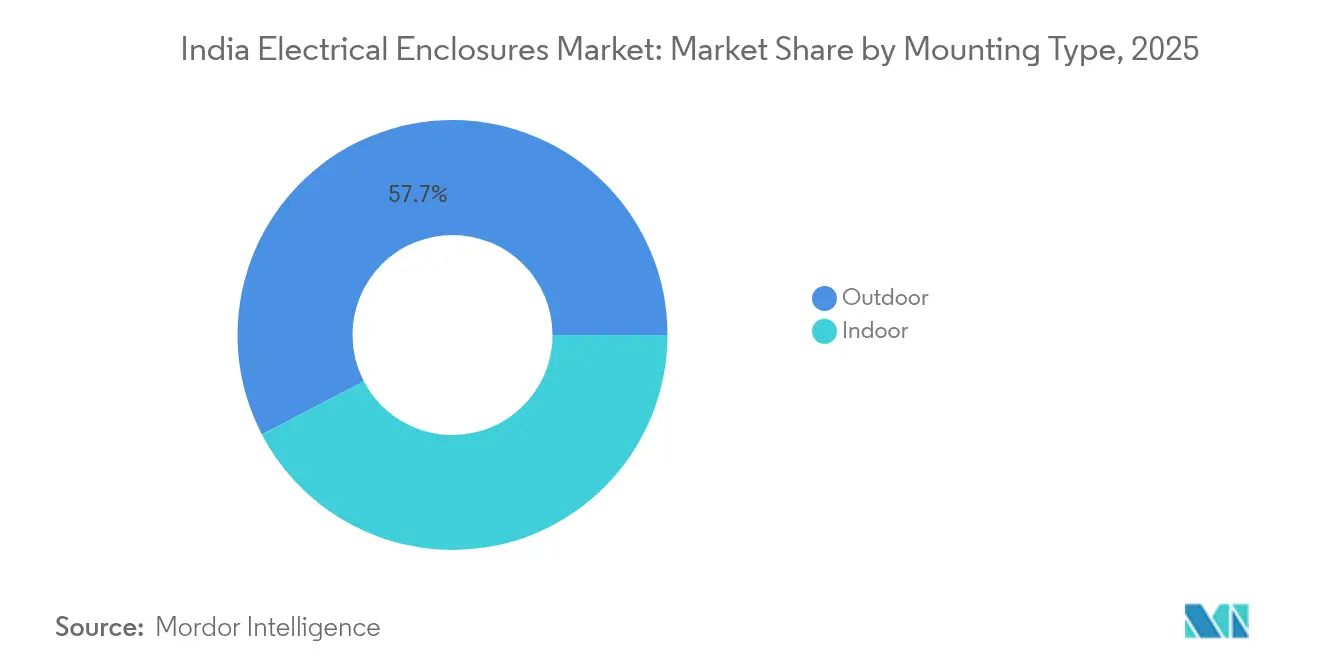
- By mounting, outdoor installations accounted for a 57.65% share of the India electrical enclosures market size in 2025 and are set to rise at a 6.62% CAGR.
Note: Market size and forecast figures in this report are generated using Mordor Intelligence’s proprietary estimation framework, updated with the latest available data and insights as of 2026.
India Electrical Enclosures Market Trends and Insights
Drivers Impact Analysis*
| Driver | (~) % Impact on CAGR Forecast | Geographic Relevance | Impact Timeline |
|---|---|---|---|
| Surging grid-modernization CAPEX by state utilities | +1.20% | National, with concentration in Gujarat, Maharashtra, Tamil Nadu | Medium term (2-4 years) |
| Rising hyperscale data-centre build-outs | +0.90% | National, with early gains in Mumbai, Chennai, Hyderabad | Short term (≤ 2 years) |
| Mandatory fire-safety upgrades in public buildings (NBC-2016) | +0.70% | Urban centers, particularly Delhi NCR, Mumbai, Bangalore | Medium term (2-4 years) |
| Rapid electrification of Indian Railways | +0.60% | National rail network, concentrated in northern and eastern corridors | Long term (≥ 4 years) |
| Production-Linked Incentive push for switch-gear localisation | +0.50% | Manufacturing hubs in Gujarat, Tamil Nadu, Karnataka | Medium term (2-4 years) |
| Growth of rooftop-solar OandM ecosystem | +0.40% | Solar-rich states including Rajasthan, Gujarat, Maharashtra | Long term (≥ 4 years) |
| Source: Mordor Intelligence | |||
Surging Grid-Modernization CAPEX by State Utilities
State electricity boards are channelling record investments into high-voltage corridors, with the central allocation of INR 1 lakh crore for inter-state transmission alone. Gujarat’s INR 15,000 crore upgrade plan typifies the scale, necessitating larger IP65-rated housings for protection relays along new 765 kV lines. Demand rises for galvanized steel and aluminium cabinets with advanced climate controls, propelling both volumes and average selling prices within the India electrical enclosures market. Vendors able to certify products under BIS IS 2147 and integrate smart-grid sensors see heightened tender success. As installations shift from indoor substations to space-saving outdoor yards, corrosion-resistant coatings and dual-door sealing emerge as key differentiators. The medium-term impact is significant, sustaining a solid order pipeline for principal OEMs.
Rising Hyperscale Data-Centre Buildouts
Total installed IT load is projected to grow from 1,150 MW in 2024 to 2,100 MW by 2027, doubling enclosure demand for high-density power distribution units, bus-ducts, and battery-backup switchboards. Hyperscale specifies modular steel frames with integrated thermal barriers and cable management to handle rack densities above 10 kW. Procurement cycles are rapid, favouring suppliers that keep local assembly lines agile and inventory buffered. Because uptime requirements exceed 99.999%, operators insist on IP54-plus sealing, dual-redundant cooling fans, and digital trip breakers pre-fitted into enclosures. Tier-1 cities remain the launch pads, but edge nodes in Tier-2 markets now drive incremental volumes. Short-term uplift is pronounced as pre-committed hyperscale capacity converts to civil works and electrical fitouts.
Mandatory Fire-Safety Upgrades in Public Buildings (NBC-2016)
NBC-2016 compliance checks gained momentum after 2024, compelling hospitals, schools, and malls to replace outdated distribution boards with flame-retardant, compartmentalized enclosures.[3] Retrofit projects favour powder-coated steel bodies rated to 960°C glow-wire tests and fitted with automatic fire-damper assemblies. Because many public buildings remain occupied during works, compact wall-mount designs that minimize downtime are preferred. BIS-certified manufacturers have a clear advantage as municipal auditors mandate visible ISI stamping. The regulatory drive marginally lifts CAPEX for facility owners yet unlocks a robust, mid-ticket order stream for enclosure suppliers into 2027.
Rapid Electrification of Indian Railways
With 98% of route kilometres now under electric traction, attention turns to maintenance and capacity-boost projects such as dedicated freight corridors. Railways specify high-vibration-resistance enclosures for traction substations, signalling huts, and level-crossing panels.[4] Requirements include IP66 sealing, stainless-steel hinge, and EMI shielding. Indigenous value addition is encouraged under the Production-Linked Incentive scheme, giving local fabricators access to long-term rate contracts. The long-term nature of rail projects provides revenue visibility, while safety audits ensure recurring retrofit cycles.
Restraints Impact Analysis*
| Restraint | (~) % Impact on CAGR Forecast | Geographic Relevance | Impact Timeline |
|---|---|---|---|
| Steel and aluminium price volatility | -0.80% | National, with higher impact in manufacturing hubs | Short term (≤ 2 years) |
| Proliferation of counterfeit IP-rated products | -0.60% | National, concentrated in unorganized market segments | Medium term (2-4 years) |
| Fragmented state-level certification regimes | -0.40% | State boundaries, particularly affecting inter-state projects | Medium term (2-4 years) |
| Supply-chain bottlenecks for silicone gaskets | -0.30% | National, with acute impact on coastal and chemical applications | Short term (≤ 2 years) |
| Source: Mordor Intelligence | |||
Steel and Aluminium Price Volatility
HRC steel swung by INR 3,000 per tonne during 2024 as anti-dumping duties on Chinese supply intersected with fluctuating coking-coal costs. Aluminium premiums tracked LME spikes driven by energy-price volatility. Smaller enclosure shops operating on quarterly rate contracts struggle to hedge, forcing margin resets or component downsizing. Some OEMs responded by redesigning side-panels at 1.6 mm thickness versus 2 mm, a trade-off that risks stiffness in larger cabinets. Elevated raw-material risk deters long-duration fixed-price bids, delaying awards on state-utility tenders. Although volatility should moderate past 2026, near-term headwinds shave 80 basis points off CAGR forecasts.
Proliferation of Counterfeit IP-Rated Products
BIS raids on e-commerce warehouses seized over 10,000 fake IP-marked enclosures in 2024, revealing widespread forgery of ISI logos and test certificates. Substandard units corrode prematurely, spark short circuits and erode customer confidence. Legitimate vendors incur additional costs for holographic labels and QR-code tracing while price-cutting rivals flood low-awareness industrial clusters. Installation contractors face liability exposure, tightening their approved vendor lists and, over time, restoring share to compliant producers. Until enforcement fully scales, counterfeit penetration remains a material drag on revenue realization.
*Our forecasts treat driver/restraint impacts as directional, not additive. The impact forecasts reflect baseline growth, mix effects, and variable interactions.
Segment Analysis
By Material Type: Metallic Endurance Versus Non-Metallic Momentum
Metallic housings held 70.85% India electrical enclosures market share in 2025, with galvanized steel dominating traction substations and high-current switchboards. The India electrical enclosures market size for metallic products was USD 186.39 million in 2025 and is projected to expand at 4.78% CAGR to 2031. Aluminium earns favour in rooftop solar combiner boxes where weight matters. Rising OPEX on anti-corrosion repainting is nudging coastal utilities toward fiberglass and polycarbonate alternatives that clock a 7.42% CAGR. Non-metallic cabinets also absorb less heat, benefitting data-hall aisle containment. Schneider’s Kolkata polymer plant and ABB’s Vadodara FRP line illustrate supplier bets on composite growth. Imported resin costs and BIS IS 14772 testing fees keep unit prices at a 15-20% premium, yet total-cost-of-ownership analyses still tilt some specifiers toward polymer choices in saline or chemical environments.
Second-generation engineering plastics are now meeting vertical-flame and UV-aging standards, underscoring their readiness for utility deployments. Polycarbonate molds allow ergonomic latch integration and transparent doors for quick visual inspection, perks that bolster occupational safety audits. Conversely, metallic cabinets remain unrivalled for electromagnetic shielding when sensitive SCADA relays share space with high-fault-current busbars. The balance of use-cases points to sustained metallic dominance but with growing composite niches in coastal and data infrastructure.

By Form Factor: Wall-Mount Stability with Modular Upside
Wall-mount products accounted for 36.25% of 2025 shipments and remain indispensable for distribution-panel retrofits in commercial towers and metro stations. Their compact footprint, hinged doors, and rear cable entry simplify tenant fit-outs. Meanwhile, modular aisle-based systems are surging at 6.98% CAGR as hyperscale operators pre-fabricate skids populated with MCCBs, transformers, and monitoring PLCs off-site. Like-for-like price premiums of 25% are offset by 35% faster go-live timelines, a metric valued by colocation providers chasing occupancy SLAs.
Free-standing floor cabinets service substations, steel mills, and wastewater plants where heavy gear and large-cross-section busbars require bottom cable entry and plinth-mount anchoring. Junction-box volumes track rooftop solar rollouts, especially in Rajasthan and Gujarat. For OEMs, form-factor diversification underpins cross-selling: Schneider’s Prisma-Plus lends wall-mount segments while the SM AirSeT draws floor-mount demand. System integrators increasingly issue framework bids bundling multiple form factors, rewarding suppliers with broad catalogues and standardized internal mounting grids.
By Mounting Type: Outdoor Builds Dominate
Outdoor units contributed 57.65% of 2025 revenues, with the India electrical enclosures market size in this segment projected at USD 222.58 million by 2031, rising 6.62% CAGR. IP66 sealing, triple-layer powder coatings, and 1,000-hour salt-spray ratings differentiate leading offers. Smart-city pole-top controllers, EV-charger feeders, and rail-signalling huts all add to the outdoor tally. Vendors craft cooling strategies ranging from passive sunshields to thermoelectric units integrated behind double walls.
Indoor cabinets persist in data centers, hospitals, and process plants where HVAC environments let thinner-gauge sheet metal and natural convection suffice. NBC-2016 drives fire-retardant powder types and smoke-tight gasketing for indoor boxes in public structures. Hybrid configurations are surfacing outdoor primary breakers feeding indoor secondary panels interconnected by pre-terminated armoured cables. Such system-level selling unlocks bundle margins and demand visibility for enclosure manufacturers.
By Application: Power Leads While Digital Transformation Accelerates
Power generation and T&D installations owned a 29.05% share of 2025 shipments, equating to USD 76.46 million of the India electrical enclosures market size. Transmission mega-projects require skid-mounted protection panels and line-monitoring cabinets, typically 3 mm steel with anti-condensation heaters. Renewable assets layer additional orders for inverter MV isolator boxes and string combiner casings.
Commercial buildings and data centers post the fastest 7.88% CAGR, fuelled by enterprise cloud migration, fintech adoption, and OTT streaming traffic. Each incremental megawatt of IT load translates to roughly 22 wall-mount or aisle-containment enclosures for PDU, UPS bypass, and battery monitoring functions. Transportation applications—metro rail, airports, highways—are steady, whereas oil and gas demand hinges on capex cycles in refinery revamps. Process industries gradually standardize on stainless-steel NEMA 4X boxes to meet GMP and FDA cleanliness mandates. Collectively, this diversity shields the India electrical enclosures market against single-sector downturns.
Geography Analysis
Maharashtra generates the highest consumption, anchored by Mumbai’s data-center corridor and Pune’s automotive belt. Policy support via the state’s Information Technology Investment Region further entices hyperscale’s, translating into sizable wall-mount and modular rack orders. Gujarat follows, driven by 10 GW-plus solar farms in Kutch and robust port-led industrialization along the Dholera SIR; corrosion-proof FRP cabinets are routine here. Tamil Nadu leverages its automotive OEM hub and 15-GW wind base, while Karnataka rides Bengaluru’s tech sector and startup ecosystem, stimulating low-to-mid current panel needs.
Northern cluster demand stems from Delhi NCR’s metro expansion and smart-grid pilots around Noida and Gurugram. Haryana’s IMT Manesar auto component park adopts advanced busbar enclosures, and Uttar Pradesh channelizes capex toward expressway electrification. Extreme summer heat drives the selection of light-coloured powder coats and solar-reflective roofs.
Eastern states such as West Bengal and Odisha clock rising uptake from steel, aluminium, and petrochemical complexes. Coastal humidity pushes specifiers toward 316-grade stainless or UV-stabilized polymers, mitigating rust in saline air. Government port-modernization spend amplifies the requirement for marine-grade, IP67 junction boxes on jetties and crane feeds.
Regulatory Landscape
ISI marking and BIS certification remain central for enclosures, with IS 14772:2020 specifying boxes and enclosures for electrical accessories, covering material, construction, performance and IP ratings. The Ministry of Heavy Industries notifies compulsory certification for Low-Voltage switchgear and controlgear assemblies, which feeds into enclosure compliance requirements. The National Electrical Code of India 2023 (SP 30:2023) also codifies installation practices across building and industrial contexts, reinforcing safety and workmanship expectations for distribution boards and enclosures.
Competitive Landscape
Multinationals and domestic majors jostle in a market where the top five combined held roughly 38% share in 2024, indicating moderate fragmentation. Schneider Electric’s fresh 1.2 million sq. ft greenfield campuses at Hyderabad and Ahmednagar will expand sheet-metal punching and polymer injection capacity, shaving lead times for export as well as domestic buyers. ABB India leverages its Bengaluru digital hub to integrate predictive-maintenance sensors into cabinets, bundling hardware with cloud analytics. Siemens is pouring INR 1,000 crore into clean-air switchgear lines at Aurangabad, embedding SF6-free breaker modules into its enclosure suites.
Larsen and Toubro couples EPC wins with captive enclosure supply, recently securing INR 2,500 crore grid-modernization packages spanning Gujarat to Rajasthan. Tier-2 regional fabricators, often family-owned, prosper in contract manufacturing for OEM brands, yet counterfeit risks and tightening BIS audits may thin their ranks. Technology differentiation centers on IoT gateways, arc-flash sensors, and modular design libraries that allow late-stage customization without tooling alterations.
Government localization mandates and RoDTEP export incentives spur capacity additions, but raw-material volatility and widening compliance demands test capital discipline. M&A opportunities surface as multinationals scout specialty FRP formulators and gasket suppliers to secure upstream inputs.
India Electrical Enclosures Industry Leaders
-
BCH Electric Ltd
-
Schneider Electric
-
ABB Ltd
-
Eaton Corporation
-
Emerson Electric
- *Disclaimer: Major Players sorted in no particular order

Market Opportunities and Future Outlook
Grid modernization and hyperscale data-center expansion are creating demand for rugged outdoor enclosures with IP65/IP66 protection and more refined thermal management. Investment in the power sector reaches USD 500 billion planned by 2032, including USD 100 billion for Transmission and Distribution by 2027, while 765 kV corridors broaden the addressable scope for enclosure size and edge deployments. Total installed IT load is projected to grow from 1,150 MW in 2024 to 2,100 MW by 2027, supporting higher-density, IP-rated cabinets in urban centers and along data-center corridors.
Domestic buyers are also tightening specifications through localization mandates and the Production-Linked Incentive push for switchgear localisation. ABB’s USD 75 million India investment to expand manufacturing and R&D, along with Schneider Electric's Innovation Summit India 2026 highlighting new smart enclosure solutions, point to growing local supply capacity aimed at local-for-local readiness.
Recent Industry Developments
- April 2026: Schneider Electric held Innovation Summit India 2026 showcasing 400+ technologies and 30 new solutions including low-voltage panels and meters. The event highlights the breadth of offerings for the Indian enclosure market and adds reference architectures for smart enclosures. The expansion strengthens Schneider Electric's local product portfolio to meet rising data-center and infrastructure demand.
- March 2026: ABB invests USD 75 million in India to expand manufacturing and R and D, including a 14 million USD expansion at Nelamangala campus. The investment increases domestic production capacity for enclosures and related components. The move supports local for local growth and shorter lead times in the Indian electrical enclosures ecosystem.
- January 2026: ABB India launches ArTu Formula Low Voltage Switchgear. The launch adds LV switchgear within the enclosure ecosystem and expands the portfolio. It supports safer, smarter power distribution in industrial and commercial segments.
Research Methodology Framework and Report Scope
Market Definition and Coverage
This market covers the sales value of electrical enclosures used in India to protect electrical and electronic components from dust, water, touch, and impact in indoor and outdoor settings. It includes commonly used enclosure forms across industrial sites, buildings, utilities, and infrastructure projects.
Scope exclusions: This sizing does not count the value of the internal electrical equipment (such as breakers, relays, meters, wiring, and panels) when it is sold separately from the enclosure.
Segmentation Overview
- By Material Type
- Metallic
- Non-metallic
- By Form Factor
- Wall-mount
- Floor-mount / Free-standing
- Junction / Terminal boxes
- Modular / Custom
- By Mounting Type
- Indoor
- Outdoor
- By Application
- Power Generation and Distribution
- Transportation (Rail, Metro, Airports)
- Oil and Gas
- Commercial Buildings and Data Centres
- Process Industries (FandB, Pharma, Chemicals)
- Others Applications
Data Sources, Market Sizing, and Validation
Desk Research
Desk research is used to map demand signals and the operating context where enclosures are installed, and then to set realistic input ranges before we speak with the market. We refer to public sources such as India's Central Electricity Authority statistics, Ministry of Power updates, Bureau of Indian Standards publications, and MOSPI industrial indicators to track grid additions, industrial activity, and construction momentum.
We also review sources such as trade association updates (for example, electrical equipment bodies), customs trade statistics for relevant metal and polymer inputs, and peer reviewed papers that discuss enclosure materials and safety performance in Indian conditions (heat, dust, and coastal corrosion). Company annual reports, investor decks, and reputable business press are used to cross-check capacity expansions, plant utilization commentary, and pricing direction for fabricated products. Where needed, paid subscriptions for company financials, patent databases, and shipment-level import and export records are used to validate trends without relying on any one document. The desk sources named here are illustrative, and many other sources were also used for data collection, validation, and research clarification.
Primary Interviews and Surveys
Primary work was conducted through expert interviews and structured surveys with enclosure manufacturers, sheet-metal fabricators, channel partners, electrical contractors, EPC teams, and large end users who specify enclosures for projects. These discussions were used to confirm how often stainless steel, galvanized steel, aluminum, and polycarbonate are chosen by application, what typical order sizes look like, and how pricing shifts with IP rating, mounting type, and finishing. Because this is an India-specific market, outreach was spread across major industrial and construction clusters so assumptions reflect regional buying patterns and project pipelines.
Distribution of primary research fieldwork respondents
| Company type | Respondent position |
|---|---|
| Top tier: 28% | CXOs: 12% |
| Mid tier: 56% | Functional/Unit leaders: 38% |
| Smaller Players: 16% | Managers: 50% |
Market-Sizing & Forecasting
Sizing starts from a top-down build where we reconstruct the addressable demand pool using India-specific installation activity in power generation and T&D, industrial capex cycles, and building plus data-center electrical fit-outs, then convert this into enclosure needs using typical enclosure-per-install ratios. The model allocates demand across common material choices and mounting formats using ranges validated in interviews, and then applies a value layer through realistic average selling prices.
To keep the model grounded, we track inputs such as the pace of grid upgrades and substation additions, industrial production trends, construction starts and commercial floor space additions, data-center capacity additions, and the mix shift between metallic and non-metallic enclosures. Price logic is handled through material cost direction (steel and polymers), fabrication complexity (gaskets, hinges, locks, and coating), and specification uplift for outdoor use and higher IP ratings. Results are corroborated with selective bottom-up approximations such as sampled manufacturer revenue splits, distributor channel checks, and a volume times ASP sense-check for high-visibility use cases.
For forecasting, scenario analysis is used so changes in infrastructure spending, private capex, and construction cycles can be reflected without overfitting a short time series. Where direct bottom-up signals are thin for smaller cities or informal fabricators, gaps are filled using calibrated shares from similar states and then re-checked against interview feedback on regional penetration and order flows.
Data Validation & Update Cycle
Outputs are validated through triangulation across at least three angles, which typically include demand pool indicators, pricing checks, and supply-side capacity commentary. If a segment result looks off, we revisit the key drivers, re-check the unit assumptions, and re-contact relevant respondents to understand whether a one-time project, policy change, or pricing shock is driving the variance.
Before sign-off, the model and narrative go through multi-step analyst reviews so calculation logic, units, and currency treatment are consistent across sections. The report is refreshed annually, and interim updates are made when material events occur, such as large grid programs, major capacity additions, or notable shifts in material pricing. Right before delivery, a final pass is completed to align the numbers and commentary with the latest available data signals.
Mordor Intelligence's India Electrical Enclosures Market Sizing Compared With Other Published Estimates
Published market values for India electrical enclosures can differ across sources because the product boundary and pricing treatment are not consistent. Some publications size a broader set of electrical boxes used in buildings, while others focus mainly on industrial and utility-grade cabinets, which changes totals even when the same country is covered.
The benchmark table shows a spread that is largely explained by what gets counted as an enclosure sale, and in Mordor Intelligence's model the value reflects enclosure hardware sold as the protective housing (including common enclosure-tied accessories), while avoiding double counting by excluding internal electrical devices that are frequently priced and procured separately. Differences also come from whether estimates apply a single national ASP without adjusting for outdoor versus indoor specification mix, or they use older base-year pricing that misses recent steel and polymer cost moves in India.
Benchmark comparison
| Source | Market Size | Gaps in Research Methodology |
|---|---|---|
| Mordor Intelligence | USD 277.06 M (2025) | |
| Industry Association A | USD 315.00 M (2025) | Often aggregates junction boxes and certain panel housings into one basket, so internal electrical gear and enclosure value can be mixed and totals can rise. |
| Trade Journal B | USD 240.00 M (2024) | Uses an earlier base year and applies a blended price trend across applications, which can understate the uplift from outdoor and higher-spec orders linked to grid and data-center builds. |
Taken together, the comparison suggests that clear inclusion rules and repeatable ASP build-ups drive most of the gap between published totals. When scope, units, and pricing inputs are documented and then checked with channel and end-user feedback, the final number stays easier to trace and update.
Key Questions Answered in the Report
What is the 2026 value of the India electrical enclosures market?
It is USD 277.06 million, and it is forecast to grow at a 5.31% CAGR to reach USD 358.68 million by 2031.
Which application segment is expanding fastest?
Commercial buildings and data centers show the fastest growth with an 7.88% CAGR through 2031, fueled by hyperscale capacity doubling plans.
How large is the metallic share of shipments?
Metallic housings captured 70.85% India electrical enclosures market share in 2025, thanks to grid and rail projects.
Why are counterfeit products a concern?
BIS seized over 10,000 fake enclosures in 2024, and such products erode revenue and pose safety risks due to substandard ingress protection.
Which regions contribute most to demand?
Maharashtra and Gujarat lead purchases, with Tamil Nadu and Karnataka closely following thanks to renewables, automotive and tech-sector expansion.
What impact do steel prices have on suppliers?
HRC steel swings of INR 3,000 per tonne compress margins and can delay fixed-price tenders, shaving roughly 0.8 percentage points off CAGR forecasts.