
India Electric Vehicle Financing Market Size and Share
Market Overview
| Study Period | 2020 - 2031 |
|---|---|
| Forecast Data Period | 2026 - 2031 |
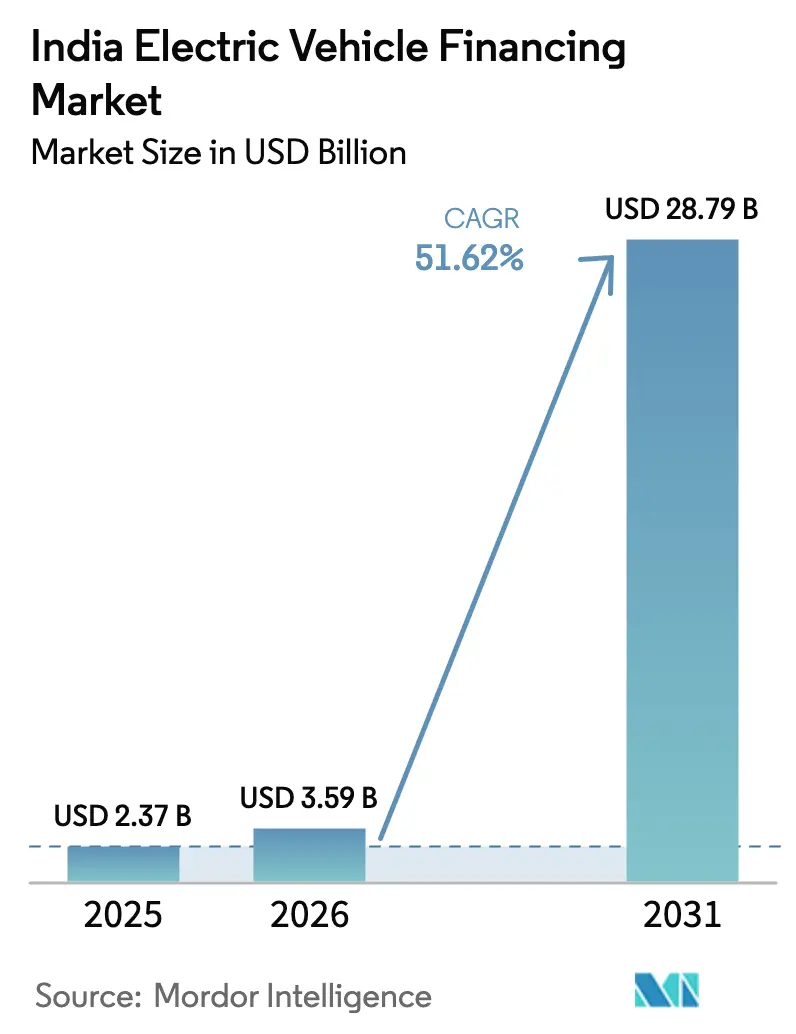
| Base Year Market Size (2025) | USD 2.37 Billion |
| Market Size (2026) | USD 3.59 Billion |
| Market Size (2031) | USD 28.79 Billion |
| Growth Rate (2026 - 2031) | 51.62% CAGR |
| Market Concentration | Medium |
Major Players *Disclaimer: Major Players sorted in no particular order Image © Mordor Intelligence. Reuse requires attribution under CC BY 4.0. | |
India Electric Vehicle Financing Market Analysis by Mordor Intelligence
The India electric vehicle financing market size in 2026 is estimated at USD 3.59 billion, growing from 2025 value of USD 2.37 billion with 2031 projections showing USD 28.79 billion, growing at 51.62% CAGR over 2026-2031. Rising government subsidies, rapid growth in digital lending, and aggressive electrification targets for two- and three-wheeler fleets are converging to unlock unprecedented volumes of credit demand. State–level incentive packages in Maharashtra, Gujarat, and Karnataka amplify federal support and have created localized lending hotspots. Fintech lenders are using AI-driven underwriting to compress approval times from weeks to minutes, eroding the traditional dominance of banks. Institutional capital is crowding in through green bonds and blended-finance vehicles, which are pushing down the overall cost of capital even as credit volumes rise. Heightened policy certainty through the PM E-DRIVE scheme and the Reserve Bank of India’s new Priority Sector Lending limits further reduces risk premiums and encourages product innovation across the India electric vehicle financing market.
Key Report Takeaways
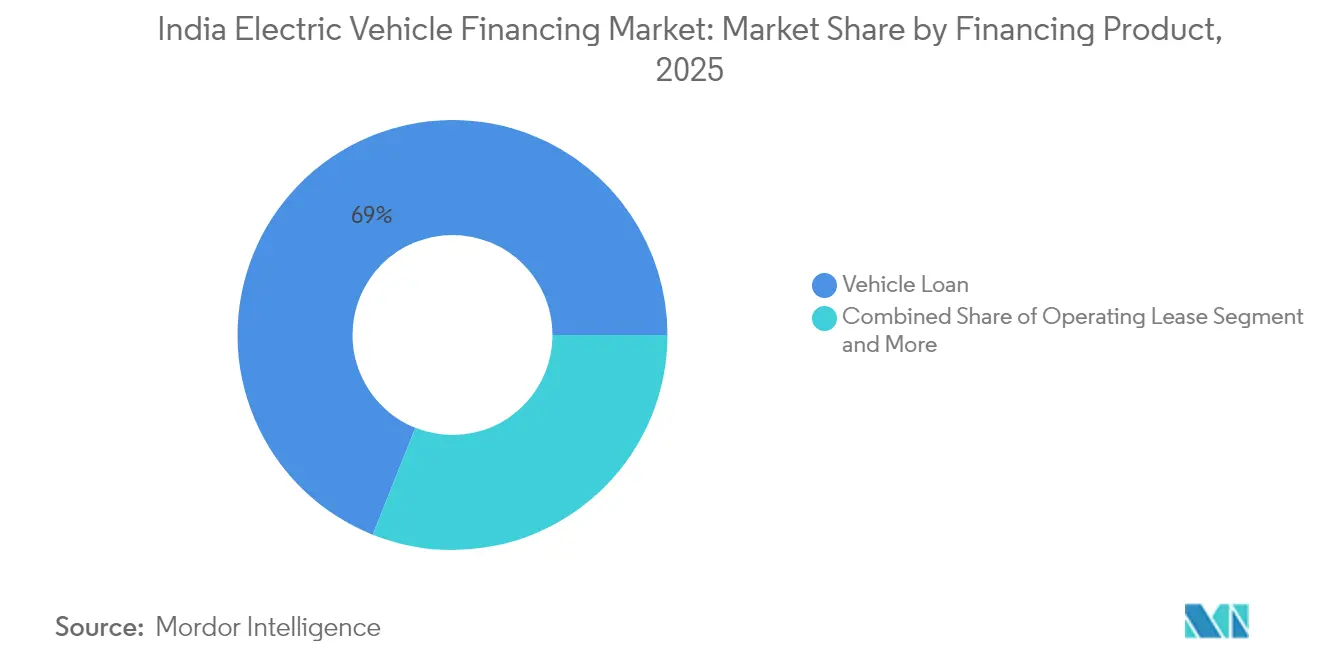
- By financing product, vehicle loans held 68.95% of the India electric vehicle financing market share in 2025, while operating leases are forecast to register the fastest 53.47% CAGR through 2031.
- By type, new vehicles accounted for 64.72% of the India electric vehicle financing market share in 2025, while used vehicles are forecast to register the fastest 54.18% CAGR through 2031.
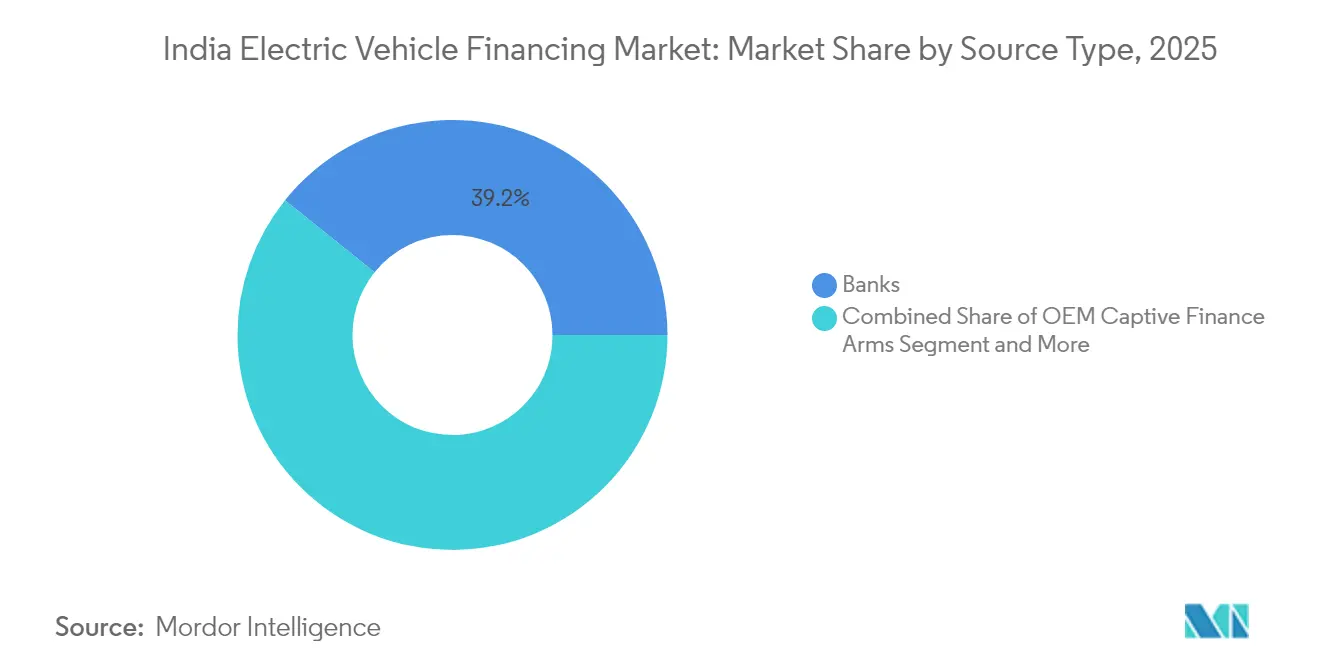
- By source type, banks commanded a 39.21% share of the India electric vehicle financing market size in 2025; fintech companies are advancing at a 52.74% CAGR to 2031.
- By vehicle type, two-wheelers led with 45.90% share of the India electric vehicle financing market size in 2025, whereas three-wheelers are projected to post the strongest 53.66% CAGR during 2026-2031.
Note: Market size and forecast figures in this report are generated using Mordor Intelligence’s proprietary estimation framework, updated with the latest available data and insights as of 2026.
Worldwide, activity is shaped by contributions from multiple countries and regions, with India representing one among them. The global report on electric vehicle financing market by Mordor Intelligence reflects how these countries and regional layers combine into a single system.
India Electric Vehicle Financing Market Trends and Insights
Drivers Impact Analysis*
| Driver | (~) % Impact on CAGR Forecast | Geographic Relevance | Impact Timeline |
|---|---|---|---|
| EV Subsidies and Incentives | +10.5% | National, stronger in Maharashtra, Gujarat, Karnataka | Medium term (2-4 years) |
| Lower Battery Costs Drive EV | +8.2% | Manufacturing hubs in Gujarat, Tamil Nadu | Long term (≥ 4 years) |
| Companies Electrify Fleets Quickly | +7.8% | Delhi NCR, Mumbai, Bangalore, Hyderabad | Short term (≤ 2 years) |
| Fintech Platforms Enable Digital Lending | +6.3% | National, early uptake in Tier-1 and Tier-2 cities | Medium term (2-4 years) |
| Battery-As-A-Service Financing Expands | +4.1% | Pilot zones: Delhi, Mumbai, Pune, Chennai | Long term (≥ 4 years) |
| Green Bonds Lower Capital Costs | +3.2% | National, corporate lending pockets | Medium term (2-4 years) |
| Source: Mordor Intelligence | |||
Government Subsidies and Fiscal Incentives for EVs
The PM E-DRIVE scheme’s INR 10,900 crore (USD 1.31 billion) budget through 2028 directly reimburses manufacturers, which removes the liquidity gap that previously forced buyers to borrow higher loan principals. Maharashtra layers an additional INR 930 per kWh battery capacity subsidy, effectively lowering interest costs by 200-300 basis points for eligible borrowers [1]“Priority Sector Lending Guidelines 2025,” Reserve Bank of India, rbi.org.in. Policy duration to 2028 gives lenders a predictable runway to price multi-year products confidently. State-level fast-lane approvals reduce documentation cycles, further nurturing growth within the India electric vehicle financing market.
Falling Battery Costs Accelerating EV Adoption
Average pack prices declined from USD 137 per kWh in 2024 to a forecast of USD 89 per kWh by 2030, slicing upfront vehicle prices and improving loan-to-value ratios. Localized production under the Production-Linked Incentive scheme trims import reliance, resulting in steadier rupee pricing and enabling fixed-rate products with reduced currency-hedge costs. Two- and three-wheelers, where batteries form up to 40% of on-road cost, feel the greatest impact, unlocking wider borrower pools and enlarging the India electric vehicle financing market size.
Rapid Fleet Electrification by E-commerce and Logistics Firms
Large aggregators are ordering thousands of EVs to reduce delivery costs and meet sustainability pledges. Commercial operators borrow INR 2.5-4 million per vehicle batch, roughly triple a retail ticket, offering higher fee income and asset-backed security opportunities. Usage data from telematics feeds lenders’ risk engines, cutting default rates and attracting mainstream institutional funding into the India electric vehicle financing market.
Fintech-enabled Digital Lending Platforms
Digital lenders leverage utility payments, mobile top-ups, and e-commerce receipts to score thin-file customers, pushing approval rates 60-70% above bank averages. Real-time battery health data informs dynamic rate resets, aligning interest obligations with asset performance. The Reserve Bank of India sandbox lets firms pilot usage-based insurance bundling, fortifying cash-flow certainty and expanding the India electric vehicle financing industry’s product frontier.
Restraints Impact Analysis*
| Restraint | (~) % Impact on CAGR Forecast | Geographic Relevance | Impact Timeline |
|---|---|---|---|
| EV Used Car Values Uncertain | -4.5% | National, sharper in Tier-2 and Tier-3 cities | Medium term (2-4 years) |
| Limited Public EV Charging | -3.8% | Rural and semi-urban belts, North and East | Long term (≥ 4 years) |
| Standardized Battery Health Lacking | -2.1% | Nationwide, all segments | Medium term (2-4 years) |
| Frequent Policy Revisions Raise Costs | -1.7% | National, heavier for smaller lenders | Short term (≤ 2 years) |
| Source: Mordor Intelligence | |||
Uncertain Residual Values for Used EVs
Limited transaction history leads lenders to discount collateral values to 60-70% of the invoice, compared with 80-85% for internal-combustion vehicles [2]“Second-Life Batteries and Residual Value,” Council on Energy, Environment and Water, ceew.org. Proprietary battery-health tools inhibit cross-brand benchmarking, elevating underwriting friction and slowing the secondary-financing flywheel that would otherwise recycle capital into the India electric vehicle financing market.
Limited Public Charging Infrastructure Coverage
Station density outside major metros averages 0.1-0.3 units per 100 km², throttling adoption in freight corridors. Sparse coverage elevates range-anxiety risk models, prompting lenders to tack on higher risk premiums. Filling the USD 2.9 billion funding gap for chargers is pivotal to unlocking latent rural demand and balancing the India electric vehicle financing market’s geographic mix.
*Our forecasts treat driver/restraint impacts as directional, not additive. The impact forecasts reflect baseline growth, mix effects, and variable interactions.
Segment Analysis
By Financing Product: Operating Leases Gain Traction
Vehicle loans accounted for 68.95% of the India electric vehicle financing market size in 2025, reflecting entrenched buyer preference for outright ownership. Growth momentum, however, is shifting: operating leases are projected to post a 53.47% CAGR through 2031 as fleet managers prioritize asset-light models. Lease structures limit balance-sheet strain, let operators rotate into newer battery chemistries, and mitigate residual-value uncertainty—an enduring pain point. For lenders, predictable lease cash flows align well with securitization structures now emerging in the India electric vehicle financing market.
Subscription plans bundle access, maintenance, and charging in one fee, catering to urban commuters seeking flexibility. Battery-swap-linked finance further blurs the line between mobility service and asset ownership, demanding nuanced risk models. Regulatory clarity under RBI’s revised Priority Sector Lending norms allows banks to book operating-lease receivables under renewable-energy quotas, enhancing capital efficiency. As familiarity grows, operating leases are likely to raise their India electric vehicle financing market share in metropolitan clusters first before cascading to Tier-2 urban pockets.


By Type: Used Vehicle Financing Emerges
Fresh-from-factory sales secured 64.72% of the India electric vehicle financing disbursements in 2025, but the secondary market is heating up with a forecast 54.18% CAGR. Certified pre-owned programs with warranty extensions demystify battery health concerns and draw first-time EV buyers priced out of new models. Lenders are piloting algorithms that parse State of Health metrics, charging cycles, and telematics-verified mileage, enabling tighter loan-to-value bands and competitive rates within the India electric vehicle financing market.
Improved diagnostic kiosks at dealer yards speed valuation, making auction-based price discovery viable in semi-urban regions. As diagnostic data pools lengthen, lenders anticipate sharpening residual-value tables, which should compress risk premiums and accelerate volume. Portfolio diversification into used vehicles also cushions lenders against supply fluctuations in new-vehicle production, adding resilience to the India electric vehicle financing industry.
By Source Type: Fintech Companies Disrupt Traditional Models
Banks retained 39.21% of the India electric vehicle financing market share in 2025, leveraging low-cost deposits and branch reach. Yet fintech originators are outpacing at a 52.74% CAGR, capturing digitally native borrowers through biometric KYC, e-signature execution, and sub-24-hour fund disbursal. Algorithmic scoring of non-traditional data—mobile wallet flows, utility bill payment regularity, and even ride-hail driver ratings—expands eligibility beyond formal-salary segments.
OEM-captive arms integrate financing at the point of sale, blending rate incentives with service packages that lock in aftermarket revenue. Non-bank finance companies focus on micro-entrepreneurs, using community-based collections to maintain sub-3% delinquency ratios. As scale arrives, securitization of fintech portfolios is lowering the cost of funds, enabling ever-sharper pricing across the India electric vehicle financing market.
By Vehicle Type: Three-Wheelers Lead Growth
Two-wheelers continue to dominate at 45.90% of the India electric vehicle financing market share in 2025, driven by affordability and ubiquitous usage in India’s congested cities. Ticket sizes between INR 0.8-1.5 lakh suit retail credit appetites and keep delinquencies low. Commercial three-wheelers, however, are growing fastest at 53.66% CAGR, buoyed by last-mile delivery economics that favor battery power over diesel. Higher daily utilization supplies lenders with richer telematics data, permitting usage-linked repayment schedules and dynamic rate resets.
Passenger-car uptake remains urban-premium, inhibited by parking and charging access constraints. Yet high-income metros showcase financing bundles with overnight home-charger installation, shaving perceived inconvenience. Heterogeneity across vehicle classes demands finely segmented underwriting, a capability in which data-centric fintech lenders are carving durable niches within the India electric vehicle financing market.
Geography Analysis
Maharashtra, Gujarat, and Karnataka collectively represented a significant share of 2024 loan disbursements, underscoring policy coherence, robust urban incomes, and manufacturing ecosystems. Maharashtra tops the leaderboard thanks to extra battery subsidies and expedited state tax rebates. Gujarat capitalizes on its EV assembly hubs and port logistics, funneling demand for both retail and commercial credit. Karnataka’s technology workforce and pro-innovation stance bolster premium-segment penetration, helping enlarge the India electric vehicle financing market size.
Delhi NCR and Tamil Nadu are set to outpace national averages through 2030. Delhi’s congestion-pricing and odd-even driving restrictions provide regulatory nudges, while Tamil Nadu’s supplier base and export orientation ensure production tailwinds. Development-finance vehicles, notably the Green Climate Fund’s USD 200 million risk-sharing program, reserve allocations for these high-impact corridors, insulating lenders against early-stage asset-quality swings.
Emerging states such as Rajasthan, Madhya Pradesh, and Uttar Pradesh are logging 45-50% forecast growth despite lower charging density. Rural electrification drives and decreasing battery prices are lowering the affordability threshold. Nonetheless, limited branch banking and lower formal incomes necessitate group-lending or agent-assisted digital models. Successful penetration here could tilt the India electric vehicle financing market toward a more balanced regional structure by decade-end.
Regulatory Landscape
India’s EV financing environment is shaped by central incentives and tax policy that feed into borrower affordability and lender risk models. The PM E-DRIVE scheme has been operational since October 1, 2024, with an outlay of INR 10,900 crore through 2028, while EVs are subject to a concessional 5% GST, which supports lower effective on-road costs versus ICE alternatives. States also add registration-side relief, including 100% motor vehicle tax waivers for EVs in states such as Uttar Pradesh, Tamil Nadu, and Karnataka, creating state-level lending hotspots and program-led documentation pathways.
On the financial-regulatory side, the Reserve Bank of India’s climate finance directions (2025) recognize clean transportation, including EVs and charging infrastructure, as eligible activities for green deposit allocation. This encourages banks to create labeled green loan products for EVs. In parallel, consultations involving NITI Aayog and major banks such as SBI and ICICI Bank on including retail EV loans under Priority Sector Lending (PSL) point to an active policy channel to reduce risk weightage and expand credit access, with direct implications for pricing, tenors, and co-lending structures across banks and NBFCs.
Value Chain Analysis
The EV financing value chain in India typically begins at the point of sale with OEMs and dealers, then flows to lenders such as banks, NBFCs, OEM captive finance arms, fintechs, and micro-finance institutions. It is supported by enablers including KYC/identity rails, digital underwriting and collections, insurance, and asset tracking or telematics. OEM participation, including performance guarantees and structured dealer programs, helps mitigate technology and resale uncertainty, particularly for new-to-market models and for higher-ticket commercial fleets where inventory and working-capital financing run alongside retail loans.
Downstream, service and risk-management nodes such as battery health diagnostics, repossession and resale channels, and warranty or certified pre-owned programs increasingly influence residual-value setting for used EV finance. NBFCs with deep relationships in self-employed and fleet segments (for example, Shriram Finance in commercial and logistics-linked segments) function as distribution and underwriting specialists. Blended-finance advocacy from NITI Aayog for higher-value segments such as e-buses and e-trucks also highlights how development and institutional capital can lower the cost of funds for asset-heavy use cases.
Competitive Landscape
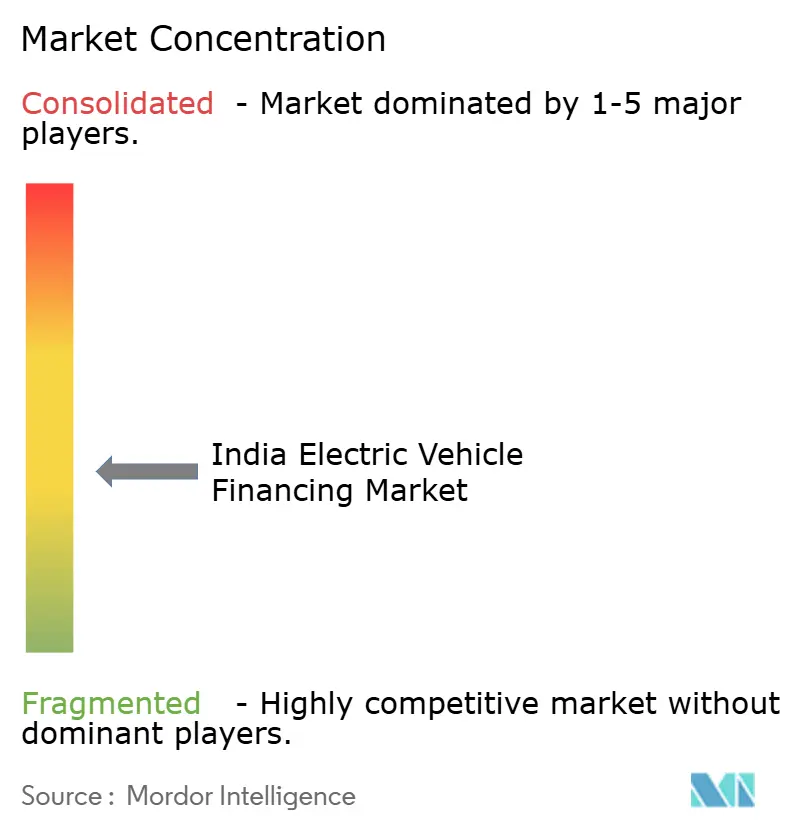
The India electric vehicle financing market remains moderately fragmented. Banks rely on legacy customer franchises and compliance infrastructure, but their manual processes lengthen turnaround times and inhibit subprime experimentation. Fintech challengers like RevFin and Ecofy secure venture backing to grow originations rapidly, while OEM captives such as Tata Motors Finance exploit brand synergies and after-sales data.
Strategically, incumbents pursue three pathways. First, partnership models: State Bank of India’s 2025 MoU with VinFast extends retail credit lines through the automaker’s dealer network. Second, platform integrations: Kotak Mahindra Prime embeds financing options directly into the Tesla India app, converting instant approvals into higher conversion rates. Third, institution-led scaling: the International Finance Corporation’s USD 400 million line to Bajaj Finance earmarks capital for EV portfolios, validating asset-class attractiveness [3]“IFC Bajaj Finance Partnership Press Release,” International Finance Corporation, ifc.org.
Technology is the decisive lever. AI credit engines ingest multi-source data to deliver risk-adjusted pricing, while geo-fencing and battery-health feeds trigger early-warning systems. As portfolios mature, seasoned lenders securitize lease receivables, freeing balance-sheet capacity for further expansion. Regulatory guardrails from the Reserve Bank of India, covering data privacy, co-lending, and asset-classification norms, ensure market discipline while fostering innovation. Collectively, these dynamics channel fresh capital and know-how, sharpening competitiveness across the India electric vehicle financing market.
India Electric Vehicle Financing Industry Leaders
State Bank of India
ICICI Bank
Mahindra & Mahindra Financial Services
Shriram Transport Finance Company
Tata Capital Limited
- *Disclaimer: Major Players sorted in no particular order

Market Opportunities and Future Outlook
A key opportunity is structured financing that directly addresses EV-specific risk drivers, especially battery value, residual-value uncertainty, and downtime risk in commercial applications. Battery-as-a-Service and dual-loan structures that separate the chassis and battery cost broaden affordability and reduce lender exposure to battery depreciation, and 2026 product activity has already shown implementation pathways through OEM-bank collaborations. Another gap is expanding formal credit coverage beyond Tier-1 cities via NBFC and fintech distribution, where underwriting can use alternative data and where state-level tax waivers and central incentives can be translated into standardized, faster-to-originate loan products.
Institutional funding alignment adds further room for product scaling and pricing adjustments. RBI’s 2025 climate finance directions, which recognize clean transportation and charging as eligible green activities, support a clearer linkage between green deposits and EV loan books, complementing the market’s growing use of green and blended capital. On execution, named lenders such as Mahindra and Mahindra Financial Services, Shriram Finance, and Tata Capital are scaling EV-focused portfolios and programs, while targeted capital raises by dedicated green NBFCs (for example, Mufin Green Finance’s preferential allotment of INR 324 crore in March 2026) increase origination capacity for two-wheelers, three-wheelers, and light commercial EV financing, particularly in underpenetrated Tier-2 and Tier-3 corridors.
Recent Industry Developments
- June 2026: VinFast India announced an MoU with Tata Capital to provide financing solutions for its exclusive dealer network (working capital, inventory management, and dealership expansion). The collaboration expands VinFast's distribution ramp and strengthens inventory risk management in India.
- May 2026: Kia India launched a Battery-as-a-Service finance program for Carens Clavis EV using dual-loan structures through partner banks. The arrangement expands Kia's EV financing options and accelerates EV adoption through flexible battery financing.
- August 2025: State Bank of India (SBI) signed an MoU with VinFast India to provide retail financing options for VinFast EVs with up to 100% on-road funding. The collaboration enhances VinFast's access to capital and dealer financing through SBI's green loan framework.


Research Methodology Framework and Report Scope
Market Definition and Coverage
This market covers the total value of financing facilitated for electric vehicles in India, including loans, leases, and related credit products used to fund EV purchases and fleet deployments across retail and commercial users.
Scope exclusions: We exclude non-vehicle credit that is not tied to an EV purchase decision (such as general working-capital lines) and stand-alone charging infrastructure financing.
Segmentation Overview
- By Financing Product
- Vehicle Loan
- Operating Lease
- Subscription / Battery-swap Plan
- Hire-Purchase and Others
- By Type
- New Vehicles
- Used Vehicles
- By Source Type
- OEM Captive Finance Arms
- Banks
- NBFCs
- Fintech Companies
- Micro-finance Institutions
- By Vehicle Type
- Passenger Cars
- Commercial Vehicles
- Two-Wheelers
- Three-Wheelers
Data Sources, Market Sizing, and Validation
Desk Research
For the desk work, we grounded the model in EV adoption and vehicle flow indicators that can be checked through public channels. We reviewed Government of India and state transport portals for registration signals, data releases from NITI Aayog and other policy bodies, and RBI publications that help interpret credit conditions and rate cycles. We also used Ministry of Road Transport and Highways releases and similar official transport statistics to keep the vehicle universe aligned to India definitions.
To connect EV volumes to financing behavior, we referenced lender and OEM captive finance disclosures, annual reports, investor presentations, and reputed business press coverage on loan-to-value norms, delinquency commentary, and product launches. In parallel, we selectively used paid subscriptions for company financial intelligence, news and financials, and patent databases to track underwriting features and product innovation patterns that shape financing uptake. The desk sources listed here are illustrative, and we used additional public documents and datasets to collect inputs, validate them, and tighten assumptions.
Primary Interviews and Surveys
Primary work converted EV demand signals into financeable demand. We did this by speaking with lenders, fleet operators, dealer channel participants, and ecosystem experts across major EV-heavy states. The focus was on practical inputs such as approval rates, typical ticket sizes, pricing spreads versus ICE, and how risk views shift by vehicle category and end use, which helped close gaps where public reporting is limited.
Distribution of primary research fieldwork respondents
| Company type | Respondent position | Region |
|---|---|---|
| Top tier: 30% | CXOs: 13% | |
| Mid tier: 48% | Functional/Unit leaders: 31% | |
| Smaller Players: 22% | Managers: 56% |
Market-Sizing & Forecasting
Sizing used a combined top-down and bottom-up approach. We first translated EV sales and registration direction into a financeable vehicle pool, then mapped that pool to likely financing penetration and average financed amount by vehicle use case. The top-down build was corroborated using selective bottom-up approximations, including sampled lender portfolio growth checks, product-level ticket size ranges, and channel feedback on monthly disbursal run rates, which were then used to adjust totals when a mismatch appeared.
Key model inputs included EV sales and registration momentum, mix shifts across 2W, 3W, PV, and CV, average on-road price movement, loan-to-value norms, tenure preferences, interest rate environment, and fleet electrification pace in last-mile and intra-city applications. For forecasting, we used scenario analysis supported by expert consensus on policy continuity, subsidy timing, battery price direction, and lender risk appetite, since these factors can change penetration and pricing quickly. Where direct disbursal data was not available, we handled gaps with proxy ranges from interview inputs and cross-checked them against balance sheet growth indicators and public announcements, before locking assumptions into the model.
Data Validation & Update Cycle
We ran multiple consistency checks so market totals stayed aligned with independent signals, including EV registrations, lender portfolio commentary, and interest rate trends. When variances were large, we revisited assumptions like penetration, ticket size, and vehicle mix, and we re-contacted respondents when desk evidence could not explain the movement.
Before sign-off, the model was reviewed by another analyst to catch unit issues, double counting, and unrealistic step changes across years. Reports were refreshed annually, with interim updates triggered when material policy changes, subsidy revisions, or sharp EV demand shifts were observed. A final validation pass was completed right before delivery so the client received the most current view possible.
Mordor Intelligence's India Electric Vehicle Financing Market Size Versus Other Published Estimates
Published market values for EV financing in India can differ widely because the term financing is used differently, and because the same year can be reported as approvals, disbursals, or the outstanding loan book. Differences also come from whether used EVs are included, how leasing is treated versus loans, and how aggressive the assumed penetration ramp is across 2W, 3W, PV, and CV.
In our checks, the biggest gap drivers were scope boundaries and the way average financed amount is built. Ticket sizes and loan-to-value norms vary by vehicle category and buyer type, so estimates can diverge when those differences are flattened. Some estimates use a single penetration assumption applied across all EVs, while others report a requirement number rather than the value actually financed in that year. This spread is narrowed when disbursal-linked sizing is used and leasing is counted only when contracted, which is the treatment applied by Mordor Intelligence.
Benchmark comparison
| Source | Market Size | Gaps in Research Methodology |
|---|---|---|
| Mordor Intelligence | USD 2.37 B (2025) | |
| Policy Think Tank A | USD 5.00 B (2025) | Uses a lending requirement view for the year and mixes advances needed with actual disbursals, which can overstate market value when penetration and ticket sizes are assumed uniformly across vehicle types. |
| Industry Media Brief B | USD 2.00 B (2024) | Anchored to a single fiscal-year disbursal headline and then extrapolated, with limited adjustment for leasing, state-wise subsidy timing, and vehicle-mix shifts that change the average financed amount. |
The table shows that most differences are explainable once you line up the unit of measure (disbursed value versus required advances), the year definition, and whether leasing is counted as contracted financing or inferred demand. By keeping assumptions tied to observable EV demand signals and lender-side checks, the estimate stays transparent and repeatable, and it avoids overstating value from requirement-style projections.


Key Questions Answered in the Report
What is the projected value of India’s electric vehicle financing market by 2031?
The India electric vehicle financing market is expected to reach USD 28.79 billion by 2031, reflecting a 51.62% CAGR.
Why are operating leases growing so quickly in Indian EV finance?
Operating leases let fleet operators avoid residual-value risk and keep capital free for expansion, driving a 53.47% CAGR through 2031.
Which lender category is expanding fastest in EV financing?
Fintech companies are advancing at a 52.74% CAGR as AI-driven underwriting compresses approval times and broadens credit access.
How big is the two-wheeler share in India’s EV financing in 2025?
Two-wheelers account for 45.90% of total disbursements, making them the largest vehicle class in 2025.
Page last updated on:


