
India Electric Rickshaw Market Size and Share
Market Overview
| Study Period | 2021 - 2031 |
|---|---|
| Forecast Data Period | 2026 - 2031 |
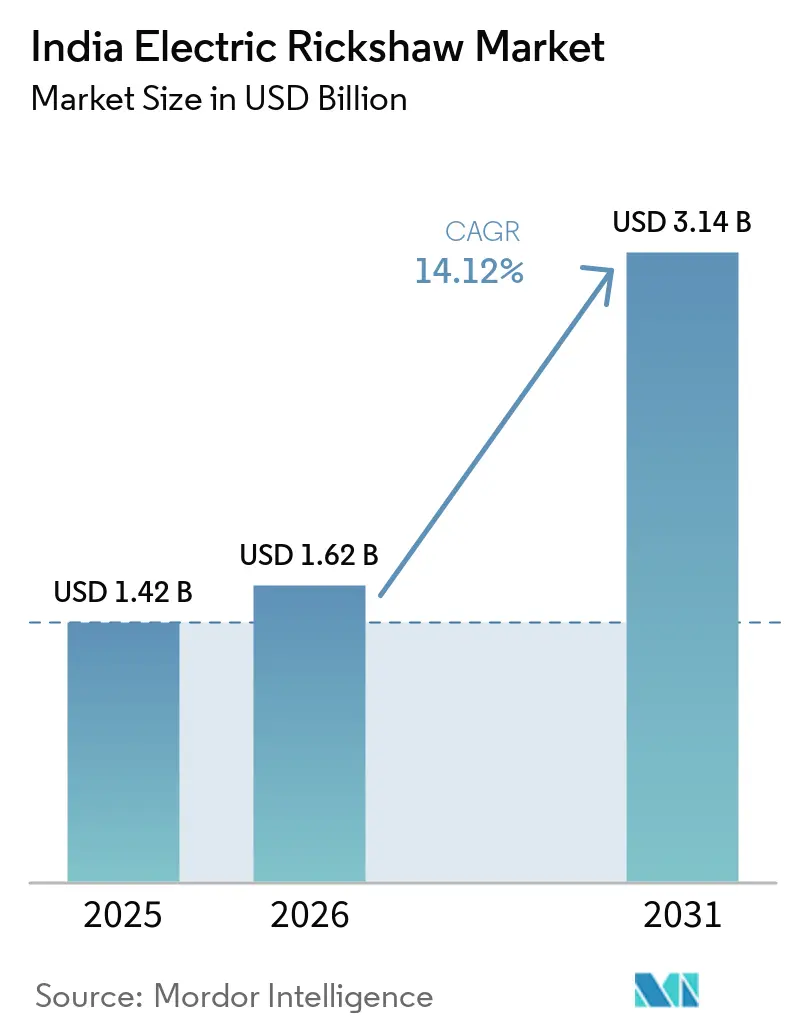
| Base Year Market Size (2025) | USD 1.42 Billion |
| Market Size (2026) | USD 1.62 Billion |
| Market Size (2031) | USD 3.14 Billion |
| Growth Rate (2026 - 2031) | 14.12 % |
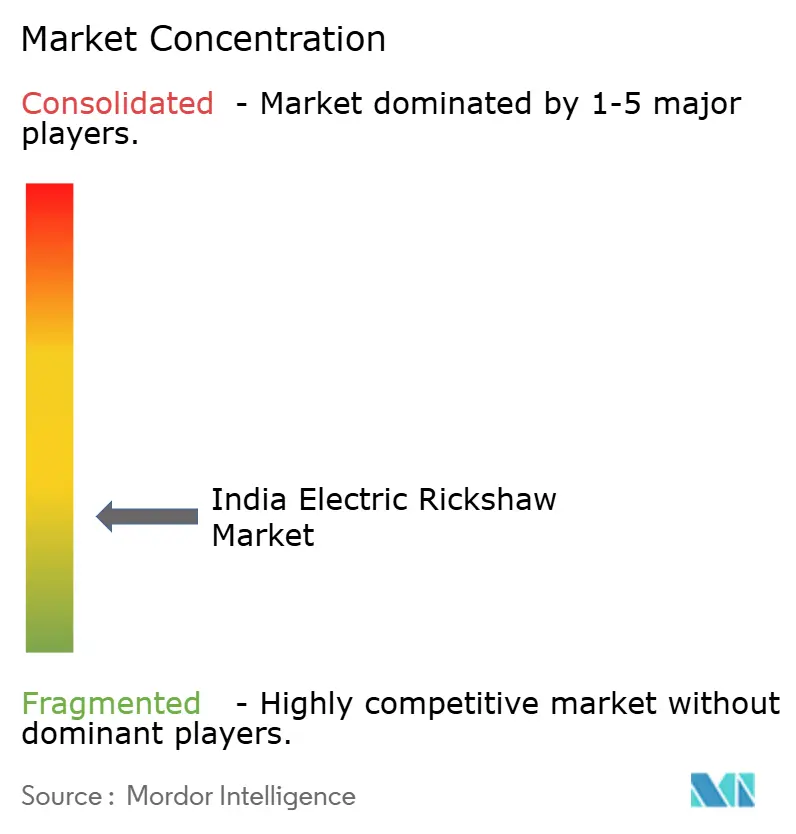
| Market Concentration | Low |
Major Players *Disclaimer: Major Players sorted in no particular order Image © Mordor Intelligence. Reuse requires attribution under CC BY 4.0. | |
India Electric Rickshaw Market Analysis by Mordor Intelligence
The Indian electric rickshaw market size was valued at USD 1.42 billion in 2025 and estimated to grow from USD 1.62 billion in 2026 to reach USD 3.14 billion by 2031, at a CAGR of 14.12% during the forecast period (2026-2031). This rapid expansion reflects government incentives, aggressive state-level policies, growing e-commerce demand, and heightened urban air-quality goals. Passenger carrier dominance, strong recycling economics for lead-acid batteries, and the swift pivot of e-commerce logistics toward electric cargo variants are sustaining volume momentum. Parallel advances in battery chemistry, modular finance models, and power-train efficiency are widening the total addressable base beyond Tier-I metros into Tier-II and Tier-III towns. Competitive rivalry intensifies as legacy OEMs, innovative start-ups, and global automakers commit capital and engineering talent to capture the next wave of growth.[1]
Key Report Takeaways
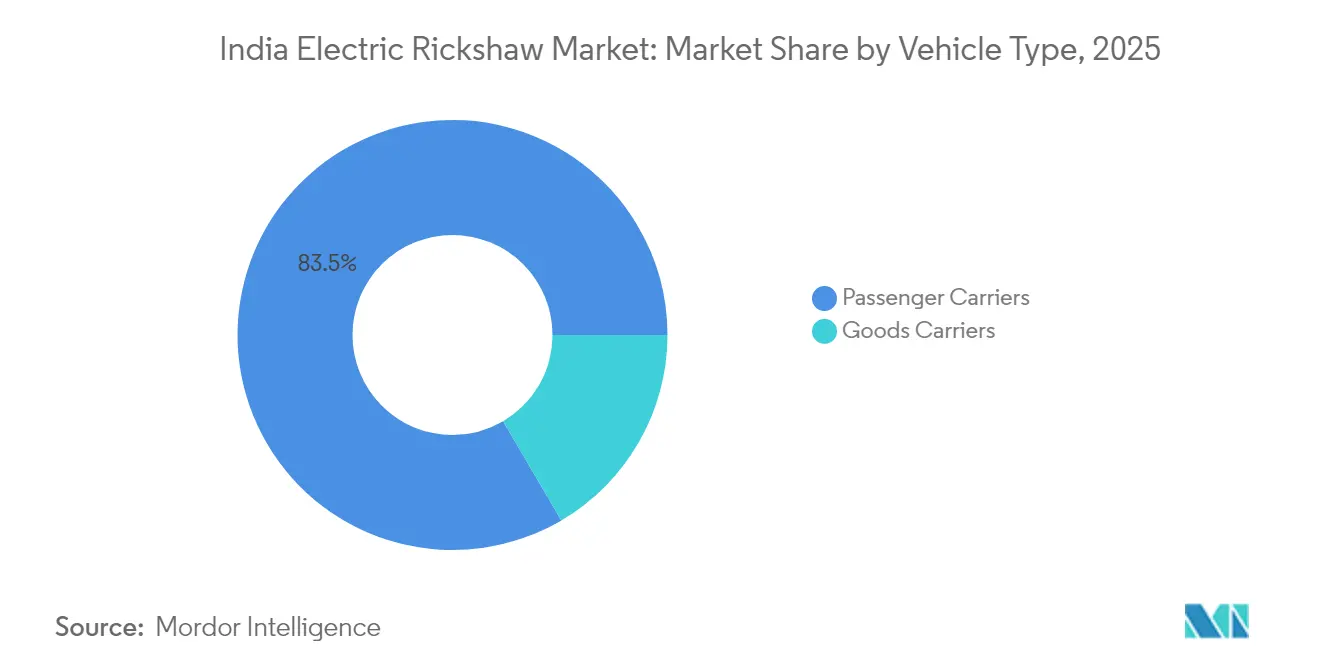
- By vehicle type, passenger carriers led with 83.45% revenue share in 2025, while goods carriers are projected to expand at a 28.10% CAGR to 2031.
- By power output, the 1–1.5 kW segment held 53.90% of the Indian electric three-wheeler market share in 2025; above 1.5 kW, the market is advancing at a 30.95% CAGR.
- By battery type, lead-acid commanded 71.40% share of the Indian electric three-wheeler market size in 2025, whereas lithium-ion (LFP) is set to grow at a 37.10% CAGR.
- By battery capacity, up to 3 kWh accounted for 61.20% share of the Indian electric three-wheeler market size in 2025; 3–6 kWh will expand at a 33.85% CAGR through 2031.
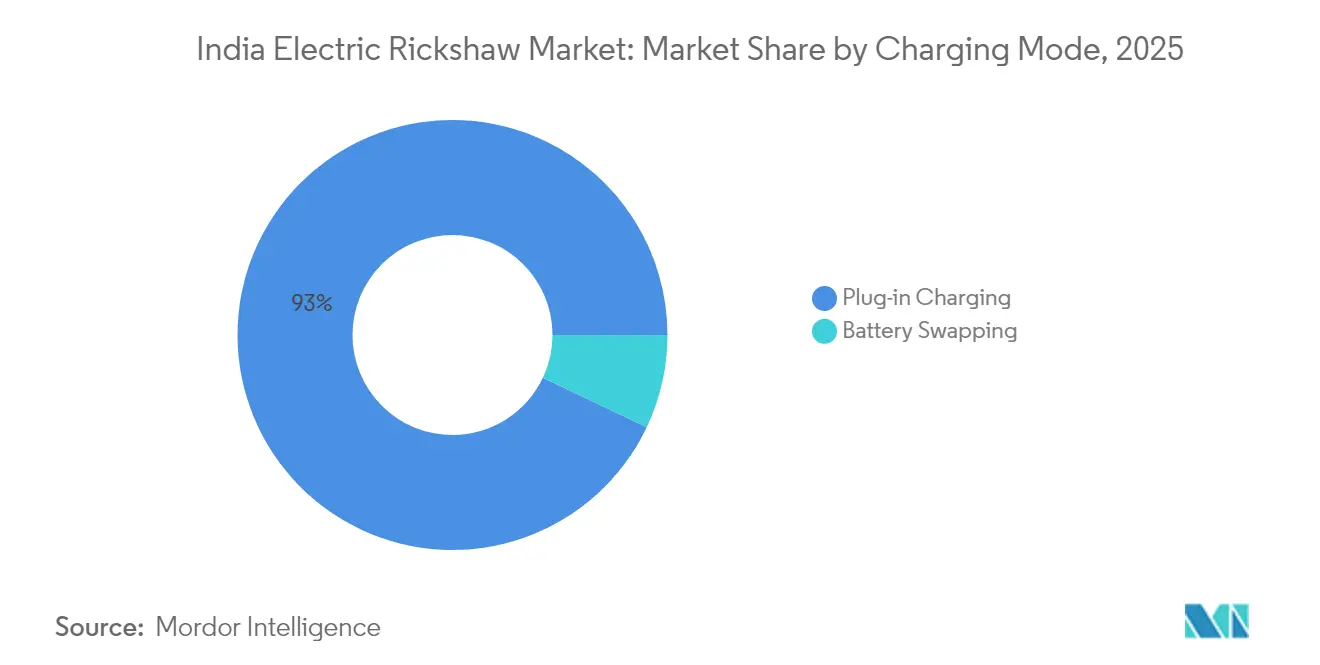
- By charging mode, plug-in charging dominated with 92.95% share in 2025, yet battery swapping is forecast to rise at a 42.30% CAGR.
- By ownership model, individual owner-drivers controlled 87.50% of 2025 volume, while fleet operators record the fastest CAGR at 30.10%.
- By state, Uttar Pradesh captured 37.80% of sales in 2025; Punjab shows the highest growth trajectory at 27.20% CAGR.
Note: Market size and forecast figures in this report are generated using Mordor Intelligence’s proprietary estimation framework, updated with the latest available data and insights as of 2026.
Market Trends and Insights
Drivers Impact Analysis of India Electric Rickshaw Market*
| Driver | (~) % Impact on CAGR Forecast | Geographic Relevance | Impact Timeline |
|---|---|---|---|
| FAME-II and state incentives boosting tier-II adoption | +2.2% | Pan-India, with concentration in Tier-II cities | Medium term (2-4 years) |
| Shared mobility demand rising in urbanizing towns | +1.7% | Urban and peri-urban areas across India | Medium term (2-4 years) |
| E-commerce firms adopting cargo e-rickshaws | +1.5% | Metropolitan cities, expanding to Tier-II cities | Short term (≤ 2 years) |
| Battery recycling cutting ownership costs | +1.3% | Pan-India, with higher impact in established markets | Medium term (2-4 years) |
| BaaS models reducing upfront capex | +0.8% | Urban centers with developed charging networks | Short term (≤ 2 years) |
| ICE three-wheelers to be phased out in Delhi-NCR by 2030 | +0.7% | Delhi-NCR, with spillover to other metro regions | Long term (≥ 4 years) |
| Source: Mordor Intelligence | |||
FAME-II Subsidy Extension and State Incentives Accelerating Tier-II Adoption
Federal continuity between the extended FAME-II program and the Electric Mobility Promotion Scheme 2024 keeps per-vehicle subsidies intact, lowering acquisition cost barriers for drivers outside major metros. State top-ups—ranging from purchase rebates to road-tax waivers in Maharashtra, Karnataka, and Delhi—stack further savings, making electric three-wheelers price-competitive with ICE models at the point of sale. Subsidy density correlates strongly with registrations; assessments reveal a 46.16% sales uplift for each standard-deviation rise in state support intensity. Local financiers report shorter payback periods, encouraging broader credit participation. Combined, these fiscal levers push the Indian electric three-wheeler market deeper into cost-sensitive Tier-II clusters where informal transit demand is surging.[2]
Rising Demand for Last-Mile Shared Mobility in Rapidly Urbanising Towns
India’s expanding network of mid-sized cities relies heavily on auto-rickshaws to bridge first- and last-mile gaps in public transit. Electric variants cut running expenses to INR 0.50–0.70/km against INR 3–4/km for petrol or CNG, creating immediate earnings upside for owner-drivers. Shared-mobility aggregators such as Uber and Rapido are onboarding e-rickshaws to meet municipal clean-air mandates and rider price sensitivity. High daily utilization amplifies fuel-cost arbitrage, accelerating payback on the higher upfront purchase. Seamless digital booking elevates asset productivity, further reinforcing operator economics and boosting adoption across the Indian electric three-wheeler market.
E-Commerce Logistics Embracing Cargo E-Rickshaws for Intra-City Delivery
Surging online retail volumes require nimble, low-emission delivery modes that can navigate urban congestion and access restricted zones. Cargo electric three-wheelers offer 20–25% cost savings per drop relative to small diesel vans, while meeting corporate ESG targets. Flipkart, Amazon India, and grocery platforms are scaling dedicated fleets; Bajaj’s supply pact for over 1,000 units to Flipkart exemplifies the trend. Telematics-enabled route optimization raises daily delivery counts, maximizing revenue per vehicle. As e-commerce demand spreads to secondary cities, platform commitments lock in multi-year volume visibility for OEMs.
Lead-Acid Battery Recycling Ecosystem Lowering Total Cost of Ownership
A near-closed-loop supply chain recovers 99% of lead from spent batteries, monetizing end-of-life value and defraying initial purchase price. Local recyclers pay competitive buy-back rates, effectively compressing lifecycle energy storage costs. Because 60% of India’s lead-acid demand already serves transportation, collection channels are mature and well-distributed. For cash-constrained owner-drivers, predictable residual value underpins financing confidence and manageable EMIs. Until lithium-ion prices fall further, this recycling dividend secures lead-acid’s volume edge in the Indian electric three-wheeler market.
Restraints Impact Analysis of India Electric Rickshaw Market*
| Restraint | (~) % Impact on CAGR Forecast | Geographic Relevance | Impact Timeline |
|---|---|---|---|
| Informal financing limiting driver purchases | -2.1% | Pan-India, more severe in rural areas | Medium term (2-4 years) |
| Slow battery standard rollout hindering interoperability | -2.0% | Urban centers with multiple battery swapping operators | Medium term (2-4 years) |
| Chassis safety concerns on rural roads | -1.7% | Rural and semi-urban areas with poor road infrastructure | Medium term (2-4 years) |
| Low-quality lead-acid batteries from unorganised supply | -1.3% | Tier-II and Tier-III cities | Short term (≤ 2 years) |
| Source: Mordor Intelligence | |||
Fragmented & Informal Financing Channels Constraining Driver Purchases
The lack of scale credit pipelines keeps effective interest rates high and loan-to-value ratios low, dampening uptake among independent drivers whose livelihood depends on daily fare receipts. Technology-risk perceptions lead many lenders to treat electric variants as non-standard assets, constricting credit lines despite lower running costs. Informal money-lenders bridge the gap but charge punitive rates, eroding total cost of ownership benefits. Development-finance institutions advocate blended-finance pools to de-risk retail lending, yet implementation remains slow outside major cities. Until mainstream banks normalize underwriting for electric three-wheelers, growth will undershoot potential in segments most sensitive to up-front affordability.
Safety Concerns Over Chassis Integrity on Rural Roads
Uneven road surfaces and overloading expose structural limitations in low-cost models, fueling rider apprehension and higher insurance premiums. Surveys highlight instability, limited crash protection, and rollover fear, especially among women and older passengers. Because a sizable share of production comes from small-scale assemblers, adherence to uniform structural standards is inconsistent. Financing agencies factor accident risk into loan pricing, further constraining credit flow. Harmonized safety certification and localized test facilities could allay these concerns, but progress remains uneven across states.
*Our forecasts treat driver/restraint impacts as directional, not additive. The impact forecasts reflect baseline growth, mix effects, and variable interactions.
India Electric Rickshaw Market Segment Analysis
By Vehicle Type:
Cargo Carriers Leverage E-Commerce TailwindsIndia electric rickshaw market share is currently dominated by the passenger carrier segment, which accounted for 83.45% of unit sales in 2025, cementing its role as the backbone of intra-city shared mobility. Dense urban routes and all-day utilization let drivers exploit penny-per-kilometer energy costs, reinforcing segment resilience. Goods carriers, however, are registering the fastest 28.10% CAGR as online retail pushes demand for nimble, emissions-free last-mile delivery. Amazon India, Flipkart, and quick-commerce players are formalizing procurement pipelines with established OEMs, ensuring predictable volume growth. Segment-specific designs such as refrigerated bodies widen addressable markets in food distribution and pharmaceuticals. Higher payload ratings and telematics integration make cargo e-rickshaws an essential piece of future city-logistics blueprints.
In absolute volume terms, passenger variants will continue to dominate the Indian electric three-wheeler market, yet the value contribution from cargo units will rise steadily through premium specification mixes. Tax breaks for commercial vehicles and dedicated micro-fulfillment hubs in Tier-II cities will push cumulative cargo penetration higher. As urban congestion charges tighten, freight operators will prefer electric three-wheelers over light trucks, cementing the segment’s long-term upside.

By Power Output:
High-Power Motorizations Unlock Premium Use-CasesIndia electric rickshaw market share by power output was led by the 1–1.5 kW motor segment, which accounted for 53.90% of total demand in 2025. This power band delivers sufficient torque for frequent stop-start city driving while conserving battery life, making it ideal for typical passenger operations. Operators value its balanced offering—affordable upfront cost with practical range—especially in high-usage urban duty cycles.
In contrast, powertrains rated above 1.5 kW are witnessing the fastest growth in the India electric rickshaw market, expanding at a 30.95% CAGR as payload demands and gradient-handling requirements rise. The segment is benefiting from advancements in e-axle technologies, including integrated motor controllers and IP-rated enclosures, which enhance durability during India’s heavy monsoon conditions and boost fleet confidence.
The higher-powered bracket supports refrigerated cargo, steep-gradient hill-stations, and premium ride-hailing tiers that demand faster trip times. Component suppliers are localizing magnets and stators, cutting imported content and stabilizing price points. As unit economics improve, the Indian electric three-wheeler market size for the above-1.5 kW class is projected to widen its revenue share, ushering in a new competitiveness layer focused on performance rather than solely cost.
By Battery Type:
LFP Chemistry Disrupts Legacy DominanceLead-acid batteries retained 71.40% share in 2025 owing to low entry cost and robust recycling value. Familiarity among neighborhood mechanics and abundant second-hand spares keep service downtime minimal. However, limited depth-of-discharge tolerance shortens the real-world range of an E-rickshaw battery, driving multi-day charging cycles that crimp revenue. Falling cell prices and enhanced safety credentials are propelling LFP lithium-ion packs, now the fastest-growing chemistry at a 37.10% CAGR. Domestic cell assembly under the Production-Linked Incentive scheme further narrows cost gaps.
Thermal stability, longer cycle life, and higher usable capacity give operators more trips per charge, directly boosting earnings. OEMs pair LFP packs with advanced battery-management systems that issue predictive maintenance alerts, reducing unexpected breakdowns. As warranty terms lengthen, financiers are re-rating residual values, expanding loan tenures. The Indian electric three-wheeler market share tilt toward LFP will accelerate once standardized cell formats unlock swapping interoperability.
By Battery Capacity:
Mid-Range Packs Hit Cost-Performance Sweet SpotUp to 3 kWh packs dominated with 61.20% of 2025 installations, adequate for 80–90 km urban duty cycles. Their lower mass supports lighter chassis and reduces tire wear, appealing to independent driver-owners. Yet, longer routes for peri-urban commuters and logistics hubs require extended autonomy. The 3–6 kWh bracket is set to sprint at a 33.85% CAGR, supplying 110–160 km real-world range without excessive price inflation. Pack engineering advances raise gravimetric energy density, allowing OEMs to slot higher capacity into legacy footprints.
Bulk procurement programs by fleet operators favor the 3–6 kWh class because it balances initial cash outlay with route flexibility, mitigating mid-shift charging downtime. As depot chargers reach higher kw ratings, turnaround times shrink, lifting daily revenue potential. Consequently, the Indian electric three-wheeler market size attributed to mid-capacity packs will expand steadily through the decade.
By Charging Mode:
Battery Swapping Expands Operational UptimePlug-in charging commanded 92.95% of 2025 deployments due to its simplicity and compatibility with household sockets. Rural and semi-urban drivers rely on overnight top-ups, leveraging lower off-peak tariffs. Nevertheless, business models demanding near-continuous vehicle availability see productivity losses when vehicles are tethered for hours. Battery swapping, scaling at a 42.30% CAGR, compresses downtime to minutes, a game-changer for logistics fleets. Subscription-based energy access spreads costs over utilization, aligning with cash-flow realities of daily wage drivers.
Policy drafts targeting standardized pack dimensions promise to unlock cross-network interoperability, an inflection point for mass adoption. Investment from energy majors into swap-station rollouts underpins confidence that the Indian electric three-wheeler market will soon enjoy comprehensive urban coverage. Over time, blended strategies—plug-in at night, swap during peak hours—will dominate best-practice fleet operations.
By Ownership Model:
Organized Fleets Professionalize the EcosystemIndividual drivers owned 87.50% of electric three-wheelers in 2025, reflecting the sector’s grassroots origins. Informal routes, flexible hours, and family labor underpin their business logic. Yet professional fleet operators recorded the highest 30.10% CAGR by bundling vehicle leasing, maintenance, and digital freight brokerage into turnkey offerings. Alt Mobility’s lease-to-own program links drivers with aggregators, ensuring assured earnings that de-risk financing.
Commercial contracts with e-commerce giants secure predictable kilometre utilization, justifying larger battery packs and telematics investments. Data-driven maintenance lowers downtime, improving asset turns and extending lifespan. As fleets standardize procurement, OEMs gain volume visibility, enabling component localization and cost deflation. This virtuous cycle will progressively tilt overall volume toward organized entities within the Indian electric three-wheeler market.
Geography Analysis
Uttar Pradesh stood out in 2025 with 37.80% of national sales, driven by dense urban populations, robust policy incentives, and a maturing dealership network. The state registered 266,106 units, underscoring how a targeted nodal-agency approach can scale adoption quickly. Bihar followed with 89,683 units, benefiting from high per-capita dependence on auto-rickshaws for short-haul mobility and incentives that offset initial sticker shock. Delhi’s directive to phase out fossil-fuel autorickshaws by 2025, coupled with plans for 13,200 chargers, is reshaping the capital’s transport mix at an accelerated clip.
Punjab, with a 27.20% CAGR forecast, combines agricultural market-yard logistics and rising urban commute needs to fuel demand. Targeted subsidies and simplified registration norms shorten adoption cycles. Maharashtra leads electric commercial-vehicle sales nationally; its 2,279 three-wheeler registrations in 2024 reflect state-level scrappage bonuses and toll exemptions. Karnataka’s tech-hub economy supports app-based ride-sharing pilots, creating stable utilization benchmarks that encourage financiers.
Infrastructure disparities remain pronounced. Chandigarh has the highest charger-to-road-length ratio, while Delhi ranks first in absolute charger count, offering one unit every 12.5 km. States with aligned electricity-tariff concessions and clear municipal parking guidelines are recording higher utilisation per charger. As more states adopt phased ICE retirement schedules, the Indian electric three-wheeler market will witness a geographic diffusion of demand beyond early-adopter corridors, balancing north-centric concentration with southern and western growth pockets.
Regulatory Landscape
India's electric rickshaw regulatory framework is anchored in the Central Motor Vehicles Rules under the Ministry of Road Transport and Highways (MoRTH), with safety and construction requirements increasingly standardized through BIS IS 18294:2023 for e-rickshaws and e-carts, and battery safety references such as AIS-156 and AIS-038 (Rev 2). Demand support and compliance-linked formalization sit under the Ministry of Heavy Industries, where the PM E-DRIVE scheme operationalized from October 1, 2024 provides incentives for eligible e-rickshaws and e-carts through March 31, 2028, reinforcing last-mile mobility and commercial-use cases.
Enforcement is tightening around manufacturing quality and traceability. MoRTH issued draft norms that make production facility audits by vehicle testing agencies a prerequisite for type approval, effective April 1, 2026. A separate proposal under consideration targets a technology pivot by mandating lithium-ion battery packs compliant with AIS-156 performance requirements for newly manufactured e-rickshaws and e-carts from April 1, 2027, subject to final gazette notification and stakeholder consultation.
Value Chain Analysis
The India electric rickshaw value chain covers component suppliers (motors, controllers, wiring, lighting, tires), energy storage (lead-acid and lithium-ion pack makers plus BMS providers), chassis and body fabricators, and final assemblers/OEMs. This is followed by dealer networks, financiers and leasing firms, and aftersales service through local garages and authorized service points. Battery economics shape sourcing decisions, as lead-acid remains prevalent due to low upfront cost and an established recycling and buyback ecosystem. Lithium-ion (including LFP) demand is more tied to longer cycle life, higher usable capacity, and rising safety compliance expectations referenced to AIS-156.
Downstream, distribution and utilization increasingly reflect organized fleets, shared-mobility aggregators, and e-commerce logistics buyers that procure in bulk and emphasize uptime, telematics, and service SLAs. Charging and energy delivery are still dominated by plug-in home and depot charging, though swapping networks and rapid-charging partnerships are becoming more visible in commercial corridors. This adds new chain nodes (swap operators, franchise station owners, energy subscription platforms). The shift toward audited manufacturing from April 2026, linked to production facility audits for type approval, adds a formal compliance layer upstream and favors manufacturers with controlled processes, test documentation, and stable tiered supplier relationships.
Competitive Landscape
More than 575 manufacturers participate, yet leadership is coalescing around brands with scale and service depth. Mahindra Last Mile Mobility is evolving as a key player, leveraging its all-India service footprint and a tie-up with Vidyut to roll out battery-subscription financing. Bajaj Auto, scaling output on its Chakan line, confirming that established OEM quality systems and parts networks resonate with risk-averse buyers. YC Electric scaling through price-aggressive models that appeal to rural and Tier-III segments.
Domestic challenger Euler Motors specializes in cargo applications, partnering with e-commerce fleets to validate total-cost-of-ownership claims through data dashboards. Battery Smart focuses solely on swapping, using asset-light franchise models to expand network density. Hyundai's January 2025 entry announcement brings high-precision engineering, raising the bar on safety features and energy efficiency across the board.[3]
Strategic focus is shifting from standalone hardware to lifecycle value propositions. Piaggio’s battery-subscription plan lowers ex-showroom cost to INR 259,000, broadening the buyer funnel. Mahindra experiments with pay-per-kilometer energy bundles bundled with extended warranties. OEMs are also lobbying state utilities for fleet-tariff categorization, locking in long-term electricity cost visibility. As technology and financing models converge, differentiation will pivot on ecosystem completeness—spare-parts availability, uptime guarantees, and residual-value management—rather than unit price alone.
India Electric Rickshaw Industry Leaders
-
YC Electric Vehicle
-
Saera Electric Auto Pvt. Ltd.
-
Mahindra Electric Mobility Ltd.
-
Terra Motors India Corp.
-
Piaggio Vehicles Pvt. Ltd.
- *Disclaimer: Major Players sorted in no particular order
India Electric Rickshaw Market Companies Covered in this Report
- Terra Motors India Corp.
- Piaggio Vehicles Pvt. Ltd.
- Mahindra Electric Mobility Ltd.
- Kinetic Green Energy & Power Solutions Ltd.
- ATUL Auto Ltd.
- Saera Electric Auto Pvt. Ltd.
- YC Electric Vehicle
- Goenka Electric Motor Vehicles Pvt. Ltd.
- Udaan E-Rickshaw
- Thukral Electric Bikes
- Mini Metro EV LLP
- E-Ashwa Automotive Pvt. Ltd.
- CityLife EV
- Adapt Motors Pvt. Ltd.
- Vani Electric Vehicles Pvt. Ltd. (Jezza Motors)
- Omega Seiki Mobility
- Euler Motors
- Lohia Auto Industries
- Bajaj Auto Ltd. (Electric 3W Division)
- Altigreen Propulsion Labs
- Gayam Motor Works
- Lectrix EV
- Saarthi E-Rickshaw
Market Opportunities and Future Outlook
Incentive visibility and tightening compliance are creating room for organized OEMs and fleet-centric models. PM E-DRIVE incentives for e-rickshaws and e-carts run through March 31, 2028, which supports structured procurement by fleet operators and logistics platforms that require predictable total cost of ownership. In parallel, MoRTH's move toward mandatory production facility audits from April 1, 2026 raises the bar for type approval compliance, pushing the market toward higher-quality, documented manufacturing. This environment creates space for branded players with stronger service delivery to displace informal supply.
Technology and capacity signals from in-scope players and adjacent electric three-wheeler ecosystems point toward higher-spec vehicles and faster energy replenishment for commercial duty cycles. Mahindra Last Mile Mobility's Udo launch on a new modular EV platform (backed by over INR 500 crore investment) highlights product roadmap progression toward lithium-ion platforms aimed at longer range and higher utilization. Manufacturing and supply capacity build-outs also suggest readiness for scale, including Euler Motors' announced FY27 capex plan (INR 300-400 crore) to double production capacity and Zelio E-Mobility's Coimbatore plant commissioning that lifted total annual capacity to 2.4 lakh units. These moves align with adoption signals from e-commerce and city logistics buyers, where uptime-oriented offerings such as battery subscription, swapping, and rapid charging collaborations translate into repeatable, contract-led demand.
Recent Industry Developments in India Electric Rickshaw Market
- May 2026: Euler Motors announced a FY27 capex plan of INR 300-400 crore to double its production capacity. The investment focus highlights rising demand for cargo-oriented electric three-wheelers and pushes the competitive set toward scaled manufacturing and localized supply chains.
- February 2026: Mahindra Last Mile Mobility launched the Udo electric auto-rickshaw on a new modular EV platform built with an investment exceeding INR 500 crore. The product uses an 11.7 kWh lithium-ion battery and is positioned around higher range and utilization, reinforcing the market shift toward higher-spec L5 electric autos and more formal fleet procurement.
- October 2024: Saera Electric Auto partnered with logistics platform Porter to supply L3 and L5 e-carts for deployment in Delhi and Bengaluru, with a stated target of 500 vehicles per month per city. The tie-up reflects growing institutional demand for electric three-wheelers in last-mile logistics and increases the importance of serviceability and uptime commitments in winning commercial accounts.
India Electric Rickshaw Market Report Scope and Research Methodology
Market Definition and Coverage
This market covers the value of electric rickshaws sold and used in India that run only on electricity and are meant for passenger movement or light cargo on public roads. The sizing focuses on road-legal vehicles, so demand is tied to registrations, replacement cycles, and active fleet usage.
Scope exclusions: Non-homologated prototypes, retrofit kits, and electric carts used only inside private campuses or industrial sites are excluded.
Segments Covered in This Report
- By Vehicle Type
- Passenger Carriers
- Goods Carriers
- By Power Output
- Up to 1 kW
- 1 – 1.5 kW
- Above 1.5 kW
- By Battery Type
- Lead-Acid
- Lithium-ion (NMC/NCA)
- Lithium-ion (LFP)
- Other Chemistries (Li-Polymer, Ni-MH)
- By Battery Capacity
- Up to 3 kWh
- 3 – 6 kWh
- Above 6 kWh
- By Charging Mode
- Plug-in Charging
- Battery Swapping
- By Ownership Model
- Individual Owner-Drivers
- Fleet Operators
- Aggregators / MaaS Platforms
- By State
- Uttar Pradesh
- Delhi
- Maharashtra
- Bihar
- Rajasthan
- Karnataka
- Tamil Nadu
- Punjab
- Telangana
- Rest of India
Data Sources, Market Sizing, and Validation
Desk Research
Desk work starts with building a clean fact base on the India three-wheeler and EV ecosystem, because official reporting is often split across vehicle classes and agencies. We leaned on public sources such as the Ministry of Road Transport and Highways publications, VAHAN registration dashboards where available, NITI Aayog and related policy notes, and customs trade statistics for key components.
To translate these signals into market value, we also checked press releases, product brochures, dealer communication, and company filings and investor presentations that discuss volumes, price bands, and state-wise activity. Patent databases were used selectively to understand the pace of battery and drivetrain changes that can move average selling prices. For cross-checking corporate financial signals and news coverage, a paid subscription for company financials and a news and financials database were used as supporting inputs. The examples of desk sources listed here are illustrative only, and many other references were reviewed for data collection, validation, and clarification.
Primary Interviews and Surveys
Primary work was used to pressure-test pricing, on-road mix, and the split between passenger and light cargo use, since these are not always visible in public datasets. We spoke with a spread of OEM-side, channel-side, financing and fleet stakeholders, and repair ecosystem participants across major e-rickshaw states, and then rechecked the assumptions where responses diverged.
Distribution of primary research fieldwork respondents
| Company type | Respondent position |
|---|---|
| Top tier: 30% | CXOs: 13% |
| Mid tier: 56% | Functional/Unit leaders: 36% |
| Smaller Players: 14% | Managers: 51% |
Market-Sizing & Forecasting
Sizing starts from a top-down build where registrations and active fleet indicators are used to reconstruct the addressable vehicle pool, which is then converted into annual demand using replacement timing and new additions. From there, market value is calculated by applying observed price bands to the expected mix of regulated categories and use cases.
To keep this realistic, we corroborated totals through selective bottom-up checks, such as sampled dealer quote tracking, typical battery pack and drivetrain cost movements, and a sanity roll-up of shipments implied by key clusters. Inputs that most often move the model include state policy intensity and permit rules, financing availability for owner-drivers, battery chemistry mix (lead-acid versus lithium-ion), charging behavior that affects utilization, and the passenger versus cargo share that changes average selling price.
For forecasting, scenario analysis was applied around policy continuity, credit tightness, and battery price direction, and then the final path was aligned to expert consensus from interviews. When a state-level data series looked thin, we filled gaps using neighboring state adoption patterns and urbanization and last-mile demand signals, and then revalidated the implied totals with channel feedback.
Data Validation & Update Cycle
Outputs are checked in more than one way so one data series does not drive the final number. We compare the modeled value and unit trajectory against independent signals like registration direction, price movement in dealer quotes, and reported subsidy and policy activity, and then obvious variances are investigated before sign-off.
Anomaly checks are done at the state level first and then rolled up, followed by a peer review where assumptions and conversion steps are reworked to confirm they can be repeated. If a major policy update, tariff change, or demand shock is observed, respondents are re-contacted to confirm whether the impact is temporary or structural. Reports are refreshed annually, with interim updates for material events, and a final pre-delivery review is completed so clients receive the latest updated view.
Mordor Intelligence's India Electric Rickshaw Market Size Compared Against Other Published Estimates
Different published market values do not always match because the scope line is drawn differently and the inputs used to convert units into value can vary a lot. Timing can also shift comparisons, since EV volumes in India react quickly to changes in policy, financing, and battery pricing.
Retrofit conversion kits and non-road-legal e-carts sit outside Mordor Intelligence's scope, which can reduce the counted unit pool versus studies that bundle these formats into the same umbrella, especially in states where informal builds are common. Beyond scope, gaps usually come from how average selling price is handled across battery types, whether the series is anchored to registrations or to production mentions, and how currency conversion and inflation are applied to older base years that are then projected forward.
Benchmark comparison
| Source | Market Size | Gaps in Research Methodology |
|---|---|---|
| Mordor Intelligence | USD 1.62 B (2026) | |
| Industry Publisher A | USD 1.15 B (2024) | Uses an earlier base year and a shorter forecast window, and the scope description is broader, which can mix adjacent three-wheeler formats and smooth out recent price and policy shifts. |
| Industry Publisher B | USD 1.55 B (2025) | Applies a longer forecast horizon with a different growth path, and its channel and product mix assumptions can shift the implied ASP upward if organized sales and higher-power variants are weighted more heavily. |
Looking at the three figures together, the spread is mainly explained by what gets counted as an electric rickshaw, the year used to anchor the model, and how price mix is carried forward. By keeping unit signals tied to road-legal vehicles and then layering pricing and mix checks from the field, our estimate stays traceable to clear variables that can be revisited as the market evolves.
Key Questions Answered in the Report
What is the current value of the Indian electric three-wheeler market?
As of 2026, the India electric rickshaw market size is estimated at USD 1.62 billion, and it is projected to reach USD 3.14 billion by 2031, growing at a CAGR of 14.12% during the forecast period (2026-2031).
Which segment is growing fastest in the Indian electric three-wheeler market?
The cargo carrier segment is the fastest-growing by vehicle type, expanding at a 28.10% CAGR through 2031.
How are Battery-as-a-Service models influencing adoption?
BaaS lowers up-front costs by 35–40%, aligns energy payments with vehicle usage, and attracts both fleet operators and individual drivers.
Which battery chemistry is gaining momentum?
Lithium iron phosphate (LFP) batteries are the fastest-growing battery type in the Indian electric rickshaw market, with a 37.10% CAGR.
What policy changes are most impactful?
The extension of federal incentives under EMPS 2024 and Delhi’s mandate to retire ICE three-wheelers by 2025 are two pivotal regulatory drivers.
Which state currently leads in electric three-wheeler sales?
Uttar Pradesh leads with 37.80% of national sales in 2025, supported by strong policy incentives and high urban ridership.