
Market Overview
| Study Period | 2020 - 2031 |
|---|---|
| Forecast Data Period | 2026 - 2031 |
| Base Year Market Size (2025) | USD 6.65 Billion |
| Market Size (2026) | USD 7.25 Billion |
| Market Size (2031) | USD 11.14 Billion |
| Growth Rate (2026 - 2031) | 8.98 % |
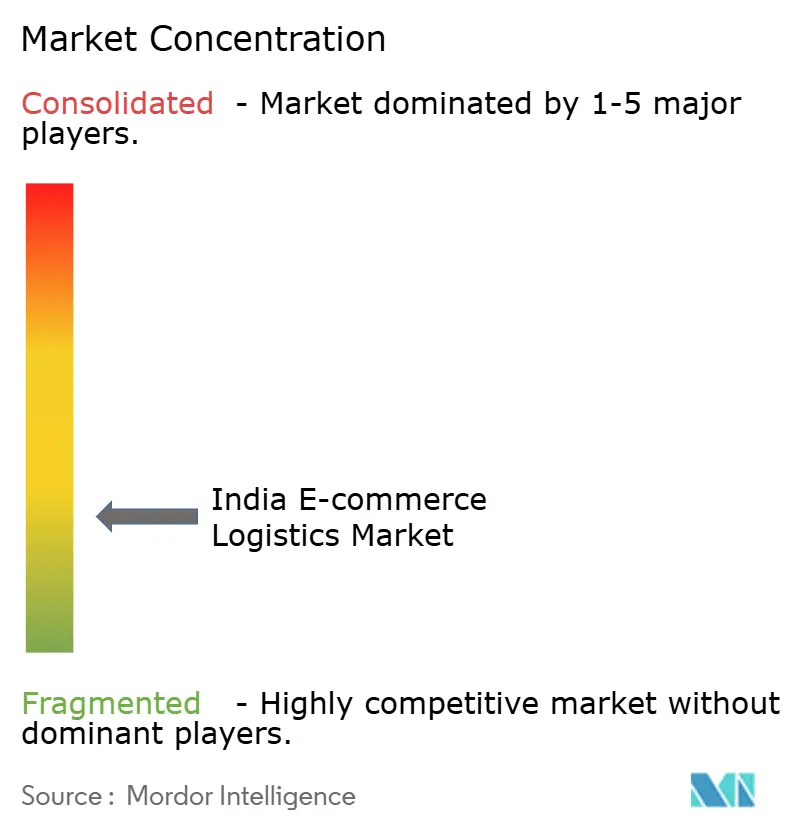
| Market Concentration | Low |
Major Players *Disclaimer: Major Players sorted in no particular order Image © Mordor Intelligence. Reuse requires attribution under CC BY 4.0. | |
India E-commerce Logistics Market Analysis by Mordor Intelligence
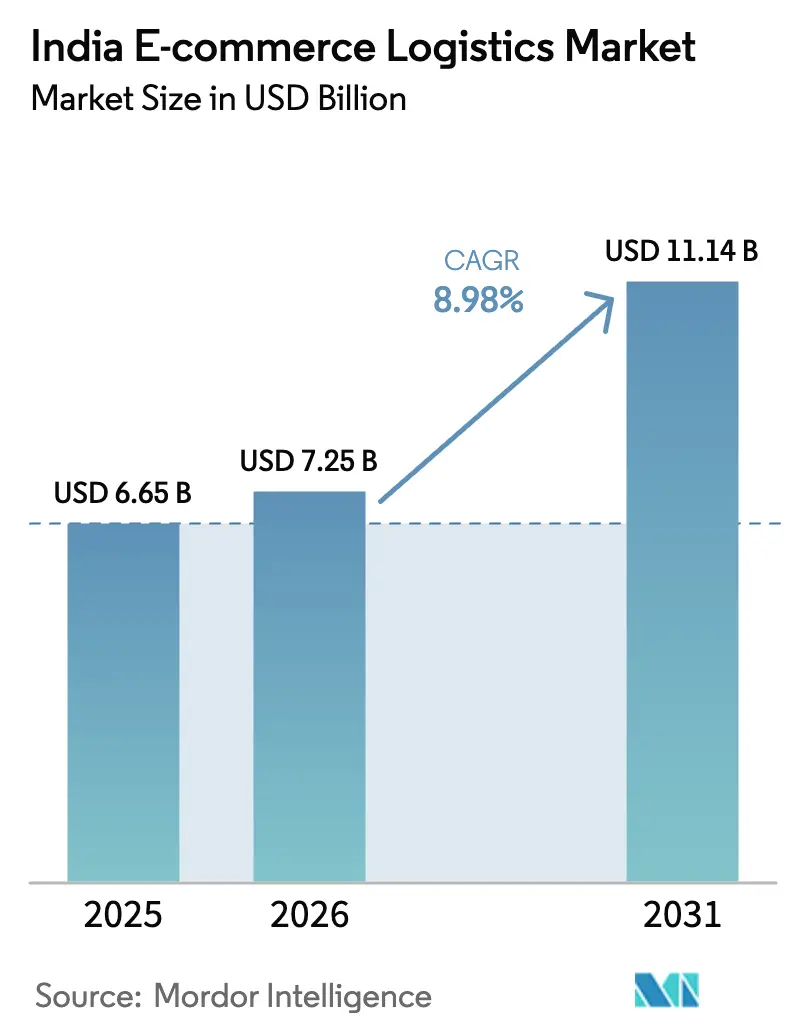
The India E-commerce Logistics Market size was valued at USD 6.65 billion in 2025 and estimated to grow from USD 7.25 billion in 2026 to reach USD 11.14 billion by 2031, at a CAGR of 8.98% during the forecast period (2026-2031).
The expected trajectory mirrors India’s pivot from conventional distribution to technology-enabled fulfillment ecosystems that serve an ever-wider digital consumer base. Value-added services, quick-commerce infrastructure, and rail-based express corridors are reshaping competitive parameters, while government programs such as PM Gati Shakti and the Dedicated Freight Corridor continue to lower structural cost barriers. The Open Network for Digital Commerce (ONDC) is opening capacity for smaller logistics providers, reducing platform dependency, and raising service-quality expectations. Consolidation momentum is evident as scale players integrate automated sorting, predictive analytics, and sustainable fleets to protect margins and deepen regional coverage.
Key Report Takeaways
- By service, Transportation held 71.42% of the India e-commerce logistics market share in 2025 and value-added services are expected to advance at a 7.11% CAGR through 2031.
- By business model, the B2C segment captured 62.58% of the India e-commerce logistics market size in 2025, while C2C shows the fastest expansion at 6.42% CAGR to 2031.
- By destination, domestic deliveries accounted for 90.35% of the India e-commerce logistics market size in 2025; cross-border logistics is forecast to climb at a 6.69% CAGR between 2026 and 2031.
- By delivery speed, standard delivery commanded 50.62% of the India e-commerce logistics market share in 2025; same-day services are set to grow at a 6.09% CAGR to 2031.
- By product category, fashion & lifestyle held 25.58% share of the India e-commerce logistics market size in 2025 and is rising at a 6.41% CAGR through 2031.
- By city tier, tier 3 and below cities represented 40.48% of the India e-commerce logistics market in 2025, underscoring successful digital penetration outside metropolitan areas.
- By region, North dominated with 21.78% share in 2025; West is projected to post a 6.58% CAGR during 2026-2031.
Note: Market size and forecast figures in this report are generated using Mordor Intelligence’s proprietary estimation framework, updated with the latest available data and insights as of 2026.
India E-commerce Logistics Market Trends and Insights
Drivers Impact Analysis*
| Driver | (~) % Impact on CAGR Forecast | Geographic Relevance | Impact Timeline |
|---|---|---|---|
| ONDC-driven MSME onboarding | +1.8% | National, with early gains in Tier 2/3 cities | Medium term (2-4 years) |
| D2C brand proliferation | +1.5% | Urban centers expanding to semi-urban markets | Short term (≤ 2 years) |
| Same-day/quick-commerce boom | +2.1% | Metro cities with spillover to Tier 2 | Short term (≤ 2 years) |
| UPI & digital-payments ubiquity | +1.2% | National, accelerated in rural areas | Long term (≥ 4 years) |
| Rail-based express cargo corridors | +0.9% | Western and Eastern corridors primarily | Long term (≥ 4 years) |
| Growth of social-commerce platforms | +1.4% | National, stronger in regional language markets | Medium term (2-4 years) |
| Source: Mordor Intelligence | |||


ONDC-Driven MSME Onboarding
ONDC removes platform silos, enabling logistics firms to serve multiple seller ecosystems through standardized APIs that cut integration costs and elevate asset utilization. The model especially benefits tier 2 and tier 3 markets where traditional e-commerce reach was limited, spurring fresh revenue channels while forcing incumbents to compete on transparency and service quality. Transaction volumes on ONDC have scaled nationwide, confirming its role in democratizing logistics access[1]Department for Promotion of Industry and Internal Trade, “ONDC Concept Paper,” dpiit.gov.in.
D2C Brand Proliferation
Direct-to-consumer labels demand integrated inventory management, personalized packaging, and agile returns, pushing providers to invest in automation and predictive analytics. SKU proliferation coupled with seasonal surges raises complexity, yet the premium on consumer experience allows higher margins through specialized value-added services. This trend strengthens the adoption of warehouse management systems that synchronize multi-node fulfillment and support differentiated pricing.
Same-Day / Quick-Commerce Boom
Hyperlocal fulfillment has shifted from novelty to baseline expectation in metro zones. Dark stores and micro-fulfillment centers positioned within 3-5 kilometers of residential clusters require capital-intensive real estate and sophisticated routing software. Larger players leverage funding access, while niche hyperlocal specialists capture category-specific growth in groceries, electronics, and fashion. Automated sorting and AI-guided path optimization sustain service levels despite rising order volumes[2]Bloomberg News Desk, “Quick-commerce players accelerate infrastructure rollout,” bloomberg.com.
UPI and Digital-Payments Ubiquity
Unified Payments Interface diminishes cash-on-delivery friction, improving working-capital cycles and delivery success rates. UPI volumes exceeded 20 billion transactions in August 2025, with e-commerce forming a growing share[3]National Payments Corporation of India, “UPI Statistics August 2025,” npci.org.in. Real-time settlements allow smaller logistics vendors to meet enterprise standards, and embedded financial services generate new revenue streams.
Restraints Impact Analysis*
| Restraint | (~) % Impact on CAGR Forecast | Geographic Relevance | Impact Timeline |
|---|---|---|---|
| Sub-optimal rural road & warehousing infra | -1.4% | Rural and semi-urban areas, Eastern states | Long term (≥ 4 years) |
| High product-return / COD ratio | -0.8% | National, more pronounced in Tier 2/3 cities | Medium term (2-4 years) |
| Draft e-commerce rules & data-localisation costs | -0.6% | National, higher impact on cross-border operations | Medium term (2-4 years) |
| Stricter ESG & decarbonisation compliance | -0.4% | Urban centers and industrial corridors | Long term (≥ 4 years) |
| Source: Mordor Intelligence | |||
Sub-Optimal Rural Road & Warehousing Infrastructure
Connectivity gaps increase per-shipment costs and elongate delivery windows in rural markets. Warehousing shortages restrict temperature-sensitive and bulky product categories, limiting SKU variety. Government road initiatives continue to narrow the gap, yet infrastructure development trails e-commerce demand[4]Ministry of Rural Development, “Pradhan Mantri Gram Sadak Yojana progress update,” pmgsy.nic.in. Reverse logistics complexities further raise costs where transport options remain sparse.
High Product-Return / COD Ratio
Elevated return-to-origin levels inflate reverse logistics expenditure, and cash-on-delivery orders intensify payment-collection risk. Fashion categories drive the highest returns, requiring AI-driven quality checks and specialized processing hubs. Smaller providers face working-capital pressure from multiple delivery attempts and delayed settlements, making technology investments essential for margin protection.
*Our forecasts treat driver/restraint impacts as directional, not additive. The impact forecasts reflect baseline growth, mix effects, and variable interactions.
Segment Analysis
By Service: Value-Added Services Capture Premium Demand
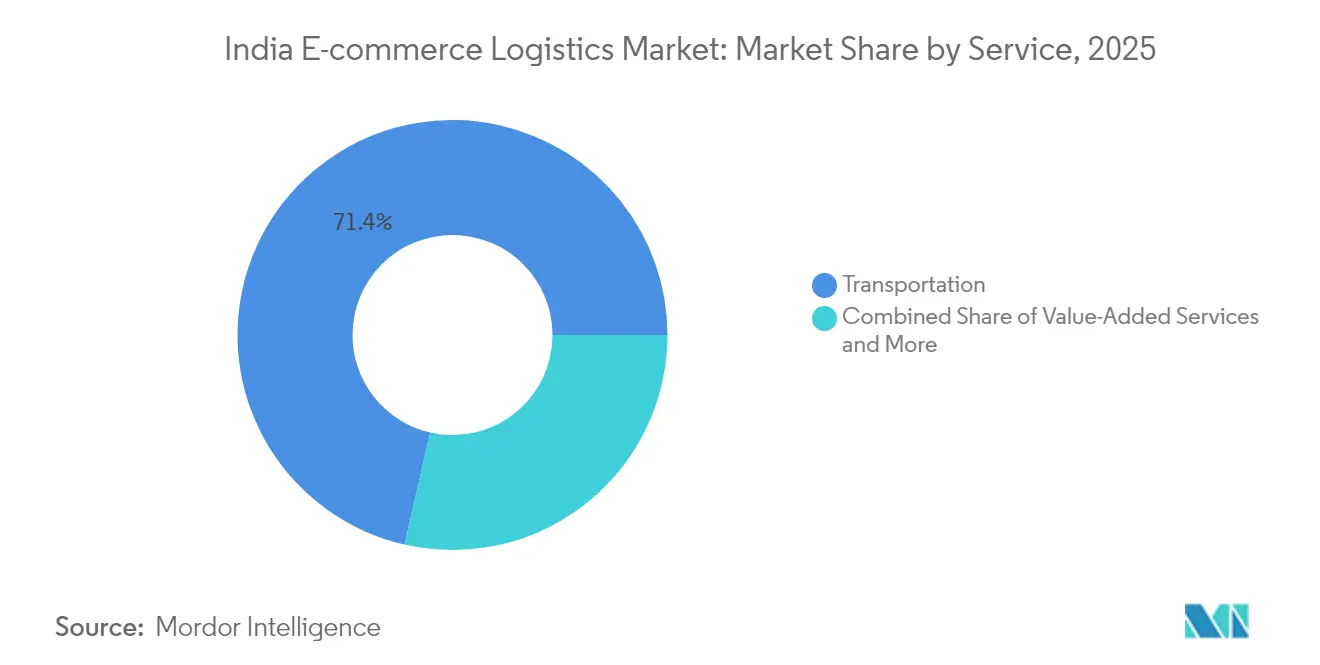
Transportation generated 71.42% of the India e-commerce logistics market share in 2025, and the Value-Added Services segment CAGR stands at 7.11% to 2031. Providers offering branded packaging, kitting, and inspection enjoy strong pricing power. Transportation faces commoditization, but road haulage still offers the volume backbone for the India e-commerce logistics market. Rail improvements shorten transit times for bulk shipments, and air freight remains critical for time-sensitive cross-border parcels.
Technology-driven automation in warehousing cuts error rates and supports scale, while AI-enabled quality control allows providers to expand without proportional cost escalation. These capabilities sustain customer-retention strategies and create competitive barriers.


By Business Model: B2C Remains the Center of Gravity
The B2C segment contributed 62.58% to the India e-commerce logistics market size in 2025 and continues to set service-level benchmarks. The C2C corridor, propelled by social-commerce activity, is advancing at a 6.42% CAGR (2026-2031) and demands professional tracking, insurance, and support for individual entrepreneurs. B2B shipments offer stability but yield lower technology differentiation opportunities.
B2C growth aligns with rising quick-commerce expectations and widespread smartphone adoption, compelling providers to refine last-mile networks and customer-communication tools. Social-commerce expansion amplifies the need for scalable micro-fulfillment solutions that meet individualized seller requirements.
By Destination: Domestic Dominance with Cross-Border Upside
Domestic deliveries dominated with 90.35% of the India e-commerce logistics market size in 2025, reflecting India’s vast internal consumption. Cross-border services, while smaller, are growing at a 6.69% CAGR through 2031 as exporters leverage customs digitization under the National Single Window System.
Unified Goods and Services Tax compliance supports nationwide distribution, and new economic corridors shorten domestic transit. For international sellers, specialized customs brokerage and multimodal solutions enable premium pricing and erect entry barriers.
By Delivery Speed: Standard Keeps Cost Leadership
Standard delivery controlled 50.62% of the India e-commerce logistics market in 2025. Consolidated routing sustains the lowest per-unit cost, appealing to price-sensitive consumers. Same-day delivery, though niche, grows at a 6.09% CAGR (2026-2031) as affluent metro shoppers pay for convenience.
Next-day serves the middle ground, while >5-day “Others” absorb bulk, non-urgent traffic through rail and sea. Route-optimization algorithms help shorten windows without linear cost growth, nudging the market toward faster norms without compromising profitability.
By Product Category: Fashion Drives Service Innovation
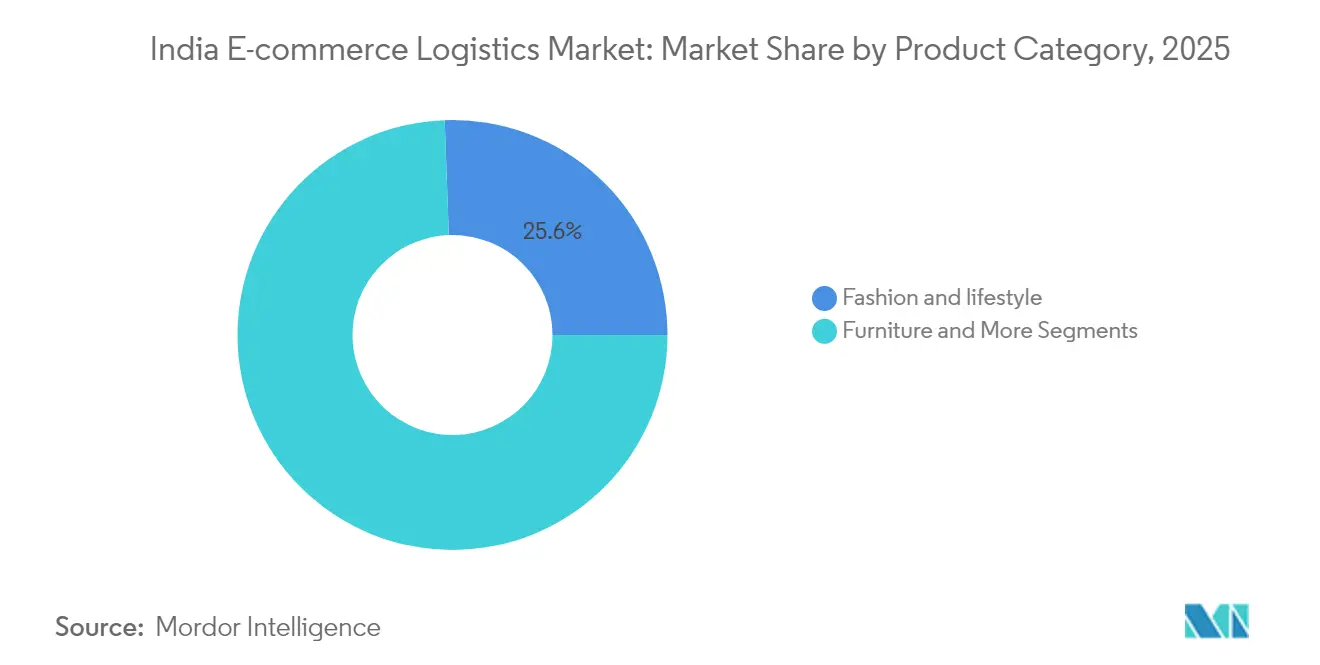
Fashion & lifestyle retained a 25.58% share of the India e-commerce logistics market size in 2025 and leads growth at a 6.41% CAGR (2026-2031). High return ratios compel investment in reverse logistics facilities and AI-based recommendation engines. Electronics logistics commands higher insurance and security layers, whereas foods & beverages rely on cold-chain assets that few competitors can match.
Personal care enjoys predictable demand and lower returns, supporting efficient capacity planning. Furniture requires bulky goods handling and assembly options, opening another specialization avenue.
By City Tier: Tier 3 Penetration Reshapes Network Design
Tier 3 and below cities formed 40.48% of the India e-commerce logistics market in 2025, fueled by vernacular interfaces and data-affordable connectivity. Hub-and-spoke extensions, local entrepreneur partnerships, and alternative pickup points allow cost-effective outreach despite lower shipment density. Tier 1 volumes remain high but face saturation, while tier 2 balances growth potential with infrastructure readiness.
Geography Analysis
The North retained 21.78% of the India e-commerce logistics market in 2025, benefiting from established manufacturing clusters and multimodal corridors. Delhi NCR acts as a central gateway, and newly sanctioned Multi-Modal Logistics Parks strengthen throughput. Western Dedicated Freight Corridor sections are already cutting transit times and enhancing capacity.
The West is the fastest-growing region at 6.58% CAGR (2026-2031), leveraging Maharashtra’s diversified consumer base and Gujarat’s port-centric export focus. Integrated sea-land solutions support international parcel flows, and special economic zones add industrial demand.
Regulatory Landscape
India e-commerce logistics operates under multi-agency compliance covering indirect taxes, customs, and product standards. GST e-way bills underpin domestic movement, while DGFT-linked processes govern export documentation. A notable 2026 update for cross-border parcel flows was CBIC Circular 17/2026-Customs (March 31, 2026), which removed the INR 10 lakh consignment value cap on courier exports, widening the addressable export parcel mix for express and courier networks.
For service providers managing cross-border transactions and platform-linked logistics, tax and supply-rule clarifications also affect contract structuring and invoicing. Finance Act 2026 addressed aspects of intermediary service place-of-supply disputes under IGST. Meanwhile, a Single Window clearance mechanism for regulated categories (food, drugs, animal products) being operational as of April 2026 increases end-to-end compliance requirements for e-commerce sellers and their logistics partners. Mandatory BIS standards in select product categories (for example, electronics and toys) and ongoing discussions around data localization and draft e-commerce rules continue to shape how logistics firms design KYC, traceability, and documentation workflows.
Value Chain Analysis
The India e-commerce logistics value chain runs from seller onboarding and order capture (marketplaces, D2C brands, and ONDC-linked sellers) to inbound storage and fulfillment, then linehaul (road-led with rising rail and air roles) and last-mile execution supported by returns and value-added services. National integrators and express firms (for example, Delhivery, Blue Dart, XpressBees, Shadowfax, and DTDC) compete alongside captive networks such as Ekart and Amazon Supply Chain Services, which increasingly sell 3PL-like capabilities beyond their own marketplaces. This raises expectations on delivery promise, tracking, and pricing.
Operationally, automated hubs, route-optimization software, and structured reverse logistics are becoming core enablers as networks extend into tier 2/3 and tier 3-and-below cities, which represented 40.48% of market demand in 2025. Multimodal Logistics Parks act as aggregation points for warehousing and, where relevant, customs-related processes, reducing intermediate handling and improving lane economics. On the transport layer, the rail freight ecosystem is moving toward broader containerization and specialized equipment for cargo traditionally handled by road, complementing road linehaul for cost-efficient long-distance moves while air express remains important for time-sensitive parcels.
Competitive Landscape
India e-commerce logistics market competition remains fragmented, yet is consolidating. Acquisitions such as Delhivery’s purchase of Ecom Express underscore the trend toward scale integration and national network extension. Leaders invest in AI-powered route optimization, automated sorting, and warehouse robotics to improve cost-to-serve metrics.
Three strategic strata define the landscape. National players combine extensive networks with full-stack services. Regional specialists focus on territory or vertical depth, often providing temperature-controlled or bulky-goods handling. Technology-driven startups capture hyperlocal and quick-commerce niches.
Sustainability variables enter bidding tables as ESG compliance tightens. Electric vehicle fleets, solar-powered hubs, and carbon-tracking dashboards differentiate service offerings and attract enterprise contracts. Providers with capital to adopt green technology early gain an advantage.
India E-commerce Logistics Industry Leaders
Delhivery
Ekart Logistics
XpressBees
Blue Dart Express
DTDC
- *Disclaimer: Major Players sorted in no particular order

Market Opportunities and Future Outlook
Cross-border e-commerce parcels offer a clearer monetization pathway where policy and process changes reduce friction. The March 31, 2026 CBIC Circular 17/2026-Customs removal of the INR 10 lakh consignment value cap on courier exports expands feasible shipment profiles for express players. At the same time, customs digitization under the National Single Window System supports faster clearances for regulated goods categories where it is operational. In parallel, policy consideration around allowing FDI in inventory-based e-commerce strictly for export, with mandated separate warehousing, creates whitespace for export-focused fulfillment. This includes bonded and near-port processing, and compliant returns and replacement flows designed for international buyers.
Domestic opportunities are centered on network densification and cost-to-serve reduction as quick-commerce and tiered-city penetration push service-level requirements higher. Captive and marketplace-linked logistics arms (Amazon Supply Chain Services and Ekart) scaling third-party logistics offerings increases procurement options for brands and MSMEs. That development pressures independent providers to differentiate through value-added services, automated hubs, and returns processing for high-return categories such as fashion. Decarbonization and operating-cost programs also open procurement and partnership lanes in last mile, supported by Delhiverys plan to deploy 1,500 Bajaj electric three-wheelers, which ties sustainability bids and unit economics to fleet transitions across dense urban and tier 2/3 routes.
Recent Industry Developments
- July 2026: DTDC Express Ltd. launched the DTDC Bharat One Hub at Rathiwas, Haryana, to expand its logistics infrastructure in North India. Expands national network capacity; strengthens North India last-mile coverage. Enhances competitive reach and service levels in a key growth region, supporting broader market expansion plans.
- June 2026: Delhivery and Bajaj Auto partnered to deploy 1,500 Bajaj RIKI eCarts for last-mile delivery, starting with 200 units in Tier-2/3 cities. Electrified last-mile fleet deployment for e-commerce logistics. Accelerates electrification and micro-fulfillment strategy; expands reach into smaller cities.
- June 2026: Flipkart is expanding Minutes quick-commerce service to 1,500 micro-fulfillment centers by end of 2026. Strengthens quick-commerce footprint and delivery speed across network. Bolsters competitive differentiation in quick-commerce; supports high-frequency delivery economics.


Research Methodology Framework and Report Scope
Market Definition and Coverage
For this study, we define India e-commerce logistics as the paid logistics services used to move, store, and deliver online orders within India, from seller pickup through line haul, sortation, warehousing, and last mile delivery.
Scope exclusions: We exclude non-logistics platform revenues (such as marketplace commissions or payment fees) and the value of goods sold.
Segmentation Overview
- By Service
- Transportation
- Road
- Rail
- Air
- Sea
- Warehousing & Fulfilment
- Value-Added Services (Labelling, Packaging, Kitting)
- Transportation
- By Business Model
- B2C
- B2B
- C2C
- By Destination
- Domestic
- Cross-border (international)
- By Delivery Speed
- Same-day (less than 24 h)
- Next-day (24–48 h)
- Standard (3-5 days)
- Others (more than 5 days)
- By Product Category
- Foods & Beverages
- Personal & Household Care
- Fashion & Lifestyle (accessories, apparel, footwear)
- Furniture
- Consumer Electronics & Household Appliances
- Other Products
- By City Tier
- Tier 1
- Tier 2
- Tier 3 and Below
- By Region (India)
- North
- South
- East
- West
- Central
Data Sources, Market Sizing, and Validation
Desk Research
Desk work starts by mapping the demand pool for online parcels and freight, then linking it to logistics service spending in India. Public statistics and policy releases help anchor operating realities, including Ministry of Road Transport and Highways updates, India Post disclosures, DPIIT logistics and warehousing policy notes, and customs trade data (Directorate General of Commercial Intelligence and Statistics) for cross-border directionality.
To keep the model grounded, we also use evidence that reflects parcel intensity and service capability, such as National Highway Authority of India corridor updates, Airports Authority of India cargo throughput trends, and Reserve Bank of India publications that indicate changes in digital commerce activity. Company annual reports, investor presentations, and credible press are used to validate capacity additions, hub expansions, and service mix changes, supported by paid subscriptions for company financials and intelligence, news and financials, and shipment-level import and export checks where relevant. The desk sources listed here are illustrative only, and we referred to many other public and paid sources for data collection, validation, and clarification.
Primary Interviews and Surveys
Primary work is used to pressure-test what desk signals cannot fully explain, especially the service mix within e-commerce logistics and the pricing logic by lane, weight slab, and delivery speed. We spoke with operators, 3PL managers, warehousing and fulfillment specialists, and large shippers across India so assumptions on volumes, utilization, and surcharges could be corrected before finalizing the numbers.
Distribution of primary research fieldwork respondents
| Company type | Respondent position |
|---|---|
| Top tier: 39% | CXOs: 12% |
| Mid tier: 40% | Functional/Unit leaders: 36% |
| Smaller Players: 21% | Managers: 52% |
Market-Sizing & Forecasting
We size the market using a top-down and bottom-up approach, where the top-down build starts from India e-commerce activity and then reconstructs logistics spending using a serviceability and pricing layer. The demand pool is shaped using indicators such as order and parcel growth by category, delivery-speed mix (same-day versus standard), share of domestic versus cross-border flows, city-tier dispersion that changes stem length, and the typical cost per shipment for transportation and for warehousing and fulfillment. Because fulfillment intensity differs across product types, the model applies different storage days, handling touches, and return rates (reverse logistics) before revenue is calculated.
To keep totals realistic, we corroborate outputs with selective bottom-up approximations, including sampled price-per-shipment checks by weight slab and distance band, warehouse capacity and utilization sense checks, and operator revenue splits between transportation and fulfillment. When coverage gaps exist in bottom-up checks, we use conservative ranges and then narrow them through follow-up calls and cross-checks against publicly visible capacity additions.
For forecasting, scenario analysis is applied around the variables that most often swing logistics revenue, which are ASP movement from fuel and line haul costs, discounting patterns in last mile, changes in return rates, and the pace of quick delivery adoption in major cities. The final forecast path is aligned to consensus views from primary respondents on how service levels, surcharge structures, and network density are likely to evolve.
Data Validation & Update Cycle
Validation is done in several steps so that outliers are caught early and assumptions are not carried forward by mistake. We compare modeled revenue against independent operating signals, such as cargo throughput trends, warehousing additions, and cross-border shipment movement, and then investigate variances by service line and destination type.
Before sign-off, another analyst reviews the inputs, the calculation flow, and the reasonableness of ASPs and volume growth. We re-contact sources when a major mismatch appears. Reports refresh annually, and interim updates are triggered when material events occur, such as sharp fuel movement, a policy change affecting logistics, or a visible shift in delivery-speed mix. Right before delivery, a final pass is completed so clients receive an updated view based on the latest available data.
Mordor Intelligence's India E Commerce Logistics Market Size Versus Other Published Estimates
Published numbers for India e-commerce logistics do not always match because the market boundary can shift in small but meaningful ways, and timing assumptions can also move the final figure. Differences usually come from what is counted as logistics revenue versus adjacent platform income, how cross-border legs are treated, and whether pricing is kept current with fuel and surcharge changes.
A key driver is refresh cadence and currency timing, since logistics ASPs can change within a year as networks rebalance and discounting moves between lanes and city tiers. When ASP updates are aligned to recent pricing signals and then validated with operator feedback before conversion into USD, the result stays closer to what shippers actually pay, which is the approach used in the 2025 estimate reported by Mordor Intelligence.
Benchmark comparison
| Source | Market Size | Gaps in Research Methodology |
|---|---|---|
| Mordor Intelligence | USD 6.65 B (2025) | |
| Industry Association A | USD 7.40 B (2025) | This figure appears to use a broader logistics spend boundary that can fold in seller-side enablement charges and selected platform-led delivery fees, which lifts the total above pure logistics services. |
| Trade Journal B | USD 5.90 B (2025) | This estimate seems to rely on older average rate cards and a narrower service mix, which can understate warehousing and fulfillment revenue and miss the impact of rapid shifts in delivery-speed and returns. |
The spread in the table is mostly explained by how tightly logistics-only revenue is separated from adjacent e-commerce income, and by how often pricing and mix are refreshed. By keeping assumptions traceable to shipment activity, service mix, and updated ASP logic, we arrive at a practical number that can be repeated and checked year after year.


Key Questions Answered in the Report
How big will the India e-commerce logistics market be by 2031?
It is projected to reach USD 11.14 billion, growing at a 8.98% CAGR from 2026 to 2031.
Which service segment holds the largest share?
Transportation commanded 71.42% of market share in 2025, driven by the surge in e-commerce shipments and the growing need for faster, last-mile delivery solutions.
What region is expanding the fastest?
The West is growing at 6.58% CAGR, supported by port infrastructure and industrial diversification.
How are quick-commerce models affecting logistics networks?
Same-day demand drives dark-store investments and AI-based route optimization, pushing capital toward hyperlocal fulfillment.
What is the main barrier to rural e-commerce expansion?
Inadequate road and warehousing infrastructure increases delivery costs and complicates reverse logistics workflows.
Why are returns a significant challenge in fashion logistics?
High sizing-related returns trigger expensive reverse logistics, prompting providers to build dedicated processing hubs and predictive quality systems.
Page last updated on:


 Your data is secure and never sold or shared.


