
Market Overview
| Study Period | 2020 - 2031 |
|---|---|
| Forecast Data Period | 2026 - 2031 |
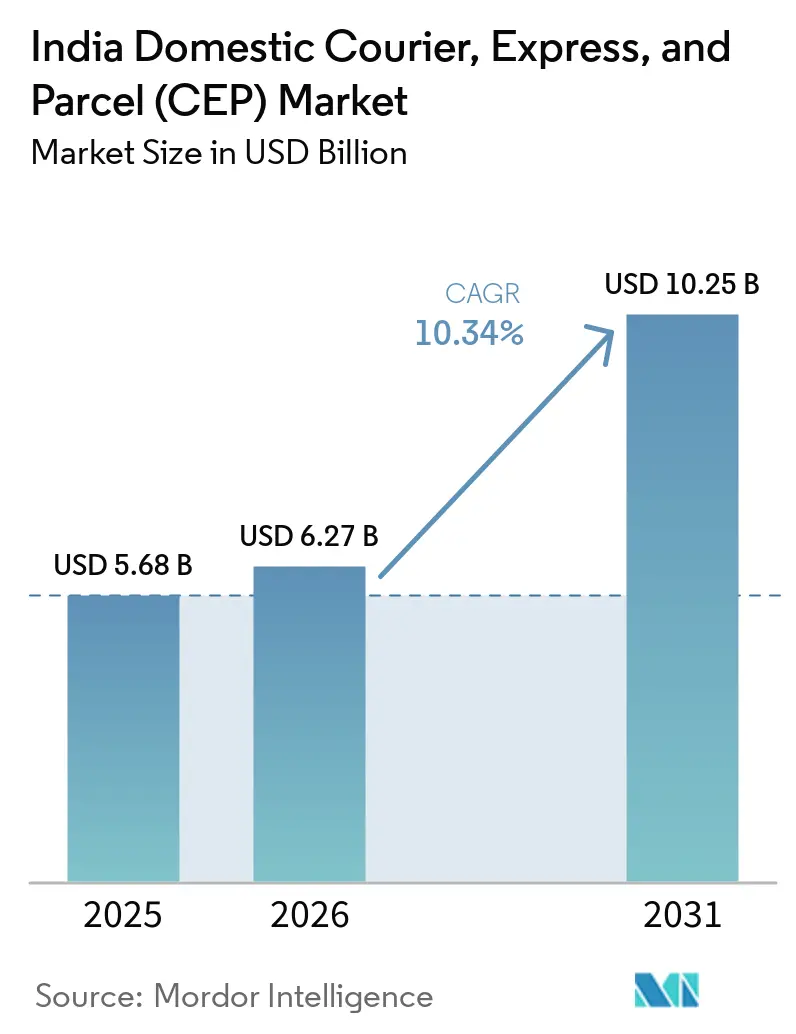
| Base Year Market Size (2025) | USD 5.68 Billion |
| Market Size (2026) | USD 6.27 Billion |
| Market Size (2031) | USD 10.25 Billion |
| Growth Rate (2026 - 2031) | 10.34 % |
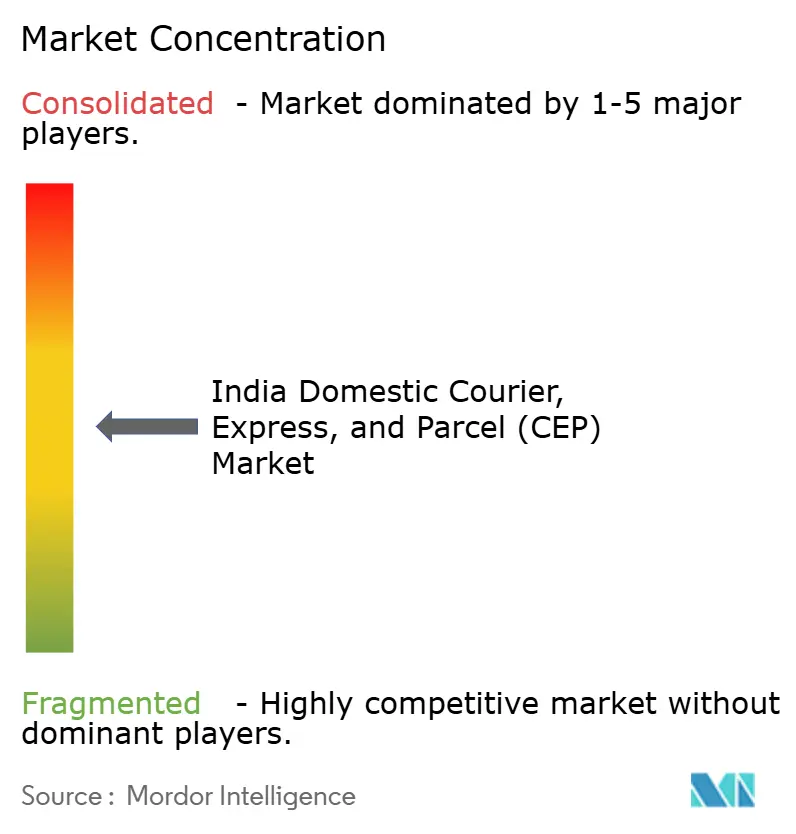
| Market Concentration | Medium |
Major Players *Disclaimer: Major Players sorted in no particular order Image © Mordor Intelligence. Reuse requires attribution under CC BY 4.0. | |
India Domestic Courier, Express, and Parcel (CEP) Market Analysis by Mordor Intelligence
The India Domestic Courier, Express, And Parcel market size in 2026 is estimated at USD 6.27 billion, growing from 2025 value of USD 5.68 billion with 2031 projections showing USD 10.25 billion, growing at 10.34% CAGR over 2026-2031.
Rapid e-commerce penetration in tier-II and tier-III cities, expansion of direct-to-consumer (D2C) brands, and sustained government investment in logistics corridors collectively accelerate parcel volumes and reshape service expectations across the India domestic courier market. Technology adoption—from automated sorters to AI-based route optimization—has lowered sector logistics costs from 16% to nearly 10% of GDP, though the figure still trails global benchmarks and leaves ample headroom for efficiency-driven players in the India domestic courier market. Express services, air cargo capacity additions, and hyperlocal fulfillment networks further strengthen competitive intensity as consumers increasingly view same-day or next-day delivery as the norm in the India domestic courier market. Consolidation momentum favors well-funded operators that can scale automation investments quickly, while smaller courier firms face margin pressure in an ecosystem that prizes data visibility, speed, and service consistency.
Key Report Takeaways
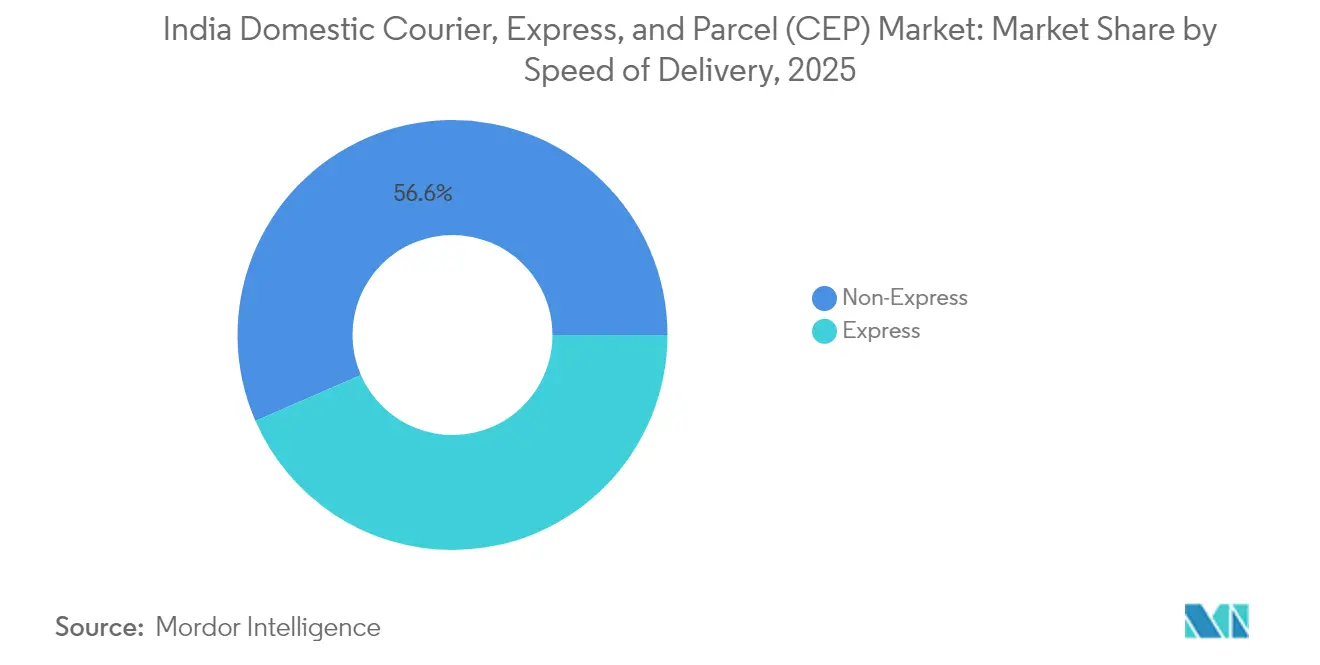
- By speed of delivery, non-express services held 56.55% of the India domestic courier market share in 2025, whereas express services are forecast to expand at an 11.07% CAGR through 2031.
- By shipment weight, light packages accounted for 71.91% share of the India domestic courier market size in 2025, with light-weight consignments advancing at a 10.63% CAGR through 2031.
- By end-user industry, manufacturing led with 32.62% revenue share in 2025; e-commerce is projected to record the highest CAGR at 11.26% to 2031.
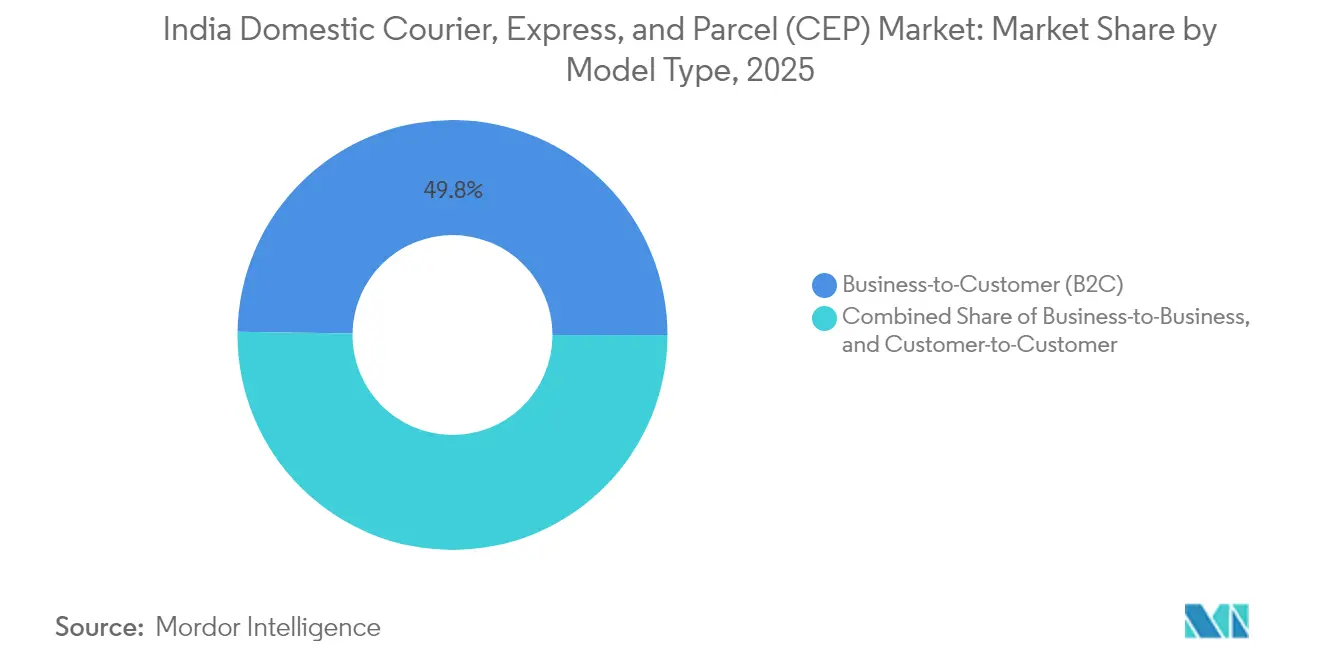
- By model, the B2C segment commanded 49.76% share of the India domestic courier market size in 2025 and is poised to accelerate at a 12.33% CAGR between 2026-2031.
- By mode of transport, road captured 70.27% of the India domestic courier market share in 2025, while air cargo is anticipated to grow at a 10.72% CAGR through 2031.
Note: Market size and forecast figures in this report are generated using Mordor Intelligence’s proprietary estimation framework, updated with the latest available data and insights as of 2026.
India Domestic Courier, Express, and Parcel (CEP) Market Trends and Insights
Drivers Impact Analysis*
| Driver | (~) % Impact on CAGR Forecast | Geographic Relevance | Impact Timeline |
|---|---|---|---|
| E-commerce boom and tier-II/III penetration | +2.8% | National, with concentrated gains in tier-II/III cities | Medium term (2-4 years) |
| National Logistics Policy and infra push | +2.1% | National, with early gains in freight corridors and metro connectivity | Long term (≥ 4 years) |
| Warehouse Automation Surge and Foreign Direct Investment Inflows | +1.9% | Metro cities and industrial hubs, expanding to tier-II cities | Medium term (2-4 years) |
| Consumer Demand for Same or Next-Day Delivery | +2.3% | Urban centers, expanding to tier-II cities | Short term (≤ 2 years) |
| D2C brands' shift to B2B parcels | +1.2% | National, concentrated in manufacturing and consumer goods hubs | Medium term (2-4 years) |
| ONDC Open-Network Enablement | +0.8% | National, with stronger impact in smaller cities and rural areas | Long term (≥ 4 years) |
| Source: Mordor Intelligence | |||
E-commerce boom and tier-II/III penetration
The India domestic courier market experiences a parcel-volume multiplier as tier-II and tier-III locations now generate more than 60% of new online shoppers. Smartphone affordability and ubiquitous UPI payments compress the digital adoption lifecycle, leading to order frequencies in smaller cities that mirror metro norms within two years of onboarding. Quick-commerce platforms collectively operate in 92 non-metro cities, yet lower order densities—350 parcels per day versus 1,100 in metros—pressure delivery economics. Government programs such as BharatNet and Digital India supply the connectivity backbone that lowers entry barriers for couriers. As a result, branded parcel networks race to establish spoke facilities closer to emerging demand pockets, stimulating job creation and intensifying intra-regional competition across the India domestic courier market[1].
National Logistics Policy and infrastructure push
A unified logistics vision aims to compress sector costs toward an 8–9% share of GDP through multimodal corridor development and 100 planned multimodal logistics parks. Dedicated freight corridors and the Unified Logistics Interface Platform promise a 15–20% cut in paperwork, bolstering transparency and throughput across the India domestic courier market. Capital expenditure of INR 11.2 trillion in FY 26, including INR 1.5 trillion in interest-free state loans, accelerates road, rail, and port upgrades that shrink transit times. The Eastern Dedicated Freight Corridor completion and expansion of 120 regional airports under the UDAN scheme widen modal choice, making it economical to blend air and surface legs for time-sensitive parcels. Enhanced knotting of metro spokes with hinterland hubs is expected to unlock latent rural consumption, lifting CAGR projections by an additional 2.1 percentage points[2].
Warehouse automation surge and FDI inflows
As labor costs edge higher and accuracy targets tighten, couriers escalate investments in automated guided vehicles, high-speed sorters, and AI-enabled inventory platforms. India drew a record USD 1.1 billion in logistics startup funding during 2014-2023, with 44% of such firms headquartered in tier-II and tier-III cities—evidence of geographic democratization of innovation. Ecom Express earmarked INR 2.35 billion for sorter automation in its IPO filing, signalling sector-wide movement toward lights-out facilities. Cloud migration goals—such as Allcargo targeting 80% of workloads on cloud create real-time visibility that drives higher truckfill rates and better asset returns.
Consumer demand for same- or next-day delivery
Quicker fulfillment commands premium willingness to pay, transforming express delivery from an optional service into an expected baseline in leading metros. Quick-commerce operators collectively manage about 4,000 dark stores, compelling courier partners to adapt to micro-fulfillment models that rely on precise demand forecasts and narrow delivery windows. The India domestic courier market answers by deploying predictive positioning algorithms that pre-stage inventory near consumption hot-spots. Yet economics remain tight in non-metro zones where order density rarely supports sub-15-minute targets. Emerging 10-minute delivery pilots pressure networks to re-architect last-mile fleets, blending two-wheeler riders, electric vans, and parcel lockers to protect margins without compromising speed.
Restraints Impact Analysis*
| Restraint | (~) % Impact on CAGR Forecast | Geographic Relevance | Impact Timeline |
|---|---|---|---|
| High logistics cost-to-GDP and fragmentation | -1.8% | National, with acute impact in rural and remote areas | Long term (≥ 4 years) |
| Rural infrastructure gaps | -1.4% | Rural areas and tier-III cities, affecting last-mile connectivity | Long term (≥ 4 years) |
| Gig-worker attrition | -1.1% | Urban centers and metro cities, with spillover to tier-II cities | Short term (≤ 2 years) |
| Platform in-house delivery bias | -0.9% | National, concentrated in e-commerce hubs and major cities | Medium term (2-4 years) |
| Source: Mordor Intelligence | |||
High logistics cost-to-GDP and fragmentation
Operational fragmentation persists, with 90% of logistics firms in the unorganized bracket and 67% operating fleets of fewer than five trucks. This structure limits economies of scale, hinders technology uptake, and raises per-shipment costs in the India domestic courier market. State-specific regulatory nuances despite GST create duplicate compliance layers that erode margins. Inconsistent addressing standards cause delivery reroutes and elevate last-mile expenses, while poor modal integration restricts network optimization. Collectively, these inefficiencies subtract roughly 1.8 percentage points from projected market CAGR[3].
Rural infrastructure gaps
Last-mile delivery into rural zones often costs up to 25% more than urban equivalents because of sub-par road quality and dispersed demand nodes. Only 35–40% of warehousing meets Grade-A benchmarks, restricting deployment of automated sorting solutions that could offset higher transport costs. Monsoon-linked disruptions raise trucking rates by as much as 15%, undercutting service reliability during peak agricultural seasons. Cash-on-delivery remains prevalent owing to digital-payment limitations in many villages, inflating working-capital needs and extending reconciliation cycles for courier operators in the India domestic courier market.
*Our forecasts treat driver/restraint impacts as directional, not additive. The impact forecasts reflect baseline growth, mix effects, and variable interactions.
Segment Analysis
By Speed of Delivery: Express momentum outpaces legacy bulk shipping
Express consignments climbed at an 11.07% CAGR through 2031 as urban consumers normalized same-day and next-day fulfillment, a trend that elevated premium parcel demand within the India domestic courier market size. Quick-commerce platforms account for a growing share of express volumes after collectively opening more than 4,000 dark stores that promise 10- to 30-minute delivery windows in primary metros. Non-express options remain dominant at 56.55% share, especially for B2B manufacturing shipments where cost efficiency outweighs rapidity.
Advanced route-optimization engines and predictive loading enable couriers to lower cost per express parcel, narrowing the historical pricing gap with non-express services. Shadowfax reports operational profitability even with hyperlocal deliveries comprising nearly 30% of its traffic, underscoring technology’s role in defending margins. Nevertheless, lower order densities in tier-II and tier-III cities extend express windows to 15-60 minutes, prompting asset-light models that leverage partner fleets for flexibility across the India domestic courier market.

By Shipment Weight: Light parcels anchor e-commerce expansion
Light-weight shipments captured 71.91% of the India domestic courier market share in 2025, fueled by mobile-first shopping behaviors that generate frequent low-value orders rather than bulk purchases. Pricing models based on dimensional weight encourage couriers to refine packaging algorithms that minimize box volume and reduce air cargo surcharges.
Sustainability considerations add complexity as regulators push for recyclable materials, leading firms to pilot compostable pouches and reusable totes in top cities. Uber’s Courier XL, which transports parcels up to 750 kg in 3- and 4-wheeler vehicles, illustrates a parallel push into heavier segments aimed at balancing vehicle utilization across the India domestic courier market.
By End User Industry: Manufacturing scale meets e-commerce velocity
Manufacturing held 32.62% of total value in 2025, reflecting India’s ascent as a global production hub that demands synchronized inbound and outbound logistics. The India domestic courier market size for manufacturing couriers benefits from industrial corridor upgrades that compress factory-to-port lead times.
E-commerce, however, grows fastest at 11.26% CAGR through 2031 as rural online adoption accelerates; smaller ticket sizes and higher return rates require integrated reverse logistics capabilities. Allcargo’s focus on MSME clusters underscores a strategy that bridges manufacturing and e-retail, enabling hybrid B2B-B2C flows that optimize truckload factors.
By Model: B2C dominance reshapes service playbooks
B2C deliveries led with 49.76% share in 2025 and are forecast to grow at a 12.33% CAGR as D2C brands shortcut traditional retail chains, deepening parcel density in residential neighborhoods. Greater consumer scrutiny of tracking accuracy drives couriers to provide live ETAs, real-time driver communication, and frictionless returns—capabilities that require robust digital cores across the India domestic courier market.
B2B shipments sustain volume heft in industrial belts but expand modestly because supply-chain re-engineering stresses efficiency rather than scale. C2C parcels rise on the back of peer-to-peer resale platforms, pushing couriers to experiment with automated drop-boxes and parcel lockers in gated communities to contain costs without sacrificing convenience.
By Mode of Transport: Road backbone faces strategic airlift expansion
Road transport retained 70.27% share thanks to network redundancy and the flexibility to tap even remote PIN codes within the India domestic courier market. Bharatmala highway expansion and a gradual shift toward electric delivery vans promise lower per-kilometer costs and reduced carbon footprints over the medium term.
Air cargo, while smaller, posts a 10.72% CAGR as newer regional airports under the UDAN scheme boost coverage and give couriers speed options for high-value electronics, fashion, and pharmaceutical products. DHL’s addition of eight aircraft for intra-India loops indicates that time-critical freight warrants dedicated lift capacity. Rail and waterways remain niche due to network gaps and handling constraints, though multimodal trials linked to dedicated freight corridors could unlock specialized opportunities.
Geography Analysis
India’s eight largest metros—Mumbai, Delhi NCR, Bangalore, Chennai, Hyderabad, Pune, Kolkata, and Ahmedabad—collectively generate roughly 83-85% of quick-commerce sales, anchoring the majority of parcel flows within the India domestic courier market. Government infrastructure programs such as PM Gati Shakti aim to knit these metros to tier-II and tier-III cities via freight corridors, multimodal parks, and logistic clusters that promise shorter lead times and lower cost variability.
Tier-II growth hubs—including Surat, Jaipur, Lucknow, Coimbatore, and Indore—record faster parcel-volume upticks than metros, supported by rising disposable incomes, broadband penetration, and local startup ecosystems. Ecom Express now serves 27,000 PIN codes covering 97% of India’s population, signaling that near-comprehensive coverage is no longer the preserve of India Post alone. Manufacturing corridors in Gujarat, Tamil Nadu, and Maharashtra remain B2B strongholds, while tech centers in Karnataka and Telangana tilt toward B2C volumes.
The Northeast, though infrastructure-challenged, gains visibility as new road projects and the Act East Policy deepen trade links with Southeast Asia. Rural markets in Uttar Pradesh, Bihar, and West Bengal carry vast untapped potential but demand tailored logistics strategies—smaller drop-sizes, cash-on-delivery reliability, and localized customer support—to overcome lower average order values and patchy road quality. Partnership models that piggyback on India Post’s rural depot network present a scalable route to penetrate villages without inflating fixed-cost bases across the India domestic courier market.
Regulatory Landscape
India's domestic CEP operations sit within a multi-agency framework: the Department of Posts governs India Post under the Post Office Act, 2023 and associated Post Office Regulations, while private courier companies primarily operate under general commercial, consumer, and tax laws rather than the postal statute. Digitization and standardization initiatives under the National Logistics Policy (2022) and its Unified Logistics Interface Platform (ULIP) provide a policy anchor for interoperable data exchange across logistics actors and government systems.
For shipments involving international courier terminals, compliance is anchored in the CBIC regime for couriers. This includes the Courier Imports and Exports (Electronic Declaration and Processing) Regulations, 2010, which require electronic processing and authorized-courier registration with Customs. In 2025, maritime liability and coastal trade frameworks were refreshed through enactments such as the Carriage of Goods by Sea Act, 2025 and the Coastal Shipping Act, 2025, supporting the broader multimodal context used by parcel networks that blend road, air, and coastal legs for time-definite distribution.
Value Chain Analysis
The domestic CEP value chain spans contract acquisition and pricing (enterprise SLAs and marketplace/D2C allocations), first-mile pick-up and acceptance (including packaging and address/label standardization), mid-mile linehaul and cross-docking, automated sorting at hubs, and last-mile delivery (often via partner fleets and gig riders), followed by reverse logistics for returns. Road remains the backbone for domestic trunking and last-mile coverage, while air networks support time-definite flows. Coverage expansion into tier-II and tier-III cities depends on spoke facilities, dark-store compatible pick-up/drop density, and PIN-code level serviceability comparable to the nationwide reach shown by large operators.
Enablers increasingly sit upstream of physical movement. Digital integration via ULIP (integrating data from 30+ systems and recording over 160 crore transactions as of Aug 2025) pushes interoperability in tracking, documentation, and compliance workflows. Government programs such as PM Gati Shakti and planned logistics parks shape node locations and corridor economics. On the supply side, automated sorters, scanning hardware, WMS/TMS stacks, and EV two/three-wheelers are becoming core inputs for service quality and unit-cost control, with large players funding capex-heavy hubs and smaller couriers relying on franchisees and third-party transporters to extend reach.
Competitive Landscape
The India domestic courier market sits at a moderate concentration level, where unicorn-backed operators such as Delhivery, Shadowfax, and XpressBees leverage venture capital to scale nationwide automation footprints, while legacy brands—India Post, Blue Dart, DTDC—capitalize on entrenched infrastructure. Competitive energy revolves around last-mile efficiency; route-optimization algorithms, AI-driven demand forecasting, and parcel locker rollouts determine service reliability and cost leadership.
Strategic differentiation increasingly narrows to vertical specialties. Shadowfax focuses on quick-commerce and hyperlocal payloads; Allcargo Gati designs solutions for MSME clusters; Safexpress positions around temperature-controlled consignments. High capex requirements for automated hubs spur consolidation as smaller courier firms cede share or pivot to niche services rather than chase volume leadership in the India domestic courier market.
Regulatory clarity under GST incentivizes formalization, pushing unorganized players either to adopt digital compliance tools or exit. Allcargo’s cloud-first blueprint—targeting 80% workload migration—demonstrates how technology amortization across multiple businesses can unlock data synergies, faster reconciliation, and sharper dynamic pricing. Market entrants now require both capital depth and differentiated software stacks to win contracts with large e-commerce marketplaces that increasingly favor SLA-driven scorecards.
India Domestic Courier, Express, and Parcel (CEP) Industry Leaders
-
India Post
-
Blue Dart Express Ltd
-
Delhivery Ltd
-
DHL Express (India) Pvt Ltd
-
FedEx Express
- *Disclaimer: Major Players sorted in no particular order
Market Opportunities and Future Outlook
Digitized compliance and data interoperability are creating whitespace for CEP operators that can connect operational systems to government rails and improve scan-to-visibility performance. In June 2026, CBIC operationalised Union Budget 2026-27 reforms for the express sector around deeper digitisation and quicker clearances via the Express Cargo Clearance System (ECCS), including Electronic Cash Ledger as the default duty-payment mode for courier imports. This reinforces the need for integrated IT, e-POD discipline, and exception management at nodes that interface with regulated terminals.
Network automation and tier-II industrial decentralization are also becoming visible investment pathways, supported by both corporate capex and public programs. Shadowfax disclosed its OneNCR automated sortation mega-hub becoming fully operational (Feb 2026), with high-throughput automation aimed at same-day and next-day flows, while Delhivery (May 2026 shareholder communication) highlighted an AI-led capacity framework and a long-term capability pipeline around its express parcel and transport network. On the infrastructure side, DPIIT issued operational guidelines for the BHAVYA scheme (May 2026) targeting 100 plug-and-play industrial parks. Separately, the Government of India and ADB signed a USD 350 million SMILE policy-based loan (Dec 2024) to support multimodal and integrated logistics ecosystem reforms, improving the business case for CEP players to add standardized warehousing, consolidation hubs, and time-definite distribution services along emerging industrial and consumption corridors.
Recent Industry Developments
- June 2026: Delhivery partnered with Bajaj Auto to deploy 1,500 electric three-wheelers (Bajaj RIKI eCarts) across its last-mile network over two years, with an initial batch inducted in June 2026. The move expands EV-based capacity for dense urban routes and supports cost and emissions optimization in B2C-heavy delivery lanes.
- June 2025: Shadowfax filed for an IPO in the INR 2,000-2,500 million range to finance expansion in quick-commerce while emphasizing profitability. The filing spotlighted capital needs for scaling hyperlocal and time-definite capabilities, including automation and network densification.
- January 2024: India Post advanced delivery-network specialization through its Independent Delivery Centre program, targeting 1,850 dedicated facilities to extend operating hours and enable services such as Sunday delivery. This increases competitive pressure on private couriers in residential B2C lanes where service reliability and delivery windows are key differentiators.
Research Methodology Framework and Report Scope
Market Definition and Coverage
For this report, the market covers revenue earned from domestic courier, express, and parcel deliveries within India, across documents and non-palletized shipments moving between senders and receivers using organized networks.
Scope exclusions: International express and cross-border forwarding revenue are excluded, and only movements completed within India are counted.
Segmentation Overview
- By Speed of Delivery
- Express
- Non-Express
- By Shipment Weight
- Heavy Weight Shipments
- Light Weight Shipments
- Medium Weight Shipments
- By End User Industry
- E-Commerce
- Financial Services (BFSI)
- Healthcare
- Manufacturing
- Primary Industry
- Wholesale and Retail Trade (Offline)
- Others
- By Model
- Business-to-Business (B2B)
- Business-to-Customer (B2C)
- Customer-to-Customer (C2C)
- By Mode of Transport
- Road
- Air
- Others
Data Sources, Market Sizing, and Validation
Desk Research
Desk work starts with building the operating map of India CEP demand and supply, and then aligning it with what can be verified in public data. We refer to sources such as India Post updates and annual reports, Ministry of Road Transport and Highways statistics, Ministry of Commerce and Industry releases for trade context, and Reserve Bank of India macro series that help normalize inflation and spending cycles.
To keep assumptions grounded, we also review policy and ecosystem updates from DPIIT and MeitY, along with publications from logistics and retail trade bodies when they are accessible without paywalls. Company annual reports, investor presentations, and reputable press interviews help us spot network expansion, mix shifts between express and deferred services, and yield direction. In addition, we use a paid subscription for company financials and intelligence to standardize revenue baselines and cross-check service line splits across years. The desk sources named above are illustrative rather than exhaustive, and many other public documents and datasets were also used to collect data, validate it, and clarify definitions.
Primary Interviews and Surveys
Primary work is used to confirm how domestic shipments are counted, priced, and routed, especially across B2B, B2C, and C2C flows that can behave very differently. We spoke with a mix of operators, channel partners, large shippers, and logistics managers across key consumption and transit regions so assumptions on volumes, service levels, and yield ladders could be corrected before totals were finalized.
Distribution of primary research fieldwork respondents
| Company type | Respondent position |
|---|---|
| Top tier: 36% | CXOs: 15% |
| Mid tier: 47% | Functional/Unit leaders: 34% |
| Smaller Players: 17% | Managers: 51% |
Market-Sizing & Forecasting
The sizing model is built using top-down and bottom-up logic, starting from a top-down build where domestic shipment demand is reconstructed from India's parcel and express activity indicators and then converted into value using service-level pricing logic. Inputs that shape the demand pool include e-commerce order intensity by category, intercity lane mix, average chargeable weight patterns (documents versus parcels), express versus deferred share, and fuel and line-haul cost pass-through that impacts realized yields.
Those outputs are then checked with selective bottom-up approximations, such as a roll-up of sampled operator revenues by service type, lane-based price checks from shippers, and network expansion signals discussed in filings and interviews. When a bottom-up view has gaps, we scale using coverage factors tied to the share of organized networks and the split between e-commerce and non-e-commerce movements, and then we re-test the totals through follow-up expert inputs.
For forecasting, we rely on scenario analysis supported by simple multivariate relationships, where parcel demand and pricing are stress-tested against variables like GDP and consumption, e-commerce penetration, delivery time expectations, automation adoption, and policy-led logistics improvements. Assumptions are kept explicit so a reader can track how volume growth and yield change combine to create the final forecast curve.
Data Validation & Update Cycle
Before sign-off, the model is triangulated through multiple checks, including consistency across demand indicators, revenue direction shared by market participants, and year-on-year price movement implied by costs and service mix. Outliers are reviewed at the lane or customer type level, and if the variance cannot be explained, we re-contact sources to clarify definitions, for example whether returns and reverse movements are netted or counted in gross flows.
A second analyst review is completed to confirm arithmetic, assumptions, and scope alignment, followed by a freshness check close to delivery so the narrative and numbers stay current. Reports are refreshed annually, and interim updates are triggered when material events occur, such as major policy changes, large network expansions, or sharp cost shocks that can change realized pricing.
Mordor Intelligence's India Domestic Courier Express and Parcel Market Size Compared Against Other Published Estimates
Published market values for India's domestic CEP space can vary widely, even when the topic looks similar on the surface. The spread usually comes from how each publisher defines included services, whether the year is reported as FY or calendar year, and how pricing is translated into USD.
Some public articles discuss a wider express logistics and courier sector, and the figures may be shared as a range for FY periods with limited detail on what is counted. For Mordor Intelligence, only domestic courier, express, and parcel revenue completed within India is counted, and international express and cross-border forwarding revenue are excluded, so the number stays tied to a clear domestic shipment pool.
Benchmark comparison
| Source | Market Size | Gaps in Research Methodology |
|---|---|---|
| Mordor Intelligence | USD 5.68 B (2025) | |
| Trade Journal A | USD 6.40 B (2025) | Presented as a domestic express range for FY2024-25, and the service definition is not always explicit about inclusion of deferred parcel movements and document-heavy flows alongside express parcels. |
| Industry News Desk B | USD 9.00 B (2025) | Shared as a broader express logistics and courier sector figure for FY2024-25, which can bundle adjacent logistics activities and may not separate domestic-only delivery revenue from other express-related services. |
Overall, the table suggests the main gaps come from service perimeter choices and the use of FY-based ranges, followed by differences in how yield and mix are treated. By keeping inclusions tied to domestic delivery revenue and cross-checking volume and yield assumptions with shippers and operators, the final number stays easier to replicate and compare across years.
Key Questions Answered in the Report
How large is the India domestic courier market in 2026?
The India domestic courier market size is USD 6.27 billion in 2026, and it is projected to reach USD 10.25 billion by 2031.
What is the forecast CAGR for India’s courier sector?
The market is expected to grow at a 10.34% CAGR between 2026 and 2031.
Which segment holds the largest share by shipment weight?
Light-weight parcels dominate with 71.91% share, reflecting the surge in e-commerce orders.
Why are express services growing faster than non-express?
Same-day and next-day delivery expectations, quick-commerce expansion, and air-cargo network upgrades boost express-service demand at an 11.07% CAGR.
How is government policy influencing the sector?
The National Logistics Policy and PM Gati Shakti program aim to trim logistics costs, build multimodal corridors, and digitize documentation, thereby unlocking efficiency across parcel networks.
Which business model is expanding the quickest?
B2C deliveries grow fastest at a 12.33% CAGR, driven by D2C brands and social-commerce adoption that deepen residential parcel density.