
India Direct-to-Consumer Logistics Market Size and Share
Market Overview
| Study Period | 2020 - 2031 |
|---|---|
| Forecast Data Period | 2026 - 2031 |
| Base Year Market Size (2025) | USD 7.55 Billion |
| Market Size (2026) | USD 8.03 Billion |
| Market Size (2031) | USD 10.9 Billion |
| Growth Rate (2026 - 2031) | 6.31 % |
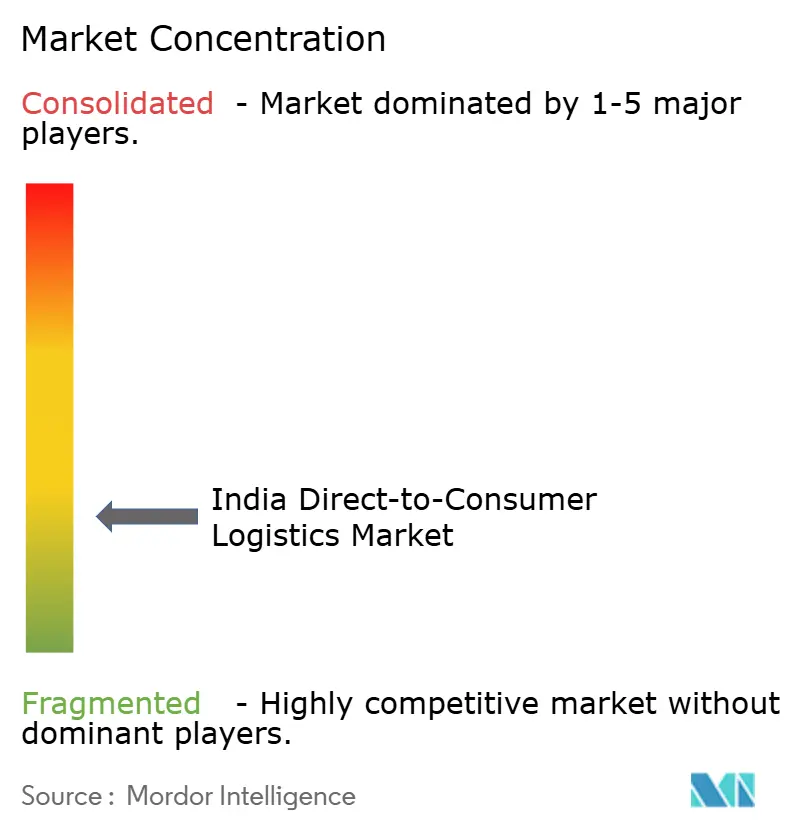
| Market Concentration | Low |
Major Players *Disclaimer: Major Players sorted in no particular order Image © Mordor Intelligence. Reuse requires attribution under CC BY 4.0. | |
India Direct-to-Consumer Logistics Market Analysis by Mordor Intelligence
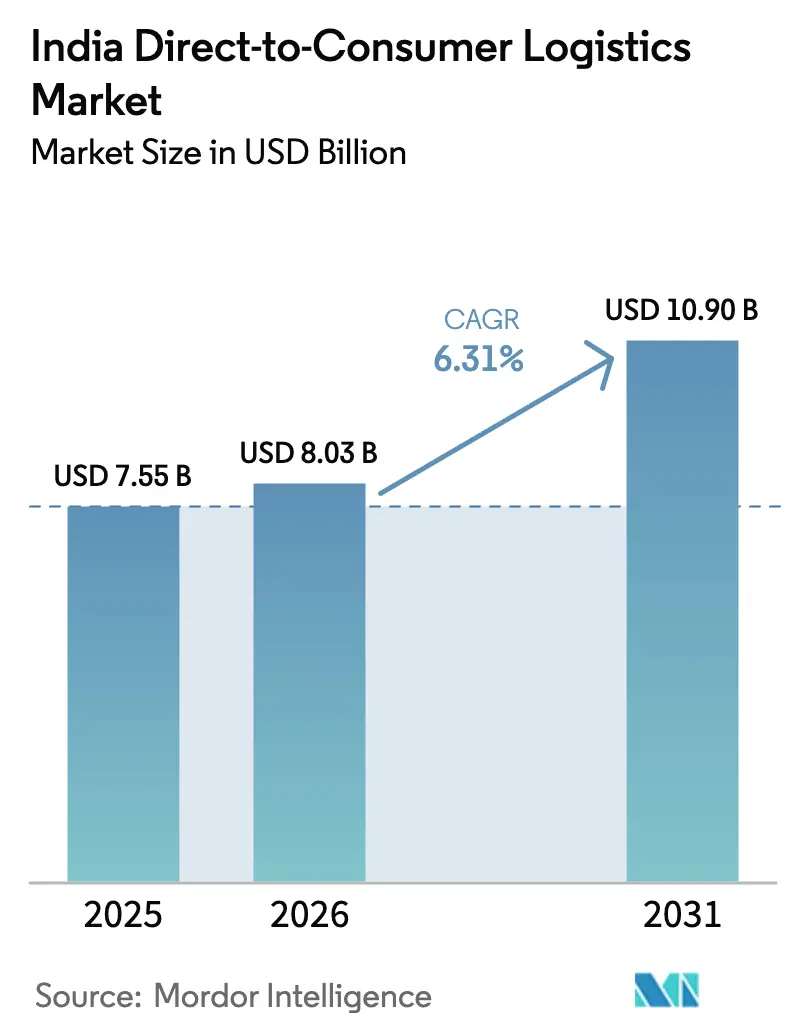
The India Direct-to-Consumer Logistics Market size was valued at USD 7.55 billion in 2025 and estimated to grow from USD 8.03 billion in 2026 to reach USD 10.9 billion by 2031, at a CAGR of 6.31% during the forecast period (2026-2031).
Solid growth rests on three pillars: the e-commerce boom, rising demand for ultra-fast fulfillment, and policy-driven cost rationalization. Transportation services remain the revenue anchor, but value-added and technology-enabled offerings record the fastest gains as shippers seek visibility, reverse-logistics support, and data-driven route planning. Quick-commerce models, though still metro-centric, create strong pull-through for dark stores, EV-based last-mile fleets, and automated sortation. Simultaneously, government programs such as the National Logistics Policy (NLP) and Unified Logistics Interface Platform (ULIP) encourage digital integration and capital spending, while the Vande Bharat parcel initiative opens express rail corridors.
Key Report Takeaways
- By service type, transportation captured 47.35% of the India direct-to-consumer logistics market share in 2025, whereas value-added services are expected to post the highest projected 4.82% CAGR through 2031.
- By end user, fashion & lifestyle accounted for 31.45% of the India direct-to-consumer logistics market size in 2025 and is projected to advance at a 4.55% CAGR to 2031.
- By delivery speed, standard delivery held 52.35% of the India direct-to-consumer logistics market share in 2025, while it also leads growth at a 4.95% CAGR through 2031.
- By distribution channel, online routes generated 76.35% of the India direct-to-consumer logistics market size in 2025 and are projected to outpace overall sector growth with a 4.12% CAGR over the forecast horizon.
Note: Market size and forecast figures in this report are generated using Mordor Intelligence’s proprietary estimation framework, updated with the latest available data and insights as of 2026.
India Direct-to-Consumer Logistics Market Trends and Insights
Drivers Impact Analysis*
| Driver | (~) % Impact on CAGR Forecast | Geographic Relevance | Impact Timeline |
|---|---|---|---|
| Surge in e-commerce & digital infrastructure boom | +2.1% | National; spillover into Tier-2/3 cities | Medium term (2-4 years) |
| Rise of 10-minute quick-commerce fulfillment | +1.8% | Metros expanding toward Tier-II centers | Short term (≤ 2 years) |
| Expansion into Tier-2/3 cities via omni-channel models | +1.4% | Karnataka, Tamil Nadu, Gujarat early adopters | Long term (≥ 4 years) |
| National Logistics Policy & ONDC enablement | +0.9% | Nationwide roll-out with pilot programs | Medium term (2-4 years) |
| Vande Bharat parcel trains | +0.6% | Delhi–Mumbai and Delhi–Chennai corridors | Long term (≥ 4 years) |
| EV/bike-taxi adoption for last mile | +0.5% | Delhi-NCR leading uptake | Medium term (2-4 years) |
| Source: Mordor Intelligence | |||
Surge in E-Commerce & Digital Infrastructure Boom
E-commerce payments grew 23.8% in 2024, accelerating volume inflows into parcel networks. Logistics operators responded by automating sortation; a major integrator now runs 20 such centers and handles 1.5 million parcels daily. Government-backed ULIP knits customs, port, and road databases into a single interface, trimming paperwork and enabling real-time track-and-trace. AI adoption spreads quickly: one FMCG shipper cut manual interventions by 80% after deploying predictive routing tools. Collectively, these advances lower error rates, shorten transit windows, and raise customer service benchmarks across the India direct-to-consumer logistics market.
Rise of 10-Minute Quick-Commerce Fulfillment
Quick-commerce platforms scaled annualized sales to USD 1.2 billion within 29 months, validating consumer appetite for impulse delivery. Operators expanded dark-store footprints but face mounting cash burn; a leading player spent INR 5,747 crore (USD 672 million) to earn INR 4,454 crore (USD 520 million) in FY 24, underscoring thin margins. Dense metro clusters deliver up to 85% of orders, whereas smaller cities add only 15-17% yet incur a higher cost per drop. Municipal zoning curbs dark-store density, prompting firms to refine merchandise assortments and leverage AI for sub-15-minute picking routines. Despite hurdles, investor confidence stays firm as valuations factor in eventual scale economies.
Expansion into Tier-2/3 Cities via Omni-Channel Models
More than half of one leading marketplace’s users now hail from Tier-4 towns, confirming latent demand beyond metros. Logistics providers adopt hub-and-spoke designs centered on regional fulfillment hubs, with breakeven points dropping to 800 orders per dark store in Tier-II cities versus 1,300 in Tier-I. ONDC pilots allow neighborhood kirana outlets to double as micro-fulfillment points, improving service radius while adding income streams. Government highway builds under Bharatmala enhance trunk connectivity, yet last-mile gaps linger due to limited warehousing stock and digital-payment penetration.. Customized compliance playbooks remain critical as local licensing, labor norms, and tax structures vary by state.
National Logistics Policy & ONDC Enablement
The National Logistics Policy targets halving logistics costs to 8% of GDP by 2030 through multimodal corridors, unified digitization, and skill programs. ONDC, backed by the Department for Promotion of Industry and Internal Trade, has onboarded thousands of sellers but still refines discovery algorithms after retail orders slipped during beta phases. Some ride-hailing offshoots illustrate ONDC’s potential; a Bengaluru platform captured a 25% share in its first year by crowd-sourcing drivers and bypassing aggregator mark-ups. Large 3PLs integrate ONDC APIs to access MSME traffic, with one major operator building five logistics parks aligned to the PM Gati Shakti masterplan. Standardized data formats and grievance-redressal rules under ONDC foster interoperability, although cybersecurity audits remain a work in progress.
Restraints Impact Analysis*
| Restraint | (~) % Impact on CAGR Forecast | Geographic Relevance | Impact Timeline |
|---|---|---|---|
| Hyper-competitive pricing from e-tail majors & 3PLs | -1.2% | Metro clusters | Short term (≤ 2 years) |
| Infrastructure bottlenecks & supply-chain disruption | -0.8% | National; acute in Tier-2/3 | Medium term (2-4 years) |
| Quick-commerce unit-economics pressure/dark-store risk | -0.7% | High-rent urban pockets | Short term (≤ 2 years) |
| Regulatory uncertainty over gig-economy workforce | -0.4% | Karnataka spearheading | Medium term (2-4 years) |
| Source: Mordor Intelligence | |||
Hyper-Competitive Pricing from E-Tail Majors & 3PLs
Aggressive discounting compresses margins across fulfilment lanes as leading marketplaces leverage scale to negotiate sub-INR 10 per-parcel rates (USD 0.11 per parcel). Consolidation, highlighted by an INR 1,407 crore (USD 164.5 million) acquisition filing, signals the hunt for density-driven cost dilution[1]Fashion Brand Press Release, “Tier-II Expansion Milestone,” indianretailer.com. Quick-commerce apps post quarterly EBITDA losses exceeding INR 100 crore (USD 11.7 million) even after fee hikes, underscoring razor-thin unit economics. Smaller couriers, therefore, pivot toward niche verticals such as high-value electronics and healthcare to defend yields. The Competition Commission monitors tie-ups to avert monopolistic routing, yet near-term oversupply keeps spot rates volatile.
Quick-Commerce Unit-Economics Pressure/Dark-Store Risk
Dark-store growth cooled markedly after metro saturation; planned outlets for FY 26 hover at 5,000–5,500 versus earlier projections of 8,000. High real-estate rentals lift fixed costs, while sub-300 INR (USD 3.5) basket values cap contribution margins. Operators fight shrinkage by deploying real-time demand forecasts and 15-second pick protocols, but wage disputes with gig riders add complexity. Despite structural challenges, investor valuations remain robust—one brokerage pegs a top brand at USD 18.1 billion, equal to 56% of its parent’s target value—anticipating later-stage profitability pivots.
*Our forecasts treat driver/restraint impacts as directional, not additive. The impact forecasts reflect baseline growth, mix effects, and variable interactions.
Segment Analysis
By Service Type: Transportation Dominance Drives Express Delivery Innovation
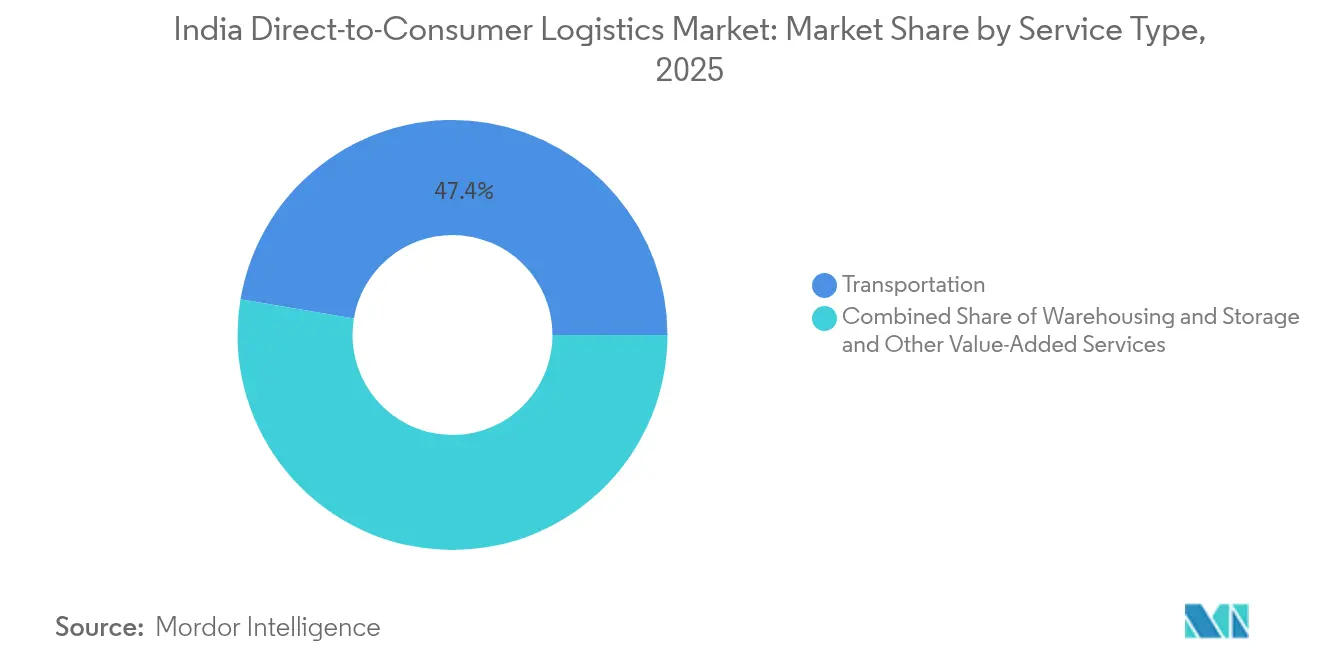
Transportation services controlled 47.35% of the India direct-to-consumer logistics market share in 2025. Express parcel trains, EV fleets, and automated sorters combine to slash lead times, anchoring shipper loyalty. The India direct-to-consumer logistics market size for transportation stood at USD 3.58 billion in 2025 and is forecast to post steady gains through modular fleet expansion and dynamic routing. In parallel, value-added services, though smaller, are expected to post a 4.82% CAGR (2026-2031) on the back of high-touch needs such as reverse logistics, installation, and real-time visibility dashboards.
Warehouse and storage activities evolve toward micro-hubs near consumption centers. Dark-store nodes, many under 3,000 sq ft, facilitate 10-minute fulfilment, while AI-powered inventory systems reduce stock-outs. Regulatory compliance around food safety, temperature control, and data privacy drives investment in certified facilities. Integrated service bundles now blend intercity line-haul, intra-city distribution, and freight-forwarding, further blurring traditional silos in the India direct-to-consumer logistics market.


By End User: Fashion & Lifestyle Leads Omnichannel Transformation
Fashion & lifestyle generated 31.45% of the India direct-to-consumer logistics market size in 2025, rising at a 4.55% CAGR (2026-2031) as omnichannel launches multiply seasonal drops. Quick-commerce platforms pilot premium apparel delivery within two hours, catering to impulse purchases. Brands broaden reach: one lingerie specialist derived 28% of 2024 sales from Tier-II/III towns via franchise roll-outs and D2C portals. Demand for returns management and size-exchange cycles reinforces value-added service uptake.
Consumer electronics remain sizeable due to high-value ticket sizes that justify insured, tamper-proof packaging. FMCG categories show triple-digit growth on quick-commerce rails, pushing for chilled chain nodes and continuous replenishment algorithms. Home & décor items leverage durable packaging innovations and room-of-choice delivery set-ups. Category compliance continues to diversify, with Bureau of Indian Standards codes, battery recycling mandates, and food safety rules shaping operating playbooks.
By Delivery Speed: Standard Delivery Maintains Leadership Despite Quick-Commerce Push
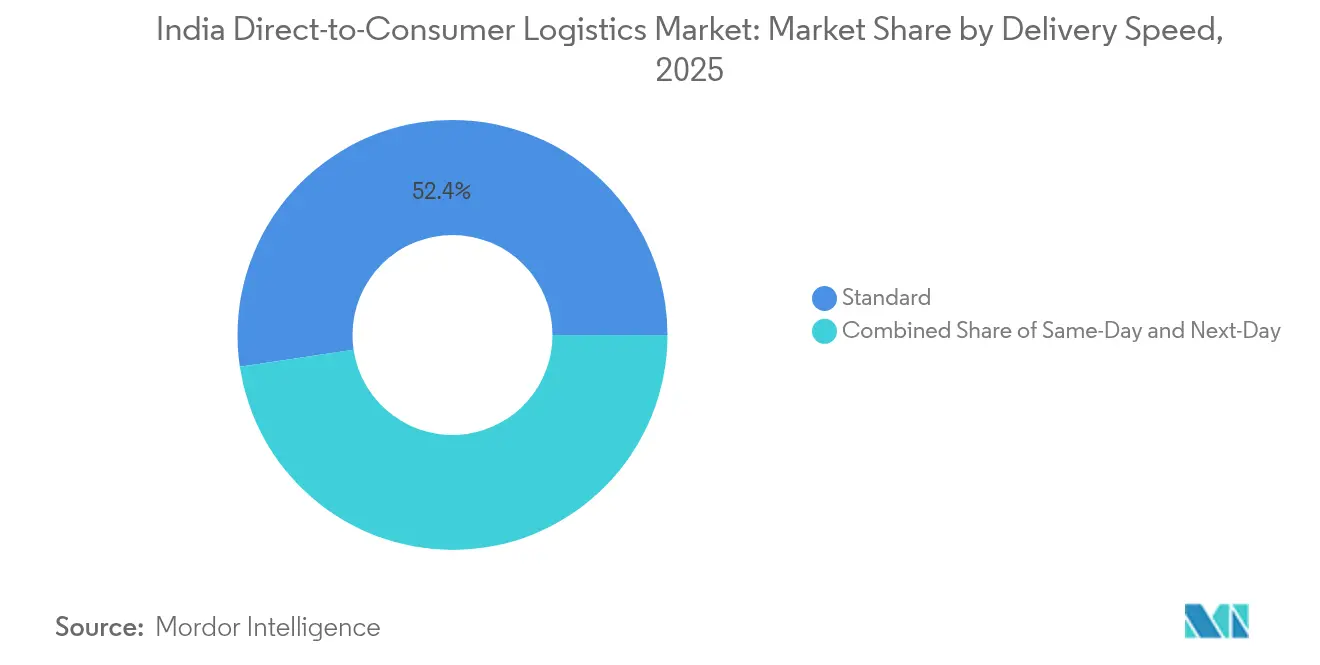
Standard services held 52.35% of the India direct-to-consumer logistics market share in 2025, yet are also expected to deliver the fastest 4.95% CAGR through 2031. Economies of scale in intercity trucking, plus highway projects under the National Infrastructure Pipeline, keep cost-per-parcel competitive. Predictive fleet dispatch, automated toll reconciliation, and consolidated returns allow operators to widen margins even at lower tariffs.
Same-day and next-day tiers capture metros and state capitals. About 31% of urban households now rely on same-day fulfillment for primary grocery baskets. In lower-density districts, next-day remains preferred, balancing cost and speed. Ultra-fast 10-minute sub-category deliveries continue as brand-building levers rather than profit centers, but data pooling across micro-warehouses is expected to cut last-mile kilometers over time.
By Distribution Channel: Online Dominance Accelerates Digital Transformation
Online channels delivered 76.35% of 2025 revenue and are expected to sustain a 4.12% CAGR (2026-2031) as more MSMEs migrate to marketplaces and ONDC storefronts. The India direct-to-consumer logistics market size tied to online fulfillment rose to USD 5.77 billion in 2025. Algorithmic demand shaping, dynamic pricing, and subscription-based free shipping programs deepen digital dependency. EV-based delivery pledges by large e-tailers reinforce sustainability narratives and attract conscious shoppers.
Offline players embrace click-and-collect, ship-from-store, and endless-aisle kiosks to stay relevant. Kirana partnerships unlock hyperlocal coverage, with neighborhood stores doubling as drop points. Third-party logistics firms bridge physical-digital workflows by offering SaaS control towers, API-linked returns modules, and AR-guided warehouse picking. Compliance spheres encompass GST e-invoicing, data-sharing clauses under the Digital Personal Data Protection Act 2023, and disclosure norms for delivery-time promises.
Geography Analysis
Metro corridors—Delhi-NCR, Mumbai, Bengaluru, Hyderabad, and Chennai—command 83-85% of quick-commerce gross merchandise value, reflecting dense demand clusters. Yet Tier-2/3 cities, now contributing 15-17%, grow faster owing to smartphone penetration and improving road networks. Blinkit’s footprint in 44 Tier-II cities illustrates the shift, even as lower-order density challenges cost curves.
Southern and western states emerge as logistics hot-spots. Karnataka pioneers gig-worker welfare legislation, setting precedents that could ripple nationwide. Tamil Nadu incentivizes EV adoption through reduced road tax, fostering greener fleets. Gujarat’s strategic location, coupled with port connectivity, positions it as a freight consolidation hub. Freight-only dedicated corridors boost Delhi–Mumbai speed, while eastern hinterlands benefit from multimodal terminals under Sagarmala.
Regulatory Landscape
The regulatory environment for India direct-to-consumer logistics is increasingly shaped by customs facilitation for e-commerce exports and digital compliance. Effective April 1, 2026, the Central Board of Indirect Taxes and Customs (CBIC) removed the INR 10 lakh value cap for courier exports via Circular 17/2026-Customs and implemented a risk-based digital return system for e-commerce courier exports. This reduces reliance on manual verification and improves throughput for MSME and D2C export shipments.
Beyond border processes, the Department for Promotion of Industry and Internal Trade (DPIIT) frames modernization through the National Logistics Policy and its digital enablers, including the Unified Logistics Interface Platform (ULIP) and ONDC-related data and grievance frameworks referenced in the market context. Tax interpretation changes also affect operating models, including the 2026 reporting on GST liability for intermediary services shifting to the recipient from the supplier, which influences contracting and invoicing structures for platform-linked logistics and cross-border service arrangements.
Value Chain Analysis
The India D2C logistics value chain runs from seller onboarding (brand webstores, marketplaces, and ONDC) through order orchestration (OMS and label generation), first-mile pickup, hub sorting, and line-haul (road and emerging express rail corridors). It also covers mid-mile transshipment, last-mile delivery including hyperlocal and quick-commerce, and post-purchase services such as reverse logistics, COD reconciliation, and customer-experience support. Digital interoperability is rising as shippers and 3PLs connect to ULIP and ONDC APIs to streamline documentation, tracking, and exception handling, while compliance overlays (GST documentation and data protection obligations) shift more workflows into auditable digital processes.
Differentiation is increasingly visible in the middle of the chain, with automated sortation hubs, micro-fulfillment or dark-store nodes, and software layers (TMS and WMS, route optimization, and seller-facing shipping platforms) shaping service levels and cost-to-serve. E-commerce players keep combining in-house networks with outsourcing to integrators and last-mile specialists for express parcel spikes and multi-city reach, while capacity investments move toward automation, EV-enabled last mile, and platform-led onboarding that reduces friction for SMEs and D2C brands.
Competitive Landscape
The India direct-to-consumer logistics industry features moderate fragmentation. A leading integrator covers 18,700 pin codes with automated hubs and has moved to acquire a rival for INR 1,407 crore (USD 164.5 million) to deepen density. Quick-commerce specialists focus on dark-store density; one brand boasts under-10-minute promises across 200+ micro-hubs. SaaS-native platforms such as FarEye log INR 180 crore (USD 21 million) revenue by licensing route-optimization engines to retailers and couriers.
White-space opportunities lie in intra-city B2B haulage and rural distribution. Porter’s asset-light truck-hailing app reached unicorn status while servicing SME freight tasks[3]Porter Corporate Blog, “Series E Funding Announcement,” logisticsinsider.in. ElasticRun addresses rural-kirana restocking through a hub-and-spoke aggregation model backed by USD 462 million funding. Hardware innovators like EVage develop electric trucks with 98.5% motor efficiency, aligning with fleet decarbonization mandates.
Mergers continue: CEVA bought 96% of Stellar Value Chain Solutions to secure temperature-controlled capacity. LEAP India acquired pooling firm CIPL to widen pallet rental services. The Competition Commission scrutinizes large deals to prevent monopolistic pricing, but scale synergies remain attractive as operators chase cost-to-serve reductions through automation, network overlap removal, and end-to-end offerings.
India Direct-to-Consumer Logistics Industry Leaders
Delhivery
DHL
XpressBees
Shadowfax
Mahindra Logistics Ltd.
- *Disclaimer: Major Players sorted in no particular order

Market Opportunities and Future Outlook
Cross-border D2C shipping for MSMEs is gaining traction as trade and customs processes digitize and ease constraints. CBICs April 1, 2026 removal of the INR 10 lakh courier-export cap and the adoption of a risk-based digital return system reduce friction for higher-value parcels and repeat export flows. This creates room for D2C-focused export solutions, such as pickup-to-courier export clearance, returns-to-origin handling, and duty and tax advisory layers, bundled by integrators and tech platforms.
For domestic distribution, two investable whitespace areas stand out through company actions. Delhiverys disclosed plans for new initiatives such as Delhivery Local (intra-city) and Delhivery International (air parcel service to the US, UK, Canada, and Australia) point to active lane expansion and service bundling. On fleet transition, Delhiverys deployment of Bajaj RIKI eCarts (200 inducted in the initial phase, with a larger rollout announced) and Shadowfaxs emphasis on express parcel growth highlight opportunities for EV leasing, charging partnerships, and city-level micro-hub networks that can support same-day, next-day, and reverse logistics, particularly as Tier-2/3 coverage deepens through omnichannel and ONDC-linked seller traffic.
Recent Industry Developments
- June 2026: Delhivery and Bajaj Auto partner to deploy 1,500 electric cargo three-wheeler units across the last-mile network by 2027, with 200 units in the initial phase. The deal expands last-mile capacity through an electric fleet across key urban corridors. The move strengthens green logistics and could support feeder links to urban micro-hub networks.
- May 2026: Shadowfax plans to set up 100 dedicated dark stores for quick commerce operations in FY27. The expansion broadens metro scale and accelerates SLA adherence for rapid deliveries. This strengthens capacity for rapid delivery across metros and accelerates Q-commerce scale.
- April 2026: Shadowfax launches Shadowfax 360, a digital shipping platform for SMEs and D2C brands, with flat-rate billing and one-click Shopify/WooCommerce integration. The capability enables rapid scale by simplifying onboarding and cross-channel fulfillment. This reinforces platform driven growth through easier SME integration.


Research Methodology Framework and Report Scope
Market Definition and Coverage
This market covers the value of logistics services used by direct-to-consumer brands in India to move orders from inventory points to end customers. It includes line haul, last mile, and supporting handling services across common delivery speeds and channels.
Scope exclusions: We exclude pure brand or marketplace revenues, and we also exclude non-logistics items such as payment processing, advertising, and customer support costs.
Segmentation Overview
- By Service Type
- Transportation
- Warehousing and Storage
- Value-added Services
- By End User
- Fashion & Lifestyle
- Consumer Electronics
- FMCG
- Home & Decor
- Others
- By Delivery Speed
- Same-Day (Within 24 h)
- Next-Day
- Standard
- By Distribution Channel
- Online
- Offline
Data Sources, Market Sizing, and Validation
Desk Research
Desk research starts by mapping what creates D2C logistics spend in India, and then aligning it to measurable signals. We used public data and indicators such as Department for Promotion of Industry and Internal Trade releases, Ministry of Commerce and Industry trade statistics, Ministry of Road Transport and Highways transport indicators, India Post and other postal statistics, and Reserve Bank of India macro series to build context for demand, lanes, and cost behavior.
We also reviewed annual reports, investor presentations, and credit rating notes for logistics service providers and relevant intermediaries. Reputed press coverage and association commentary were used to understand pricing changes, returns intensity, and service mix. Patent databases were referenced selectively to track automation and routing related filings that may shift cost-to-serve over time. A paid subscription for company financials and news was used to cross-check reported revenue exposure and corporate actions. The sources cited here are illustrative, and we also checked other public documents for data collection, validation, and clarification.
Primary Interviews and Surveys
Primary work focused on verifying what portion of D2C order flow is handled through outsourced logistics, and how service choices translate into revenue. We spoke with a mix of logistics operators, D2C brand supply chain teams, and packaging or fulfillment partners to confirm typical delivery speed splits, returns patterns, and the pricing logic used for metro and non-metro lanes.
Because this is an India-only market, the respondent plan emphasized major consumption clusters and fast-growing tier 2 corridors so the assumptions were not based only on the largest cities.
Distribution of primary research fieldwork respondents
| Company type | Respondent position |
|---|---|
| Top tier: 26% | CXOs: 13% |
| Mid tier: 60% | Functional/Unit leaders: 43% |
| Smaller Players: 14% | Managers: 44% |
Market-Sizing & Forecasting
We sized the market using a top-down demand pool build where D2C order volumes and logistics service take rates are reconstructed into spend, and then we checked the result against selective bottom-up approximations. In practice, the model starts from the implied shipped order base for D2C brands, applies delivery speed and channel splits, and then converts those flows into transportation, warehousing and storage, and value-added service revenues using reasonable price-per-parcel and price-per-unit handling assumptions.
A few inputs that materially affect the totals were treated carefully, and each was validated with interviews before being locked. These include average parcel weight and volumetric behavior by category, share of orders shipped to non-metro pincodes, return-to-origin rates for high return categories, the mix of same-day versus next-day versus standard delivery, and the degree of warehousing and packaging services that are bundled into logistics contracts. Where a bottom-up view was needed, we used sampled operator revenue exposure to D2C, lane-level price checks, and sanity checks on parcels-per-day capacity at sorting and fulfillment nodes to adjust the top line when gaps appeared.
For forecasting, we used scenario analysis so growth could be expressed through a small set of drivers that primary respondents were comfortable validating. The main drivers were D2C shipment growth, shifts in delivery speed expectations, and expected price movement from fuel, labor, and automation. We then narrowed to a central case once outliers were explained.
Data Validation & Update Cycle
Outputs were validated through several passes that compare the model to independent signals, and then trace any large variances to a specific assumption. We check whether implied revenue per parcel, service mix, and category weights remain realistic versus what operators and brand teams describe, and whether the growth path matches observed changes in returns, delivery time promises, and network expansion.
Before sign-off, another analyst reviews the worksheets for logic breaks, unit errors, and unusual jumps across years, and questions are pushed back to the owner until the story and math align. Reports are refreshed annually, and interim updates are triggered when there are material events such as major policy changes, sharp fuel cost movements, or structural shifts in D2C shipping behavior. Right before delivery, we do a final sweep so the numbers reflect the latest available public signals and interview learnings.
Mordor Intelligence's India Direct to Consumer D2c Logistics Market Size Compared Against Other Published Estimates
Published numbers for India D2C logistics can look far apart because the underlying study units are not always the same. Some sources talk about shipment market value, while others size a broader logistics service basket, and they also select different years, currency timing, and pricing assumptions.
It also depends on whether the estimate includes only outsourced 3PL services, or it also counts in-house fleet and captive warehousing costs. Another boundary choice is how reverse logistics is treated, whether as a full revenue line or only a partial surcharge. When these boundary choices mix with aggressive or conservative growth cases, the outcome can change quickly even if the studies start from the same consumer trend.
Benchmark comparison
| Source | Market Size | Gaps in Research Methodology |
|---|---|---|
| Mordor Intelligence | USD 7.55 B (2025) | |
| Trade Journal A | USD 2.70 B (2028) | This figure is framed as a D2C shipments market outlook and is often presented closer to outsourced 3PL shipment value, which can exclude warehousing, storage, and some value-added handling that sits outside per-parcel pricing. |
| Industry Journal B | USD 2.20 B (2028) | The estimate appears to use a narrower service interpretation with a faster growth case, and it does not clearly document how returns, delivery speed premiums, or non-metro surcharge behavior are converted into revenue. |
The table shows a clear spread that mainly comes from what gets counted as logistics spend and how pricing is converted from shipments into revenue. In Mordor Intelligence's model, the total includes transportation plus warehousing and storage plus value-added services used by D2C brands in India, so it will not match shipment-only views. Once the scope is kept consistent, the remaining differences typically narrow to assumptions on return rates, speed mix, and how quickly per-parcel prices move over time, which can be rechecked and updated with fresh field inputs.


Key Questions Answered in the Report
How large is India’s direct-to-consumer logistics sector in 2026?
The India direct-to-consumer logistics market size is USD 8.03 billion in 2026, with a 6.31% CAGR outlook to 2031.
Which service segment generates the most revenue?
Transportation holds the lead at 47.35% share in 2025, driven by express parcel demand and network upgrades.
What end-user category grows fastest?
Fashion & lifestyle records a 4.55% CAGR through 2031, supported by omnichannel launches and impulse quick-commerce orders.
Are Tier-2 and Tier-3 cities significant for logistics growth?
Yes; they contribute 15-17% of quick-commerce GMV today and show faster growth due to improving digital infrastructure.
How are policy initiatives affecting the industry?
The National Logistics Policy, ULIP, and ONDC collectively target lower costs, digital transparency, and MSME access, reinforcing long-term efficiency gains.
Page last updated on:


 Your data is secure and never sold or shared.


