
Market Overview
| Study Period | 2020 - 2031 |
|---|---|
| Forecast Data Period | 2026 - 2031 |
| Base Year Market Size (2025) | USD 0.74 Billion |
| Market Size (2026) | USD 0.79 Billion |
| Market Size (2031) | USD 1.12 Billion |
| Growth Rate (2026 - 2031) | 7.12 % |
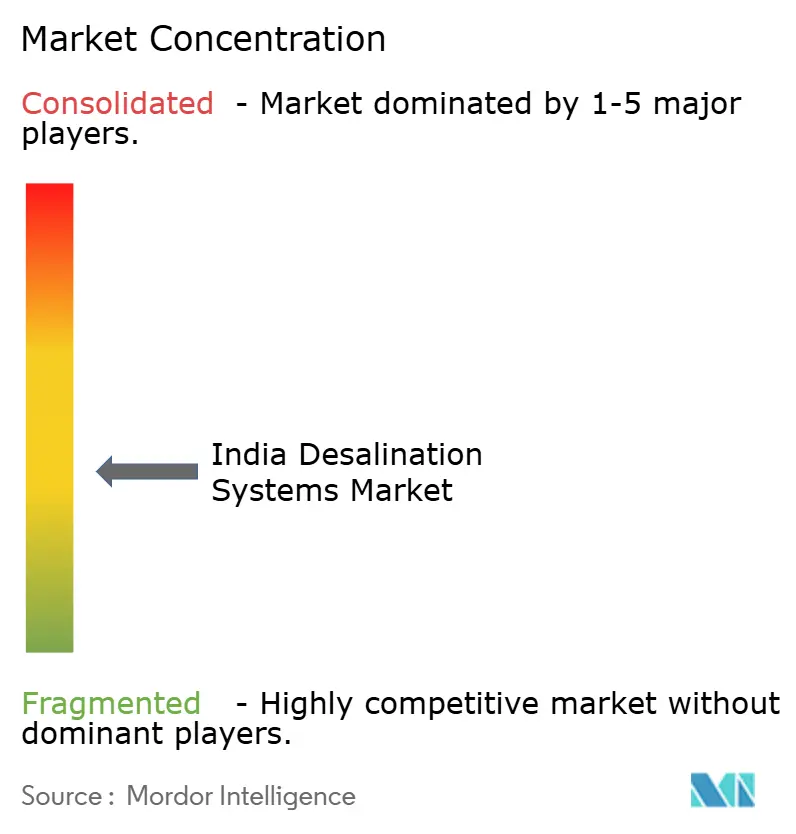
| Market Concentration | Medium |
Major Players *Disclaimer: Major Players sorted in no particular order Image © Mordor Intelligence. Reuse requires attribution under CC BY 4.0. | |
India Desalination Systems Market Analysis by Mordor Intelligence
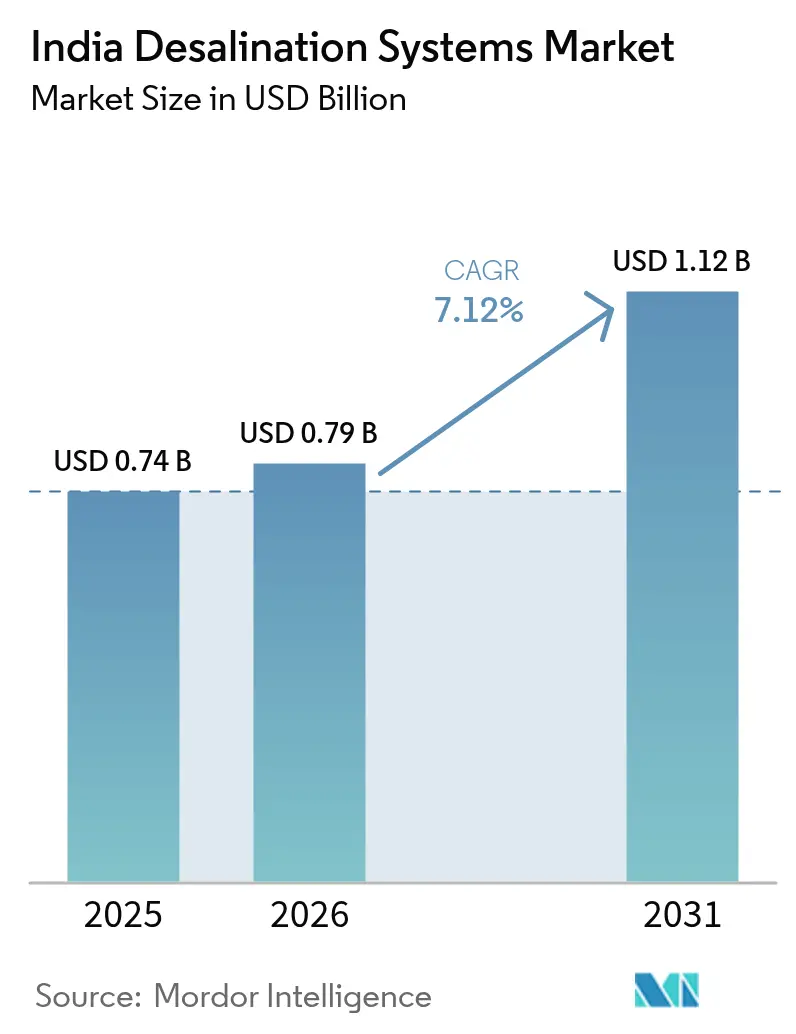
The India Desalination Systems Market size is expected to grow from USD 0.74 billion in 2025 to USD 0.79 billion in 2026 and is forecast to reach USD 1.12 billion by 2031 at 7.12% CAGR over 2026-2031. The upward curve reflects the country’s deepening water stress, rapid coastal urban growth, and supportive public spending under programs such as Jal Jeevan Mission. Investments are concentrating on energy-efficient reverse-osmosis installations, solar-powered plants, and hybrid systems that meet Zero Liquid Discharge (ZLD) mandates for industry. Developers are also racing to serve renewable-energy clusters and green-hydrogen hubs that require ultrapure process water. As capital intensity edges down and domestic membrane manufacturing scales up, project viability is improving even in mid-tier cities. Market opportunities now extend from municipal seawater plants to rural brackish-water schemes, industrial wastewater recycling, and mineral-recovery applications.
Key Report Takeaways
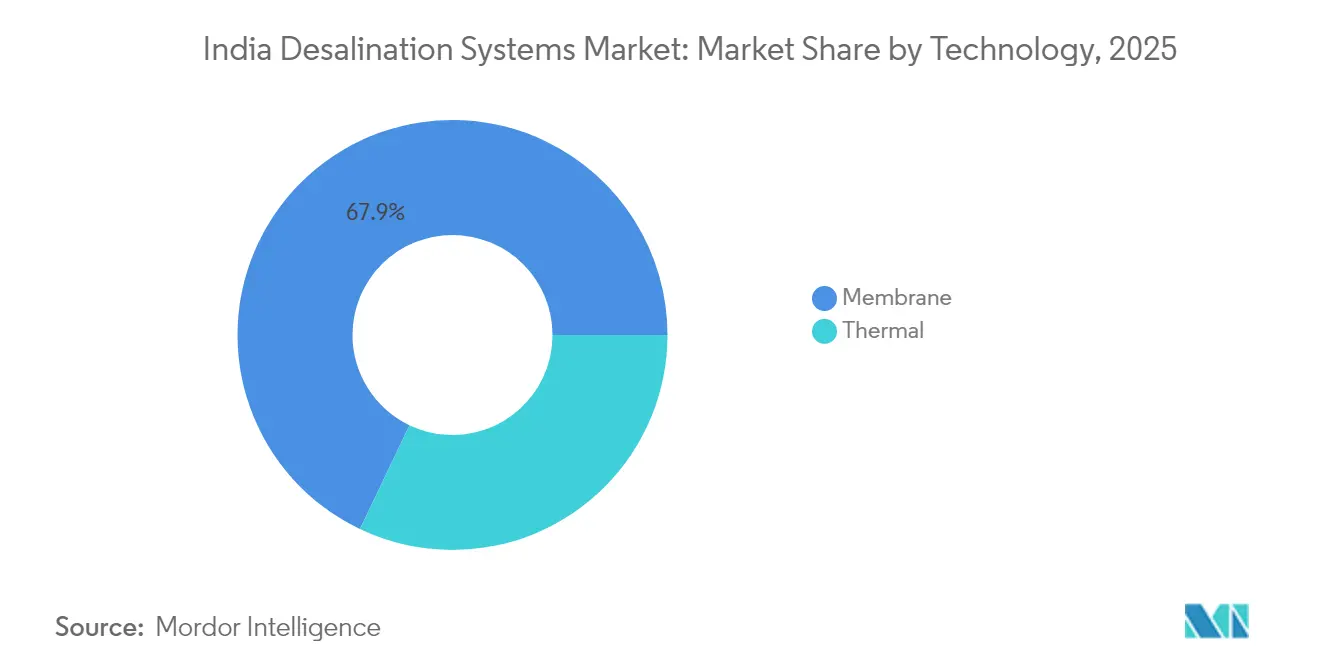
- By technology, membrane systems held 67.92% India desalination systems market share in 2025, while the same segment is projected to expand at a 7.53% CAGR through 2031.
- By application, municipal schemes accounted for 55.78% of the India desalination systems market size in 2025, whereas industrial usage is growing at a 7.28% CAGR to 2031.
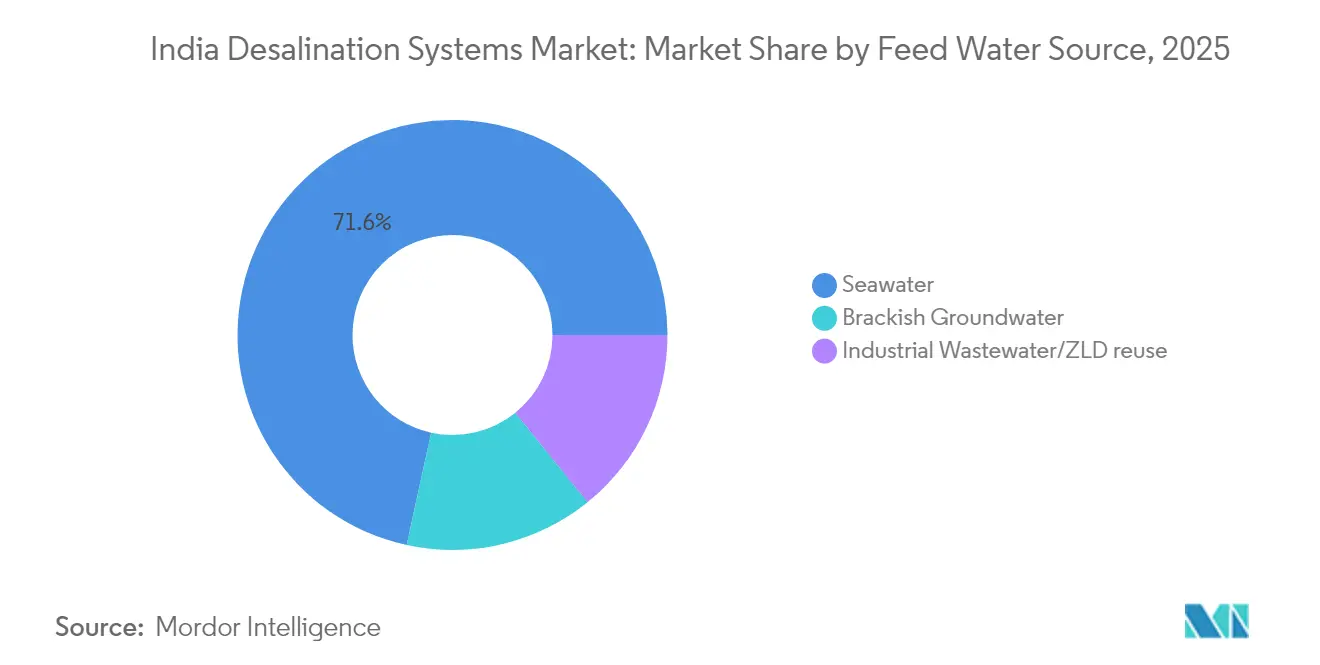
- By feed water source, seawater captured 71.58% India desalination systems market share in 2025; industrial wastewater/ZLD reuse is set to post the quickest 7.52% CAGR through 2031.
- By plant capacity, medium installations (10-100 MLD) commanded 43.88% of the India desalination systems market size in 2025 and large-scale plants (greater than 100 MLD) are advancing at a 7.34% CAGR.
Note: Market size and forecast figures in this report are generated using Mordor Intelligence’s proprietary estimation framework, updated with the latest available data and insights as of 2026.
India Desalination Systems Market Trends and Insights
Drivers Impact Analysis*
| Driver | (~) % Impact on CAGR Forecast | Geographic Relevance | Impact Timeline |
|---|---|---|---|
| Chronic water-supply deficit vs demand | +2.10% | Nationwide; acute in Rajasthan, Gujarat, Tamil Nadu | Long term (≥ 4 years) |
| Accelerated coastal urbanization and Smart-City desal mandates | +1.80% | West & South coastal corridors | Medium term (2-4 years) |
| Jal Jeevan Mission tie-ins for rural brackish-water RO | +1.40% | National rural belts | Medium term (2-4 years) |
| Grid-parity solar PV enables renewable-powered RO | +1.60% | High-irradiation states: Rajasthan, Gujarat, Andhra Pradesh | Short term (≤ 2 years) |
| Green-hydrogen grade ultrapure-water demand | +0.90% | Coastal RE hubs in Gujarat, Andhra Pradesh, Tamil Nadu | Long term (≥ 4 years) |
| Source: Mordor Intelligence | |||
Chronic Water-Supply Deficit vs Demand
Groundwater extraction surpassed 245.64 billion m³ in 2024, while recharge hit 446.90 billion m³, masking severe local mismatches[1]. Over-exploited units fell to 11.13%, yet saline intrusion persists along coasts and in arid belts. Consequently, state utilities are embedding desalination in long-term supply portfolios. NAQUIM-led aquifer mapping and artificial-recharge projects highlight that demand-side restraint alone is inadequate, cementing desalination’s role as a structural supply augmenter. Revised approval norms now prioritize energy-efficient designs and brine-management plans, favoring developers that integrate energy-recovery devices and beneficial-reuse schemes.
Accelerated Coastal Urbanization & Smart-City Desal Mandates
Gujarat’s five-plant blueprint and similar initiatives in Maharashtra and Tamil Nadu show how population shifts are outstripping river and groundwater sources. Smart-City frameworks bundle desalination with IoT metering, real-time leak detection, and predictive asset maintenance, lowering non-revenue water and operating costs. Experience from Chennai’s Minjur plant drove newer designs towards high-pressure RO membranes and turbine-based energy recovery, trimming specific energy to 3.3 kWh/m³. Municipalities now view desalination as foundational infrastructure that unlocks industrial expansion and port-led growth.
Jal Jeevan Mission Tie-ins for Rural Brackish-Water RO Schemes
Over 15 crore households had tapped connections by 2024. Funding extensions to 2028 ensure a stable pipeline for village-level RO packages, especially across fluoride- and arsenic-affected belts in Uttar Pradesh, Bihar, and Rajasthan. Community-scale solar-RO skids are emerging, with batch electrodialysis pilots reporting 22% lower lifetime costs than grid-powered RO[2]. Local service entrepreneurs trained under the Jal Jeevan frameworks are improving uptime, bolstering long-term sustainability.
Grid-Parity Solar PV Makes Renewable-Powered RO Bankable
Module prices below USD 0.20/W and high insolation states have pushed PV water costs to about USD 1.66/m³ for brackish feed. Hybrid PV-wind plus battery layouts now support 24/7 operation, and real-time demand response cuts grid draw during peak tariffs. NTPC’s USD 21.6 billion green-hydrogen cluster in Andhra Pradesh exemplifies co-located desal, RE, and electrolysis assets. Large EPCs increasingly bundle power-purchase agreements within water-purchase contracts, derisking energy exposure.
Restraints Impact Analysis*
| Restraint | (~) % Impact on CAGR Forecast | Geographic Relevance | Impact Timeline |
|---|---|---|---|
| High energy cost & tariff volatility | -1.20% | Nationwide; steeper in high-tariff states | Short term (≤ 2 years) |
| Brine-disposal compliance costs | -0.80% | Coastal states with stringent norms | Medium term (2-4 years) |
| Local-content rules inflate CAPEX for advanced membranes | -0.60% | National | Medium term (2-4 years) |
| Source: Mordor Intelligence | |||
Brine-Disposal Compliance Costs
Central Pollution Control Board draft norms mandate diffuser-equipped outfalls, salinity plume modeling, and marine-bio monitoring, pushing disposal spend to as high as 33% of total costs in some new bids. Coastal ZLD directives for chemicals and textiles amplify capex. On the upside, emerging crystallization and mineral-recovery technologies aim to monetize salts, gypsum, and magnesium, potentially offsetting compliance outlays if product-grade purity can be reached.
Local-Content Rules Inflate CAPEX for Advanced Membranes
Domestic value-addition thresholds in large municipal tenders increase bid prices for high-pressure RO elements and specialty hollow fibers, as imports attract duties and longer logistics. Ion Exchange’s expanded Goa line, plus rollouts announced by DuPont and Toray, are eroding price gaps. Volume-linked subsidies for Make-in-India components could further narrow the differential, but near-term budgets still reflect higher ticket sizes.
*Our forecasts treat driver/restraint impacts as directional, not additive. The impact forecasts reflect baseline growth, mix effects, and variable interactions.
Segment Analysis
By Technology: Membrane Systems Consolidate Leadership
The membrane segment dominated the India desalination systems market with a 67.92% share in 2025 and is set for a 7.53% CAGR as membrane efficiency climbs and unit costs fall. Within the basket, reverse osmosis rules because of robust performance at salinities up to 45,000 ppm, while electrodialysis shines for brackish feeds below 10,000 ppm. Ion Exchange’s Goa plant broadened local RO element supply, trimming lead times and foreign exchange risk. DuPont’s ultra-high-pressure RO modules rated to 120 bar cut energy draw by up to 50% compared to thermal multis-age flash lines.
Thermal desal still finds niches where waste heat is free, notably in refineries and petrochemical parks. Multi-effect distillation retrofits into cogeneration loops in Jamnagar exemplify such synergies. Hybrid layouts pairing RO with vapor compression are emerging for refinery effluents where oil-bearing streams challenge conventional membranes. Advances in graphene-oxide coatings and zwitterionic surfaces are extending membrane life and slashing chemical cleaning frequency, strengthening long-term economics for membrane centric plants.

By Application: Industrial Uptake Accelerates
Municipal bodies commanded a 55.78% share in 2025, yet industrial demand is clocking the faster 7.28% CAGR. ZLD regulations for textiles, pharma, and dyes in states like Tamil Nadu and Gujarat are the prime spur. The India desalination systems market size for industrial users will widen as companies integrate water recycling within ESG roadmaps. Textile parks in Tirupur now operate common-effluent ZLD clusters featuring RO plus thermal concentrators, curbing freshwater withdrawals by over 80%. Petrochemical complexes such as CPCL’s upcoming 60 MLD build-own-operate plant in Nagapattinam illustrate rising capex appetite for captive seawater intake and high-recovery trains. Municipal programs still underpin headline volumes, but protracted tender cycles and public-acceptance hurdles temper growth relative to nimble private projects.
By Feed Water Source: Seawater Dominates While Wastewater Reuse Surges
Seawater represented 71.58% of installed capacity in 2025, reflecting India’s 7,500 km coastline and mega-city clustering. Intake-outfall engineering, anti-fouling screens, and environmental clearances shape project critical paths. Yet the India desalination systems market share for industrial wastewater and ZLD reuse is ballooning, rising at a 7.52% CAGR as discharge norms bite. Brackish-groundwater schemes remain vital inland, especially in Rajasthan’s Thar and Gujarat’s Kachchh belts, where TDS of 4,000-15,000 ppm precludes direct use. Wastewater-fed plants face variable feed chemistry that accelerates membrane fouling; however, inline coagulation, ceramic UF pre-filters, and machine-learning dosing algorithms are lifting uptime to municipal-grade benchmarks.
By Plant Capacity: Larger Projects Gain Traction
Medium-sized plants (10-100 MLD) held 43.88% of the India desalination systems market size in 2025 because they balance scale economics with manageable capex. They remain the workhorse for tier-1 and tier-2 cities. Large schemes exceeding 100 MLD are expanding at a 7.34% CAGR as utilities chase lower unit water costs via energy-recovery turbines and bulk chemical procurement. Gujarat’s Saurashtra cluster, featuring individual projects of 100-200 MLD, typifies this pivot toward mega-scale. Smaller modules under 10 MLD stay relevant for island territories, army bases, and niche industrial estates where rapid deployment and modular expansion are prized. Digital twin platforms now enable capacity-phased rollouts with predictive O&M, de-risking initial capital and smoothing cash flows.
Geography Analysis
West India’s 38.05% revenue share in 2025 mirrors early adoption and aggressive state incentives. Gujarat blends desalination with recharge canals and leak-curbing programs, lowering overall non-revenue water. Maharashtra’s Mumbai-Pune industrial belt taps captive RO and wastewater-reuse loops to safeguard productivity amid erratic monsoons. Ports at Mundra and Hazira add offtake security through long-term utility tie-ups.
South India shows the most dynamic trajectory with a 7.23% CAGR. The Chennai metropolitan zone, already running two 100 MLD plants, is bidding a third 150 MLD unit with record-low water tariffs. Renewable-powered RO pilots in Tuticorin leverage abundant solar-irradiance and wind resources, shrinking levelized costs while slashing Scope 2 emissions. Karnataka’s electronics and biotech parks depend on 0.5 µS/cm ultrapure back-end polishers, pushing vendors to integrate electrodeionization with high-selectivity membranes.
North and East, though nascent, present latent upside. Rajasthan’s Jal Jeevan rollouts include village-cluster solar RO skids that feed 2,000-5,000 families each. Jharkhand’s steel mills retrofit blow-down recovery units to cut freshwater draw by 30%, illustrating industrial drivers beyond coastal zones. Odisha’s port-based petro-complexes are scoping 50-80 MLD seawater RO with deep-sea diffusers to meet upcoming brine norms. Cross-subsidy tariff reforms and viability-gap grants could accelerate penetration in these regions if executed effectively.
Regulatory Landscape
India’s desalination and reuse projects operate within the Environment (Protection) Act, 1986 framework, with discharge and broader environmental compliance administered by the Central Pollution Control Board (CPCB) and enforced through State Pollution Control Boards, particularly for coastal outfalls and industrial ZLD-linked systems. For coastal seawater reverse osmosis (SWRO) installations, project gating typically involves coastal approvals alongside CPCB and SPCB conditions on brine and effluent management. This makes diffuser design, monitoring, and compliant discharge pathways more central to project execution.
On the drinking-water side, procurement and acceptance criteria commonly reference BIS and drinking-water specifications such as IS 10500:2012, while product and testing standards are tightening across purification and membrane-linked systems, including IS 16240:2023 for RO systems and IS 19197:2025 for ultrafiltration membrane-based point-of-use treatment systems. Separately, the Department of Science and Technology (DST) has anchored desalination R&D and deployment pathways through the National Mission on Desalination (NMD), supporting standardization and technology-provider enrollment for coastal water security programs.
Value Chain Analysis
The India desalination systems value chain covers feasibility and approvals (including coastal clearances for seawater intake and brine outfalls), project structuring and financing, EPC delivery, and multi-year operations and maintenance (O&M). Municipal clients and industrial offtakers often tender integrated packages that combine pretreatment (screens, UF/MF, chemical dosing), core desalination (primarily RO, with LTTD in island settings), post-treatment and distribution (remineralization, pumping, pipelines), plus brine-handling infrastructure. Large-scale municipal projects increasingly draw on multilateral or bilateral funding and long-gestation execution, illustrated by the Government of India loan agreement with JICA in March 2025 for the 400 MLD Chennai Seawater Desalination Plant (II), while industrial projects are driven by water-security and compliance needs in coastal manufacturing and refinery clusters.
Upstream inputs include membranes and pressure vessels, energy-recovery devices, high-pressure pumps, instrumentation and automation, and specialty chemicals (antiscalants, coagulants, biocides, cleaners). Localization of membrane elements and skids is strengthening, with Indian suppliers and EPCs partnering global technology providers, though permitting lead times and brine-discharge compliance remain bottlenecks, reflected in CRZ-linked conditions tied to new coastal schemes such as the April 2026 clearance for the 400 MLD Manori SWRO plant in Mumbai. Downstream, the aftermarket for spares, chemicals, remote monitoring, and performance-based O&M contracts is a material profit pool, especially for medium and large plants operating under PPP or long-term utility arrangements.
Competitive Landscape
The market remains moderately fragmented. Wabag leverages EPC plus 15-year O&M contracts to lock in annuity revenue, having commissioned the 150 MLD Chennai-Nemmeli phase-II plant in 2025. Thermax scales modular 5-25 MLD ZLD systems, bundling heat-pump evaporators with RO to capture industrial segments that demand rapid delivery. Ion Exchange doubled domestic RO-element output to 3 million m² per year, shortening lead times and enhancing localization scores.
Global majors maintain a technological edge. Veolia deploys digital twin software (Aquavista) across its Indian portfolio, lifting membrane life by 12 months on average. DuPont unveiled the WAVE PRO web suite in March 2025, providing scenario-based ultrafiltration modeling in Indian conditions. Collaboration between DuPont and Indian EPCs is rising as PLI-style incentives reward local assembly. Evoqua, post-merger with Xylem, markets skid-mounted electro-deionization lines aimed at green-hydrogen developers on both coasts.
Niche disruptors are entering renewable-powered and containerized desal spaces. Start-ups branded under Make-in-India fabricate graphene-oxide coated flat-sheets that claim 25% higher flux. Others bundle PV arrays, batteries, and remote-monitoring under lease-own models, targeting resorts and island territories. Competition is progressively shifting from lowest-capex bids toward lifecycle-cost guarantees, performance-based payments, and integrated water-energy service contracts.
India Desalination Systems Industry Leaders
-
Aquatech International LLC
-
IEI
-
SUEZ SA
-
Thermax Ltd
-
WABAG
- *Disclaimer: Major Players sorted in no particular order
Market Opportunities and Future Outlook
White-space is widening across mega-scale coastal municipal additions and industrial-region captive supply, as multiple named projects progress through approvals and implementation. In Tamil Nadu, the 400 MLD Perur desalination plant has been under active execution, with Chennai Metro Water beginning final preparations in May 2026 and the Chief Minister inspecting construction progress in July 2026. This extends the immediate addressable pipeline for EPC, high-pressure RO trains, intake-outfall engineering, and long-term O&M. In Gujarat, Dholera Industrial City Development Limited initiated steps in July 2026 to appoint a consultant for techno-economic assessment and DPR for a 200 MLD seawater desalination plant in the Dholera SIR, pointing to demand for large-scale, industrial-anchored SWRO designs that incorporate renewables integration and circular-economy features such as ZLD pathways.
A second opportunity band is integrated desalination for islands and remote coastal habitations where grid-backed RO is constrained. The Ministry of Earth Sciences has highlighted operational low-temperature thermal desalination assets in Lakshadweep and, in March 2026, announced an integrated facility combining Ocean Thermal Energy Conversion with drinking-water production. This opens room for niche technology providers, modular plant OEMs, and marine engineering contractors. Industrial water-security and port-linked green fuels also widen the addressable demand base, supported by the November 2025 MoU between Oswal Energies and the Deendayal Port Authority for a 100 MLD desalination plant within a green energy hub, linking desalination system demand to ports, chemicals, and hydrogen-adjacent infrastructure rather than only municipal networks.
Recent Industry Developments
- March 2026: VA Tech WABAG secured a Letter of Award from the Chennai Metropolitan Water Supply and Sewerage Board for a PPP-based RFOMT project for a 45 MLD Tertiary Treatment Reverse Osmosis plant at Kodungaiyur, Chennai. The scope combines refurbishment, financing, and long-term operations, reinforcing outcome-based contracting and lifecycle accountability for advanced reuse-linked desalination trains.
- January 2025: VA Tech WABAG won a contract from Chennai Petroleum Corporation Ltd for the design and installation of desalination water pipelines. This strengthens the downstream conveyance portion of the desalination value chain and supports captive industrial offtake reliability for coastal petrochemical operations.
- October 2024: VA Tech WABAG received a mega order from Indosol Solar Private Limited to deliver a 100 MLD seawater desalination plant for a solar PV manufacturing facility in Andhra Pradesh. The project underscores desalination demand from new manufacturing ecosystems and highlights the role of large captive SWRO systems in enabling water-secure industrial capacity additions.
Research Methodology Framework and Report Scope
Market Definition and Coverage
For this study, the market is defined as revenue earned in India from supplying and deploying desalination systems used to convert seawater, brackish groundwater, or difficult industrial water streams into usable water. This includes the core process and treatment blocks that make the plant run.
Scope exclusions: We exclude general municipal water distribution networks, conventional wastewater treatment that does not involve desalination, and routine O&M-only services unless bundled into a system delivery.
Segmentation Overview
- By Technology
- Thermal
- Multi-Stage Flash (MSF)
- Multi-Effect Distillation (MED)
- Vapor Compression Distillation
- Membrane
- Electrodialysis (ED)
- Reverse Osmosis (RO)
- Electrodialysis Reversal (EDR)
- Other Membrane Technologies (Nanofiltration, Ultrafiltration and Microfiltration)
- Thermal
- By Application
- Municipal
- Industrial
- By Feed Water Source
- Seawater
- Brackish Groundwater
- Industrial Wastewater/ZLD reuse
- By Plant Capacity
- Small (less than 10 MLD)
- Medium (10–100 MLD)
- Large (greater than 100 MLD)
Data Sources, Market Sizing, and Validation
Desk Research
Desk work starts by mapping where desalination demand is coming from in India, and then aligning it with what has already been built or awarded. We refer to public sources such as the Central Water Commission, Central Ground Water Board, Ministry of Jal Shakti program documents, and CPCB notifications (especially for high-salinity effluent and ZLD related requirements). We also use project disclosures and tenders from major state utilities and urban agencies, which helps confirm timing, capacity bands, and typical technology choices.
To convert activity signals into a market value, we use documents such as industry association publications, peer-reviewed desalination and membrane journals for performance ranges, and customs or trade statistics for key equipment where relevant. Company annual reports, investor presentations, and reputable press releases are used to cross-check order pipelines and commissioning updates. When needed, we also pull from paid subscriptions focused on company financials and intelligence, patent databases, and India tenders and contracts to improve completeness. The sources listed here are illustrative, and we used additional public and paid references to collect, validate, and clarify the data.
Primary Interviews and Surveys
Primary work is used to test what the desk model cannot fully show, mainly pricing ranges, delivery scope splits, and the pace of project awards versus execution. We speak with a mix of system integrators, EPC-linked stakeholders, component suppliers, industrial water users, and municipal decision influencers across India, so assumptions on technology mix and capacity additions are grounded in current behavior.
Distribution of primary research fieldwork respondents
| Company type | Respondent position |
|---|---|
| Top tier: 34% | CXOs: 18% |
| Mid tier: 44% | Functional/Unit leaders: 37% |
| Smaller Players: 22% | Managers: 45% |
Market-Sizing & Forecasting
Our core model uses a top-down approach, where the installed and planned desalination capacity by source water and end use is reconstructed. We then convert this into annual system revenue using typical capex per MLD ranges by technology and plant size. The conversion is guided by market fingerprints such as RO versus thermal share, average recovery and pretreatment complexity by feed type, plant capacity buckets (small, medium, large), and the share of industrial projects tied to ZLD and reuse upgrades.
Once the total is formed, it is corroborated with selective bottom-up checks based on sampled project values, channel pricing discussions, and supplier-side volume to ASP approximations for major equipment blocks. If project pricing is missing, gaps are handled by applying benchmark cost curves by capacity band and then adjusting for intake and brine handling needs, which are often the key swing factors in India. For forecasting, scenario analysis is used because award cycles, financing, and execution timing can shift year to year, and the scenarios are anchored to expert expectations on coastal municipal demand, industrial water stress, and policy driven compliance needs.
Data Validation & Update Cycle
Validation is done by checking the modeled value against independent signals such as announced MLD additions, tender award cadence, and observed technology mix shifts in new projects. Outliers are flagged when implied cost per MLD or growth jumps do not align with what industry participants describe, and then assumptions are revisited until the variance becomes explainable.
Before sign-off, the model and key inputs go through multi-step analyst reviews, and follow-up calls are triggered when a major tender is delayed, a large plant is commissioned early, or pricing moves sharply due to energy or material changes. Reports are refreshed annually, with interim updates for material events, and a final pre-delivery review is completed so clients receive the most current view available.
Mordor Intelligence's India Desalination Systems Market Estimate Compared With Other Published Estimates
Published market values for India desalination can differ even when everyone is looking at the same country, because the counting rules and the timing assumptions are not always aligned. Differences usually come from what is included as a system, whether values are taken at award or commissioning, and how pricing is normalized into USD for the year stated.
The benchmark table shows a tighter 2025 to 2026 step change than some other sources. In Mordor Intelligence's model, the market is counted as desalination systems delivered across thermal and membrane plants, by application, source water, and capacity band, rather than folding in adjacent water treatment spend that is not specific to salt removal. A second driver is how project pipelines are treated, where some estimates lean more on planned announcements while others wait for tender award and financial closure signals before value is recognized.
Benchmark comparison
| Source | Market Size | Gaps in Research Methodology |
|---|---|---|
| Mordor Intelligence | USD 0.74 B (2025) | |
| Industry Publication A | USD 0.96 B (2024) | Often reported as a broader desalination and water infrastructure view, and may reflect project announcement values and mixed inclusions (like intake, distribution, or non-desalination treatment packages) that lift the total. |
| Regional Advisory B | USD 0.68 B (2025) | Typically applies conservative realization of pipeline projects and may use narrower pricing assumptions for membrane systems, which can undercount higher-spec industrial ZLD-linked desalination configurations. |
Taken together, the spread is mainly explained by what gets counted as desalination versus adjacent water treatment, and by whether pipeline value is recognized early or only after stronger execution proof points. Our approach stays traceable to capacity additions, technology and size mixes, and realistic cost bands that can be rechecked and updated as new tenders and commissioning data appear.
Key Questions Answered in the Report
How large is the India desalination systems market in 2026?
It is valued at USD 0.79 billion with a 7.12% CAGR outlook to 2031.
Which technology type leads adoption?
Membrane-based systems, especially reverse osmosis, held 67.92% share in 2025 and continue to grow fastest.
Why are industrial users accelerating purchases?
Tighter Zero Liquid Discharge rules and sustainability targets push industries to secure reliable, compliant water through captive desalination.
Which region is expanding quickest?
South India posts the highest 7.23% CAGR thanks to renewable-energy projects and technology-sector demand.
What role does renewable energy play in project economics?
Grid-parity solar and hybrid PV-wind setups cut operating energy costs by around 40%, improving bankability of RO plants.