| Study Period | 2018 - 2030 |
| Base Year For Estimation | 2024 |
| Forecast Data Period | 2025 - 2030 |
| Market Volume (2025) | 3.31 Thousand MW |
| Market Volume (2030) | 6.69 Thousand MW |
| CAGR | 15.11 % |
| Market Concentration | Medium |
Major Players*Disclaimer: Major Players sorted in no particular order |

India Data Center Market Analysis
The India Data Center Market size is estimated at 3.31 thousand MW in 2025, and is expected to reach 6.69 thousand MW by 2030, growing at a CAGR of 15.11%. Further, the market is expected to generate colocation revenue of USD 2,337.9 Million in 2025 and is projected to reach USD 4,931.8 Million by 2030, growing at a CAGR of 16.10% during the forecast period (2025-2030).
The Indian data center industry landscape is undergoing a significant transformation driven by robust digital infrastructure development and supportive government policies. State governments are offering attractive incentives, including land value exemptions of up to 50%, complete stamp duty exemptions, and substantial reimbursements on interest payments. The Uttar Pradesh government, for instance, provides a 100% exemption on electricity and transmission charges to encourage data center growth in India. These initiatives have attracted major operators to establish large-scale facilities, particularly focusing on Tier 3 and Tier 4 data centers that offer enhanced reliability and disaster recovery capabilities.
The market is witnessing a substantial shift in data center industry trends and capabilities. Tier 3 data centers are experiencing remarkable growth, with operators increasingly investing in facilities that provide lower downtime and comprehensive disaster recovery solutions. As of 2022, there were 77 Tier 3 certified data centers in India, demonstrating the industry's commitment to maintaining higher operational standards. This trend is particularly evident in major metropolitan areas, where businesses are demanding more reliable and sophisticated data center solutions to support their digital transformation initiatives.
The streaming and digital content sector is emerging as a significant driver of data center growth. According to recent statistics, India's OTT market has achieved remarkable penetration with 423.8 million subscribers, including 119 million paid subscribers as of 2022. The competitive landscape in this sector is intensifying, with Disney+ Hotstar leading with over 40 million subscribers, followed by Prime Video with 20 million subscribers, and Netflix with 6.5 million subscribers as of October 2023. This surge in digital content consumption is compelling data center industry operators to enhance their infrastructure capabilities and expand their presence across strategic locations.
The industry is experiencing a notable trend toward sustainable and technologically advanced facilities. Data center operators are increasingly implementing innovative solutions such as fuel cell technology to reduce carbon emissions, as demonstrated by recent installations in Karnataka. The sector is also witnessing significant infrastructure developments, with the Department of Telecom authorizing comprehensive telecom development packages, including the installation of new 4G towers and extensive optical fiber networks. These initiatives are complemented by projects like the Kochi OFC Project, which involves installing 225 kilometers of optical fiber internet access, showcasing the industry's commitment to building robust digital infrastructure and data center future trends.
India Data Center Market Trends
Growth of telecom operators such as Jio, and others providing smartphones and internet services at resonable rates, it has boosted the data centers market
- Indian smartphone users are expected to grow from 794.4 million in 2022 to 1.2 billion in 2029 at a CAGR of 5.52%. Government initiatives such as the “Make in India” movement have offered incentives to the smartphone industry, which has resulted in India producing smartphones with specifications that run applications seamlessly and at an affordable cost.
- The growth of telecom operators, such as Jio, has revolutionized the internet industry with their packages at a reasonable cost. In addition to that, the data demand increased continuously, with the government encouraging digital payments and services online.
- With the launch of the 5G network in India, data consumption is expected to rapidly increase, as Indian users have a heavy inclination toward online OTT content, gaming, shopping, smart home automation applications, online security cams, etc., which is expected to further propel the demand for data centers.

Understand The Key Trends Shaping This Market
Download PDF
Increasing household access to broadband and growing Internet exchanges are driving the market growth.
- A copper-based internet connection provides speeds of up to 300 Mbps whereas a fiber optic internet speeds are upto 10 Gbps. Earlier, the broadband network in India was more inclined toward copper cable connections. New innovations such as cloud technology have led to the adoption of fiber optic cables that offer higher speeds to move data stored in the cloud. Users are switching to fiber optic cables, which connect cloud servers with data centers. Hence, in terms of connectivity, the demand for copper cables is on the decline.
- Broadband connections rose from 6.1 crore in March 2014 to 81.62 crores in September 2022 growing by 1238%. The flagship BharatNet project is being implemented in phases to give broadband access to all 2.6 lakh Gramme Panchayats (GPs) in the country. Phase-I was finished in December 2017 and covered over 1 lakh GPs. As of October 2022, 6,00,898 km of Optical Fibre Cable had been laid under the project, 1,90,364 GPs had been connected by Optical Fibre Cable (OFC), and 1,77,665 GPs were Service Ready on OFC. Furthermore, 4466 GPs have been linked by satellite media. 1,82,131 GPs are ready to serve. This statistic shows an increase in broadband data usage.
- The growing urban population increasingly uses devices such as smart TVs, smartphones, and smart lighting systems, which has led to increased demand for higher bandwidth speeds that can only be achieved through the use of these fiber optic cables.

OTHER KEY INDUSTRY TRENDS COVERED IN THE REPORT
- Rising OTT subscription and ecommerce sales boost the data center growth
- The increasing expansion rate of fiber optics and the use of internet exchanges in France show the demand for data centers.
- Increased use of voice applications, such as Skype, Microsoft Teams, Zoom, and Google Meet and rising penetration of 5G network would bloster the data centers market.
Segment Analysis: By Data Center Size
Mega Segment in India Data Center Market
The mega data center segment dominates the Indian data center market, accounting for approximately 42% market share in 2024, with an IT load capacity of around 836 MW. This segment's prominence is driven by major players like AdaniConneX, which is developing six mega-size DC projects across the country with a combined IT load capacity estimated to be 1 GW at full capacity upon completion. Additionally, other key players, including Sify, Yotta Infrastructures, CtrlS, and STT Telemedia, are actively developing mega data centers to meet the growing demand. The segment is also experiencing the fastest growth trajectory in the market, projected to expand at nearly 29% during 2024-2029, driven by favorable government policies and increasing demand for large-scale data processing capabilities. The size of the data center market is significantly impacted by these developments.
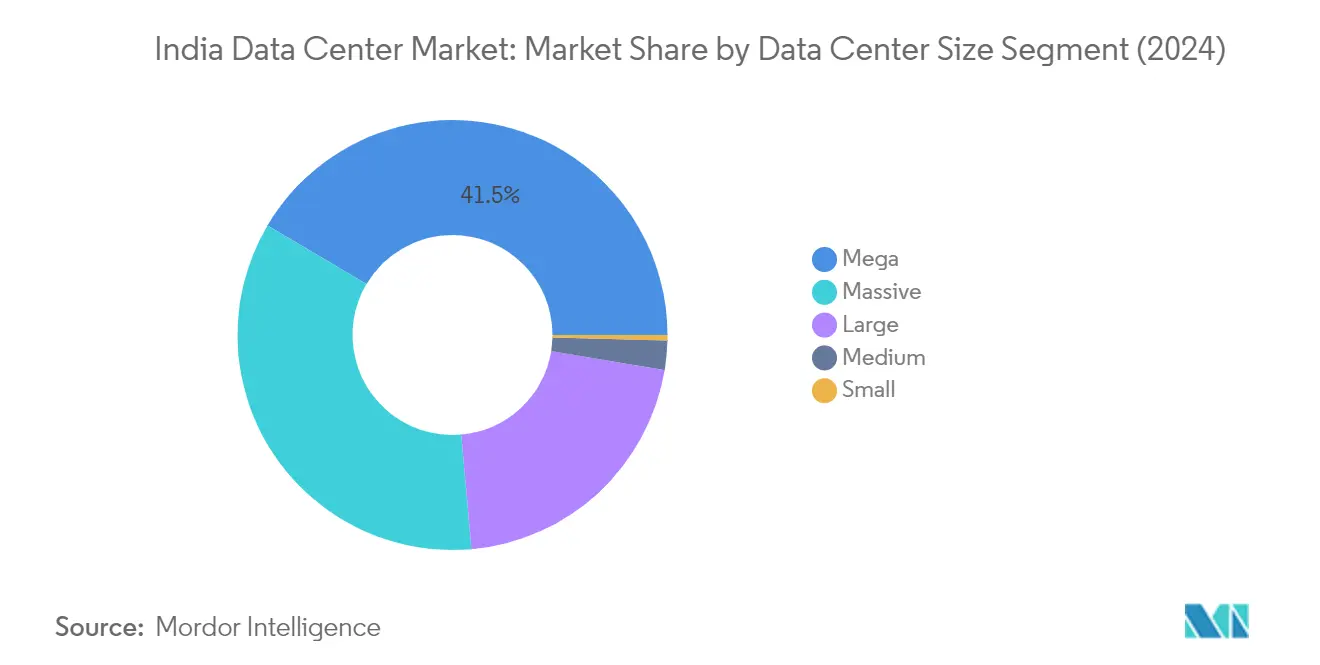
Remaining Segments in Data Center Size
The massive segment represents the second-largest category in the market, with facilities primarily concentrated in Mumbai, NCR, and Bangalore regions. These data centers cater to the growing demands of enterprise customers and cloud service providers. The large segment maintains a significant presence in the market, characterized by established operators like STT Telemedia, Reliance, and NTT Ltd. The medium and small segments, while smaller in scale, play crucial roles in serving specific regional markets and specialized customer needs, particularly in emerging tier-2 and tier-3 cities where demand for data center services market is gradually increasing.
Segment Analysis: By Tier Type
Tier 3 Segment in India Data Center Market
The Tier 3 segment dominates the Indian data center market, accounting for approximately 80% market share in 2024. This significant market presence is driven by the reliability and affordability factors that make Tier 3 data centers particularly attractive to businesses. Mumbai leads in hosting Tier 3 data centers with about 30% of facilities, followed by Bangalore at 17% and NCR at 16%. Major operators like STT Telemedia, NXTRA, and NTT Ltd have established a strong presence in this segment, with STT Telemedia operating 18 Tier 3 certified facilities. The segment's dominance is further reinforced by the ongoing construction of 25 new Tier 3 standard facilities across key locations, including Mumbai, NCR, Bangalore, Hyderabad, and Chennai.
Tier 4 Segment in India Data Center Market
The Tier 4 data center segment in India is experiencing the most rapid growth in the Indian data center market, projected to expand at approximately 30% CAGR from 2024 to 2029. This remarkable growth trajectory is primarily driven by increasing demand for high-reliability data center facilities with minimal downtime. Mumbai has emerged as the primary hub for Tier 4 data centers in India, hosting seven of the country's Tier 4 data centers. CtrlS has established a dominant position in this segment, operating 62% of the country's Tier 4 data centers, while other key players, including Equinix Inc., Pi, ST Telemedia, and Yotta Infrastructures, maintain a strategic presence. The segment's growth is further supported by the ongoing construction of massive and mega data center facilities by major operators like Equinix Inc. and CtrlS in Mumbai.
Remaining Segments in Tier Type
The Tier 1 & 2 segment represents the basic level of data center infrastructure in the Indian market. These facilities offer fundamental data center capabilities but with limited redundancy and reliability features compared to higher tier levels. While this segment continues to serve specific market needs, particularly for small and medium-sized businesses with basic hosting requirements, it shows minimal growth potential as businesses increasingly prefer higher tier facilities. The segment's limited expansion is evident in its concentrated presence in the NCR region, where two out of five Tier 1 & 2 data centers are located, with Go4Hosting maintaining a significant presence in this category.
Segment Analysis: By Absorption
Utilized Segment in India Data Center Market
The utilized segment dominates the Indian data center market, accounting for approximately 83% of the total IT load capacity in 2024. This significant market share is driven by the increasing adoption of smart devices and technologies by the growing urban population, coupled with the availability of low-cost bandwidth by new operators providing more bandwidth at competitive prices. The processing of massive amounts of data to deliver seamless experiences to Indian customers has triggered substantial growth in data center utilization across the region. Major sectors contributing to this high utilization include cloud service providers, BFSI, e-commerce, government services, and media & entertainment companies. The segment's growth is further supported by the rapid digitalization across industries, increasing demand for data processing capabilities, and the expansion of hyperscale facilities by major operators to meet the rising data consumption needs. The data center infrastructure market is significantly impacted by these trends.
Non-Utilized Segment in India Data Center Market
The non-utilized segment represents the available capacity in data centers that remains unused or reserved for future expansion. This segment plays a crucial role in the market as it provides the necessary buffer capacity for data centers to accommodate sudden spikes in demand and future growth requirements. Data center operators strategically maintain this non-utilized capacity to ensure they can quickly respond to increasing customer demands without compromising service quality. The segment is particularly important in emerging data center hotspots like Mumbai, Bangalore, and NCR, where operators are building massive facilities with phased utilization plans. This approach allows them to optimize their infrastructure investments while maintaining the flexibility to scale operations based on market demands and customer requirements.
Segment Analysis: By Hotspot
India Data Center Industry Overview
Top Companies in India Data Center Market
The Indian data center market players are characterized by aggressive expansion strategies and technological innovation among key players. Data center companies in India are increasingly focusing on implementing renewable energy solutions and sustainable practices in their facilities to reduce carbon emissions and achieve net-zero goals. Strategic partnerships and joint ventures have become common to enhance service offerings and geographical reach, particularly in emerging tech hubs across different regions. Operators are investing heavily in upgrading their facilities to higher-tier certifications while implementing advanced cooling technologies and power management systems. The market shows a strong trend toward developing hyperscale facilities to meet the growing demand from cloud service providers and large enterprises. Companies are also emphasizing interconnection services and edge computing capabilities to provide comprehensive solutions to their customers.
Local Players Dominate Evolving Market Landscape
The Indian data center market exhibits a mix of domestic conglomerates and international players, with local operators maintaining a significant market advantage due to their understanding of regional dynamics and established relationships. The market structure shows moderate consolidation, with the top data center companies in India controlling a substantial portion of the data center market share while maintaining a strong presence across major cities. Strategic acquisitions and partnerships between local real estate developers and global data center companies in India have become increasingly common, as companies seek to combine local expertise with international best practices and technical capabilities.
The competitive landscape is evolving with the entry of new players, particularly from real estate and telecom backgrounds, who are leveraging their existing infrastructure and customer relationships. Joint ventures between domestic and international players have emerged as a preferred mode of market entry, allowing companies to share risks and capitalize on complementary strengths. The market has witnessed increased investment from private equity firms and infrastructure funds, indicating strong growth potential and market maturity.
Innovation and Sustainability Drive Future Growth
Success in the Indian data center market increasingly depends on operators' ability to differentiate through technological innovation and sustainable operations. Data center service providers in India need to focus on developing energy-efficient facilities, implementing renewable energy solutions, and offering advanced security features to meet evolving customer requirements. The ability to provide customized solutions, particularly for emerging sectors like e-commerce and digital payments, while maintaining high reliability and uptime standards, will be crucial for market success. Operators must also consider geographical diversification beyond traditional hubs to tap into emerging markets while maintaining strong relationships with telecom providers and internet exchanges.
Future market leaders will need to demonstrate expertise in managing complex hybrid and multi-cloud environments while offering comprehensive managed services portfolios. Companies must invest in skilled workforce development and maintain strong relationships with government bodies to navigate regulatory requirements effectively. The ability to offer flexible pricing models and value-added services while maintaining operational efficiency will be critical for sustained growth. Operators should also focus on building strong ecosystem partnerships and developing edge computing capabilities to address emerging opportunities in IoT and 5G applications.
India Data Center Market Leaders
-
Equinix Inc.
-
NTT Ltd
-
Nxtra Data Ltd
-
Sify Technologies Ltd
-
STT GDC Pte Ltd
- *Disclaimer: Major Players sorted in no particular order

Need More Details on Market Players and Competiters?
Download PDF
India Data Center Market News
- November 2022: STT Telemedia signed a Memorandum of Understanding with the Indian government, through which it plans to expand by opening new data center facilities in the Indian state of Karnataka within the next 10 years.
- October 2022: Pi Datacenters started a joint venture with Sequretek, which offers cybersecurity solutions. The partnership is aimed at providing data security for Pi’s data centers, cloud, and other service offerings.
- September 2022: Nxtra Data announced the implementation of hydrogen fuel cells in its data center facility in the Indian state of Karnataka, which would help reduce carbon emissions.
Free With This Report
We provide a complimentary and exhaustive set of data points on the country and regional level metrics that present the fundamental structure of the industry. Presented in the form of 50+ free charts, the sections cover difficult to find data on various countries on smartphone users, data traffic per smartphone, mobile and broadband data speed, fiber connectivity network, and submarine cables.


India Data Center Market Report - Table of Contents
1. EXECUTIVE SUMMARY & KEY FINDINGS
2. REPORT OFFERS
3. INTRODUCTION
- 3.1 Study Assumptions & Market Definition
- 3.2 Scope of the Study
- 3.3 Research Methodology
4. MARKET OUTLOOK
- 4.1 It Load Capacity
- 4.2 Raised Floor Space
- 4.3 Colocation Revenue
- 4.4 Installed Racks
- 4.5 Rack Space Utilization
- 4.6 Submarine Cable
5. Key Industry Trends
- 5.1 Smartphone Users
- 5.2 Data Traffic Per Smartphone
- 5.3 Mobile Data Speed
- 5.4 Broadband Data Speed
- 5.5 Fiber Connectivity Network
-
5.6 Regulatory Framework
- 5.6.1 India
- 5.7 Value Chain & Distribution Channel Analysis
6. MARKET SEGMENTATION (INCLUDES MARKET SIZE IN VOLUME, FORECASTS UP TO 2030 AND ANALYSIS OF GROWTH PROSPECTS)
-
6.1 Hotspot
- 6.1.1 Bangalore
- 6.1.2 Chennai
- 6.1.3 Hyderabad
- 6.1.4 Mumbai
- 6.1.5 NCR
- 6.1.6 Pune
- 6.1.7 Rest of India
-
6.2 Data Center Size
- 6.2.1 Large
- 6.2.2 Massive
- 6.2.3 Medium
- 6.2.4 Mega
- 6.2.5 Small
-
6.3 Tier Type
- 6.3.1 Tier 1 and 2
- 6.3.2 Tier 3
- 6.3.3 Tier 4
-
6.4 Absorption
- 6.4.1 Non-Utilized
- 6.4.2 Utilized
- 6.4.2.1 By Colocation Type
- 6.4.2.1.1 Hyperscale
- 6.4.2.1.2 Retail
- 6.4.2.1.3 Wholesale
- 6.4.2.2 By End User
- 6.4.2.2.1 BFSI
- 6.4.2.2.2 Cloud
- 6.4.2.2.3 E-Commerce
- 6.4.2.2.4 Government
- 6.4.2.2.5 Manufacturing
- 6.4.2.2.6 Media & Entertainment
- 6.4.2.2.7 Telecom
- 6.4.2.2.8 Other End User
7. COMPETITIVE LANDSCAPE
- 7.1 Market Share Analysis
- 7.2 Company Landscape
-
7.3 Company Profiles (includes Global Level Overview, Market Level Overview, Core Business Segments, Financials, Headcount, Key Information, Market Rank, Market Share, Products and Services, and Analysis of Recent Developments).
- 7.3.1 CtrlS Datacenters Ltd
- 7.3.2 Equinix Inc.
- 7.3.3 ESDS Software Solution Ltd
- 7.3.4 Go4hosting
- 7.3.5 NTT Ltd
- 7.3.6 Nxtra Data Ltd
- 7.3.7 Pi Datacenters Pvt Ltd
- 7.3.8 Reliance
- 7.3.9 Sify Technologies Ltd
- 7.3.10 STT GDC Pte Ltd
- 7.3.11 WebWerks
- 7.3.12 Yotta Infrastructure Solutions
- 7.4 LIST OF COMPANIES STUDIED
8. KEY STRATEGIC QUESTIONS FOR DATA CENTER CEOS
9. APPENDIX
-
9.1 Global Overview
- 9.1.1 Overview
- 9.1.2 Porter’s Five Forces Framework
- 9.1.3 Global Value Chain Analysis
- 9.1.4 Global Market Size and DROs
- 9.2 Sources & References
- 9.3 List of Tables & Figures
- 9.4 Primary Insights
- 9.5 Data Pack
- 9.6 Glossary of Terms
You Can Purchase Parts Of This Report. Check Out Prices For Specific Sections
Get Price Break-up Now
List of Tables & Figures
- Figure 1:
- VOLUME OF IT LOAD CAPACITY, MW, INDIA, 2018 - 2030
- Figure 2:
- VOLUME OF RAISED FLOOR AREA, SQ.FT. ('000), INDIA, 2018 - 2030
- Figure 3:
- VALUE OF COLOCATION REVENUE, USD MILLION, INDIA, 2018 - 2030
- Figure 4:
- VOLUME OF INSTALLED RACKS, NUMBER, INDIA, 2018 - 2030
- Figure 5:
- RACK SPACE UTILIZATION, %, INDIA, 2018 - 2030
- Figure 6:
- COUNT OF SMARTPHONE USERS, IN MILLION, INDIA, 2018 - 2030
- Figure 7:
- DATA TRAFFIC PER SMARTPHONE, GB, INDIA, 2018 - 2030
- Figure 8:
- AVERAGE MOBILE DATA SPEED, MBPS, INDIA, 2018 - 2030
- Figure 9:
- AVERAGE BROADBAND SPEED, MBPS, INDIA, 2018 - 2030
- Figure 10:
- LENGTH OF FIBER CONNECTIVITY NETWORK, KILOMETER, INDIA, 2018 - 2030
- Figure 11:
- VOLUME OF IT LOAD CAPACITY, MW, INDIA, 2018 - 2030
- Figure 12:
- VOLUME OF HOTSPOT, MW, INDIA, 2018 - 2030
- Figure 13:
- VOLUME SHARE OF HOTSPOT, %, INDIA, 2018 - 2030
- Figure 14:
- VOLUME SIZE OF BANGALORE, MW, INDIA, 2018 - 2030
- Figure 15:
- VOLUME SHARE OF BANGALORE, MW, HOTSPOT, %, INDIA, 2018 - 2030
- Figure 16:
- VOLUME SIZE OF CHENNAI, MW, INDIA, 2018 - 2030
- Figure 17:
- VOLUME SHARE OF CHENNAI, MW, HOTSPOT, %, INDIA, 2018 - 2030
- Figure 18:
- VOLUME SIZE OF HYDERABAD, MW, INDIA, 2018 - 2030
- Figure 19:
- VOLUME SHARE OF HYDERABAD, MW, HOTSPOT, %, INDIA, 2018 - 2030
- Figure 20:
- VOLUME SIZE OF MUMBAI, MW, INDIA, 2018 - 2030
- Figure 21:
- VOLUME SHARE OF MUMBAI, MW, HOTSPOT, %, INDIA, 2018 - 2030
- Figure 22:
- VOLUME SIZE OF NCR, MW, INDIA, 2018 - 2030
- Figure 23:
- VOLUME SHARE OF NCR, MW, HOTSPOT, %, INDIA, 2018 - 2030
- Figure 24:
- VOLUME SIZE OF PUNE, MW, INDIA, 2018 - 2030
- Figure 25:
- VOLUME SHARE OF PUNE, MW, HOTSPOT, %, INDIA, 2018 - 2030
- Figure 26:
- VOLUME SIZE OF REST OF INDIA, MW, INDIA, 2018 - 2030
- Figure 27:
- VOLUME SHARE OF REST OF INDIA, MW, HOTSPOT, %, INDIA, 2018 - 2030
- Figure 28:
- VOLUME OF DATA CENTER SIZE, MW, INDIA, 2018 - 2030
- Figure 29:
- VOLUME SHARE OF DATA CENTER SIZE, %, INDIA, 2018 - 2030
- Figure 30:
- VOLUME SIZE OF LARGE, MW, INDIA, 2018 - 2030
- Figure 31:
- VOLUME SIZE OF MASSIVE, MW, INDIA, 2018 - 2030
- Figure 32:
- VOLUME SIZE OF MEDIUM, MW, INDIA, 2018 - 2030
- Figure 33:
- VOLUME SIZE OF MEGA, MW, INDIA, 2018 - 2030
- Figure 34:
- VOLUME SIZE OF SMALL, MW, INDIA, 2018 - 2030
- Figure 35:
- VOLUME OF TIER TYPE, MW, INDIA, 2018 - 2030
- Figure 36:
- VOLUME SHARE OF TIER TYPE, %, INDIA, 2018 - 2030
- Figure 37:
- VOLUME SIZE OF TIER 1 AND 2, MW, INDIA, 2018 - 2030
- Figure 38:
- VOLUME SIZE OF TIER 3, MW, INDIA, 2018 - 2030
- Figure 39:
- VOLUME SIZE OF TIER 4, MW, INDIA, 2018 - 2030
- Figure 40:
- VOLUME OF ABSORPTION, MW, INDIA, 2018 - 2030
- Figure 41:
- VOLUME SHARE OF ABSORPTION, %, INDIA, 2018 - 2030
- Figure 42:
- VOLUME SIZE OF NON-UTILIZED, MW, INDIA, 2018 - 2030
- Figure 43:
- VOLUME OF COLOCATION TYPE, MW, INDIA, 2018 - 2030
- Figure 44:
- VOLUME SHARE OF COLOCATION TYPE, %, INDIA, 2018 - 2030
- Figure 45:
- VOLUME SIZE OF HYPERSCALE, MW, INDIA, 2018 - 2030
- Figure 46:
- VOLUME SIZE OF RETAIL, MW, INDIA, 2018 - 2030
- Figure 47:
- VOLUME SIZE OF WHOLESALE, MW, INDIA, 2018 - 2030
- Figure 48:
- VOLUME OF END USER, MW, INDIA, 2018 - 2030
- Figure 49:
- VOLUME SHARE OF END USER, %, INDIA, 2018 - 2030
- Figure 50:
- VOLUME SIZE OF BFSI, MW, INDIA, 2018 - 2030
- Figure 51:
- VOLUME SIZE OF CLOUD, MW, INDIA, 2018 - 2030
- Figure 52:
- VOLUME SIZE OF E-COMMERCE, MW, INDIA, 2018 - 2030
- Figure 53:
- VOLUME SIZE OF GOVERNMENT, MW, INDIA, 2018 - 2030
- Figure 54:
- VOLUME SIZE OF MANUFACTURING, MW, INDIA, 2018 - 2030
- Figure 55:
- VOLUME SIZE OF MEDIA & ENTERTAINMENT, MW, INDIA, 2018 - 2030
- Figure 56:
- VOLUME SIZE OF TELECOM, MW, INDIA, 2018 - 2030
- Figure 57:
- VOLUME SIZE OF OTHER END USER, MW, INDIA, 2018 - 2030
- Figure 58:
- VOLUME SHARE OF MAJOR PLAYERS, %, INDIA
India Data Center Industry Segmentation
Bangalore, Chennai, Hyderabad, Mumbai, NCR, Pune are covered as segments by Hotspot. Large, Massive, Medium, Mega, Small are covered as segments by Data Center Size. Tier 1 and 2, Tier 3, Tier 4 are covered as segments by Tier Type. Non-Utilized, Utilized are covered as segments by Absorption.| Hotspot | Bangalore | |||
| Chennai | ||||
| Hyderabad | ||||
| Mumbai | ||||
| NCR | ||||
| Pune | ||||
| Rest of India | ||||
| Data Center Size | Large | |||
| Massive | ||||
| Medium | ||||
| Mega | ||||
| Small | ||||
| Tier Type | Tier 1 and 2 | |||
| Tier 3 | ||||
| Tier 4 | ||||
| Absorption | Non-Utilized | |||
| Utilized | By Colocation Type | Hyperscale | ||
| Retail | ||||
| Wholesale | ||||
| By End User | BFSI | |||
| Cloud | ||||
| E-Commerce | ||||
| Government | ||||
| Manufacturing | ||||
| Media & Entertainment | ||||
| Telecom | ||||
| Other End User | ||||
Need A Different Region or Segment?
Customize Now
Market Definition
- IT LOAD CAPACITY - The IT load capacity or installed capacity, refers to the amount of energy consumed by servers and network equipments placed in a rack installed. It is measured in megawatt (MW).
- ABSORPTION RATE - It denotes the extend to which the data center capacity has been leased out. For instance, a 100 MW DC has leased out 75 MW, then absorption rate would be 75%. It is also referred as utilization rate and leased-out capacity.
- RAISED FLOOR SPACE - It is an elevated space build over the floor. This gap between the original floor and the elevated floor is used to accommodate wiring, cooling, and other data center equipment. This arrangement assist in having proper wiring and cooling infrastructure. It is measured in square feet (ft^2).
- DATA CENTER SIZE - Data Center Size is segmented based on the raised floor space allocated to the data center facilities. Mega DC - # of Racks must be more than 9000 or RFS (raised floor space) must be more than 225001 Sq. ft; Massive DC - # of Racks must be in between 9000 and 3001 or RFS must be in between 225000 Sq. ft and 75001 Sq. ft; Large DC - # of Racks must be in between 3000 and 801 or RFS must be in between 75000 Sq. ft and 20001 Sq. ft; Medium DC # of Racks must be in between 800 and 201 or RFS must be in between 20000 Sq. ft and 5001 Sq. ft; Small DC - # of Racks must be less than 200 or RFS must be less than 5000 Sq. ft.
- TIER TYPE - According to Uptime Institute the data centers are classified into four tiers based on the proficiencies of redundant equipment of the data center infrastructure. In this segment the data center are segmented as Tier 1,Tier 2, Tier 3 and Tier 4.
- COLOCATION TYPE - The segment is segregated into 3 categories namely Retail, Wholesale and Hyperscale Colocation service. The categorization is done based on the amount of IT load leased out to potential customers. Retail colocation service has leased capacity less than 250 kW; Wholesale colocation services has leased capacity between 251 kW and 4 MW and Hyperscale colocation services has leased capacity more than 4 MW.
- END CONSUMERS - The Data Center Market operates on a B2B basis. BFSI, Government, Cloud Operators, Media and Entertainment, E-Commerce, Telecom and Manufacturing are the major end-consumers in the market studied. The scope only includes colocation service operators catering to the increasing digitalization of the end-user industries.
| Keyword | Definition |
|---|---|
| Rack Unit | Generally referred as U or RU, it is the unit of measurement for the server unit housed in the racks in the data center. 1U is equal to 1.75 inches. |
| Rack Density | It defines the amount of power consumed by the equipment and server housed in a rack. It is measured in kilowatt (kW). This factor plays a critical role in data center design and, cooling and power planning. |
| IT Load Capacity | The IT load capacity or installed capacity, refers to the amount of energy consumed by servers and network equipment placed in a rack installed. It is measured in megawatt (MW). |
| Absorption Rate | It denotes how much of the data center capacity has been leased out. For instance, if a 100 MW DC has leased out 75 MW, then the absorption rate would be 75%. It is also referred to as utilization rate and leased-out capacity. |
| Raised Floor Space | It is an elevated space built over the floor. This gap between the original floor and the elevated floor is used to accommodate wiring, cooling, and other data center equipment. This arrangement assists in having proper wiring and cooling infrastructure. It is measured in square feet/meter. |
| Computer Room Air Conditioner (CRAC) | It is a device used to monitor and maintain the temperature, air circulation, and humidity inside the server room in the data center. |
| Aisle | It is the open space between the rows of racks. This open space is critical for maintaining the optimal temperature (20-25 °C) in the server room. There are primarily two aisles inside the server room, a hot aisle and a cold aisle. |
| Cold Aisle | It is the aisle wherein the front of the rack faces the aisle. Here, chilled air is directed into the aisle so that it can enter the front of the racks and maintain the temperature. |
| Hot Aisle | It is the aisle where the back of the racks faces the aisle. Here, the heat dissipated from the equipment’s in the rack is directed to the outlet vent of the CRAC. |
| Critical Load | It includes the servers and other computer equipment whose uptime is critical for data center operation. |
| Power Usage Effectiveness (PUE) | It is a metric which defines the efficiency of a data center. It is calculated by: (𝑇𝑜𝑡𝑎𝑙 𝐷𝑎𝑡𝑎 𝐶𝑒𝑛𝑡𝑒𝑟 𝐸𝑛𝑒𝑟𝑔𝑦 𝐶𝑜𝑛𝑠𝑢𝑚𝑝𝑡𝑖𝑜𝑛)/(𝑇𝑜𝑡𝑎𝑙 𝐼𝑇 𝐸𝑞𝑢𝑖𝑝𝑚𝑒𝑛𝑡 𝐸𝑛𝑒𝑟𝑔𝑦 𝐶𝑜𝑛𝑠𝑢𝑚𝑝𝑡𝑖𝑜𝑛). Further, a data center with a PUE of 1.2-1.5 is considered highly efficient, whereas, a data center with a PUE >2 is considered highly inefficient. |
| Redundancy | It is defined as a system design wherein additional component (UPS, generators, CRAC) is added so that in case of power outage, equipment failure, the IT equipment should not be affected. |
| Uninterruptible Power Supply (UPS) | It is a device that is connected in series with the utility power supply, storing energy in batteries such that the supply from UPS is continuous to IT equipment even during utility power is snapped. The UPS primarily supports the IT equipment only. |
| Generators | Just like UPS, generators are placed in the data center to ensure an uninterrupted power supply, avoiding downtime. Data center facilities have diesel generators and commonly, 48-hour diesel is stored in the facility to prevent disruption. |
| N | It denotes the tools and equipment required for a data center to function at full load. Only "N" indicates that there is no backup to the equipment in the event of any failure. |
| N+1 | Referred to as 'Need plus one', it denotes the additional equipment setup available to avoid downtime in case of failure. A data center is considered N+1 when there is one additional unit for every 4 components. For instance, if a data center has 4 UPS systems, then for to achieve N+1, an additional UPS system would be required. |
| 2N | It refers to fully redundant design wherein two independent power distribution system is deployed. Therefore, in the event of a complete failure of one distribution system, the other system will still supply power to the data center. |
| In-Row Cooling | It is the cooling design system installed between racks in a row where it draws warm air from the hot aisle and supplies cool air to the cold aisle, thereby maintaining the temperature. |
| Tier 1 | Tier classification determines the preparedness of a data center facility to sustain data center operation. A data center is classified as Tier 1 data center when it has a non-redundant (N) power component (UPS, generators), cooling components, and power distribution system (from utility power grids). The Tier 1 data center has an uptime of 99.67% and an annual downtime of <28.8 hours. |
| Tier 2 | A data center is classified as Tier 2 data center when it has a redundant power and cooling components (N+1) and a single non-redundant distribution system. Redundant components include extra generators, UPS, chillers, heat rejection equipment, and fuel tanks. The Tier 2 data center has an uptime of 99.74% and an annual downtime of <22 hours. |
| Tier 3 | A data center having redundant power and cooling components and multiple power distribution systems is referred to as a Tier 3 data center. The facility is resistant to planned (facility maintenance) and unplanned (power outage, cooling failure) disruption. The Tier 3 data center has an uptime of 99.98% and an annual downtime of <1.6 hours. |
| Tier 4 | It is the most tolerant type of data center. A Tier 4 data center has multiple, independent redundant power and cooling components and multiple power distribution paths. All IT equipment are dual powered, making them fault tolerant in case of any disruption, thereby ensuring interrupted operation. The Tier 4 data center has an uptime of 99.74% and an annual downtime of <26.3 minutes. |
| Small Data Center | Data center that has floor space area of ≤ 5,000 Sq. ft or the number of racks that can be installed is ≤ 200 is classified as a small data center. |
| Medium Data Center | Data center which has floor space area between 5,001-20,000 Sq. ft, or the number of racks that can be installed is between 201-800, is classified as a medium data center. |
| Large Data Center | Data center which has floor space area between 20,001-75,000 Sq. ft, or the number of racks that can be installed is between 801-3,000, is classified as a large data center. |
| Massive Data Center | Data center which has floor space area between 75,001-225,000 Sq. ft, or the number of racks that can be installed is between 3001-9,000, is classified as a massive data center. |
| Mega Data Center | Data center that has a floor space area of ≥ 225,001 Sq. ft or the number of racks that can be installed is ≥ 9001 is classified as a mega data center. |
| Retail Colocation | It refers to those customers who have a capacity requirement of 250 kW or less. These services are majorly opted by small and medium enterprises (SMEs). |
| Wholesale Colocation | It refers to those customers who have a capacity requirement between 250 kW to 4 MW. These services are majorly opted by medium to large enterprises. |
| Hyperscale Colocation | It refers to those customers who have a capacity requirement greater than 4 MW. The hyperscale demand primarily originates from large-scale cloud players, IT companies, BFSI, and OTT players (like Netflix, Hulu, and HBO+). |
| Mobile Data Speed | It is the mobile internet speed a user experiences via their smartphones. This speed is primarily dependent on the carrier technology being used in the smartphone. The carrier technologies available in the market are 2G, 3G, 4G, and 5G, where 2G provides the slowest speed while 5G is the fastest. |
| Fiber Connectivity Network | It is a network of optical fiber cables deployed across the country, connecting rural and urban regions with high-speed internet connection. It is measured in kilometer (km). |
| Data Traffic per Smartphone | It is a measure of average data consumption by a smartphone user in a month. It is measured in gigabyte (GB). |
| Broadband Data Speed | It is the internet speed that is supplied over the fixed cable connection. Commonly, copper cable and optic fiber cable are used in both residential and commercial use. Here, optic cable fiber provides faster internet speed than copper cable. |
| Submarine Cable | A submarine cable is a fiber optic cable laid down at two or more landing points. Through this cable, communication and internet connectivity between countries across the globe is established. These cables can transmit 100-200 terabits per second (Tbps) from one point to another. |
| Carbon Footprint | It is the measure of carbon dioxide generated during the regular operation of a data center. Since, coal, and oil & gas are the primary source of power generation, consumption of this power contributes to carbon emissions. Data center operators are incorporating renewable energy sources to curb the carbon footprint emerging in their facilities. |
Need More Details on Market Definition?
Ask a Question
Research Methodology
Mordor Intelligence follows a four-step methodology in all our reports.
- Step-1: Identify Key Variables: In order to build a robust forecasting methodology, the variables and factors identified in Step-1 are tested against available historical market numbers. Through an iterative process, the variables required for market forecast are set and the model is built on the basis of these variables.
- Step-2: Build a Market Model: Market-size estimations for the forecast years are in nominal terms. Inflation is not a part of the pricing, and the average selling price (ASP) is kept constant throughout the forecast period for each country.
- Step-3: Validate and Finalize: In this important step, all market numbers, variables and analyst calls are validated through an extensive network of primary research experts from the market studied. The respondents are selected across levels and functions to generate a holistic picture of the market studied.
- Step-4: Research Outputs: Syndicated Reports, Custom Consulting Assignments, Databases & Subscription Platforms

Get More Details On Research Methodology
Download PDF


