
| Study Period | 2017 - 2030 |
| Base Year For Estimation | 2024 |
| Forecast Data Period | 2025 - 2030 |
| Market Size (2025) | USD 29.9 Billion |
| Market Size (2030) | USD 41.82 Billion |
| CAGR (2025 - 2030) | 6.94 % |
| Market Concentration | Medium |
Major Players*Disclaimer: Major Players sorted in no particular order |


India Dairy Market Analysis
The India Dairy Market size is estimated at 29.9 billion USD in 2025, and is expected to reach 41.82 billion USD by 2030, growing at a CAGR of 6.94% during the forecast period (2025-2030).
The dairy industry in India retail landscape is experiencing significant transformation, driven by the rapid expansion of organized retail channels and changing consumer preferences. Supermarkets and hypermarkets have emerged as the dominant distribution channel, accounting for 47.4% of the total value share in 2022, offering consumers a wide array of dairy products in India under one roof. The convenience store segment has also shown remarkable growth, with sales increasing by 6.2% in 2022 compared to the previous year, as urban consumers increasingly value accessibility and variety in their dairy products market purchases.
The digitalization of the dairy market retail is reshaping consumer purchasing patterns, supported by the country's growing digital infrastructure. By the end of 2022, India recorded 720 million internet users, with 692 million being active users split between rural (351 million) and urban (341 million) areas. This digital penetration has catalyzed the growth of online dairy market retail, with major platforms like Country Delight, Milkbasket, and DoorMilk expanding their presence across metropolitan regions and offering specialized dairy delivery services.
The food service sector is witnessing substantial growth in the growth of the dairy industry in India, particularly through quick-service restaurants (QSRs) and casual dining establishments. In 2022, India hosted 490 QSR brands, with 428 actively operational, indicating the robust growth of organized food service channels. This expansion is further evidenced by significant developments such as Domino's Pizza opening its 1,500th restaurant in Noida and Theobroma launching its first outlet in Chennai in October 2022, demonstrating the increasing penetration of organized food service chains across tier-1 and tier-2 cities.
Consumer preferences are evolving towards premium and specialized dairy products, driving innovation across the industry. Traditional dairy companies are expanding their product portfolios to include value-added products, while new entrants are focusing on niche segments such as organic and functional dairy products. The market has witnessed a significant shift in consumption patterns, with the milk market maintaining its position as the cornerstone of milk consumption in India, accounting for 67.4% of the total category in 2022, while yogurt has emerged as the second most popular category with an 18.2% value share, reflecting growing consumer interest in healthier dairy options.
India Dairy Market Trends
Growing health consciousness and increasing Western culture impact the consumption of dairy products
- In terms of consumption, India’s per capita milk consumption is estimated to increase by 2.12% during 2023-2024. Uttar Pradesh, Rajasthan, Gujarat, Maharashtra, and Bihar are the major states for the country’s dairy consumption.
- Increasing health-conscious consumers are moving toward milk and related products to supplement food with the nutrition required for the body. Most people consume milk with tea, coffee, shakes, or other drinks. About a third of the national population is under the age of 14, a group inclined to consume higher quantities of milk.
- With the adoption of Western culture and changing food habits, the demand for cheese has increased in India. Additionally, there’s a strong demand from the fast-food sector as well, where foreign food service is strategically expanding its presence. In 2021, India had 1,4095 Domino’s Pizza outlets, while it was 830 in 2014.
- Yogurt is referred to as curd in the country, and there is high consumption of plain yogurt as it is typically consumed as part of a meal or refreshment by the Indian population in their daily routine.
- Ice cream is a popular refreshment for Indians and is registering an increase in consumption every year. This upswing in demand is largely due to early summers and subsequent rises in temperatures, the availability of various flavors, and the opening of ice cream parlors. Baskin Robbins currently operates more than 800 exclusive ice cream parlous across over 230 cities, making it one of the largest exclusive ice cream retail chains in India. Eventually, the production also increased to suffice the growing consumption of ice cream. India produced more than 200 million liters of ice cream in 2020. This was a significant increase from 2015.

Understand The Key Trends Shaping This Market
Download PDF
OTHER KEY INDUSTRY TRENDS COVERED IN THE REPORT
- Rising demand for butter in international markets leading to the growth in the production of butter
- Changing weather conditions, coupled with fodder and grain prices, largely impact the production of milk in the country
- Support from government agencies drives the market
Segment Analysis: Category
Milk Segment in Indian Dairy Market
The milk segment continues to dominate the Indian dairy products market, holding approximately 61% milk market share in 2024, making it the largest category in the sector. This commanding position is primarily attributed to milk being a dietary staple in Indian households and its versatile usage in various food preparations. The segment's growth is substantially supported by government initiatives such as the National Programme for Dairy Development (NPDD) and Dairy Entrepreneurship Development Scheme (DEDS), which focus on enhancing milk production and quality. The segment's robust performance is further strengthened by the increasing adoption of modern retail channels and the rising demand for value-added milk products in urban areas. Additionally, the emergence of organized retail chains and the implementation of stringent quality standards have helped maintain consumer trust in packaged milk products.
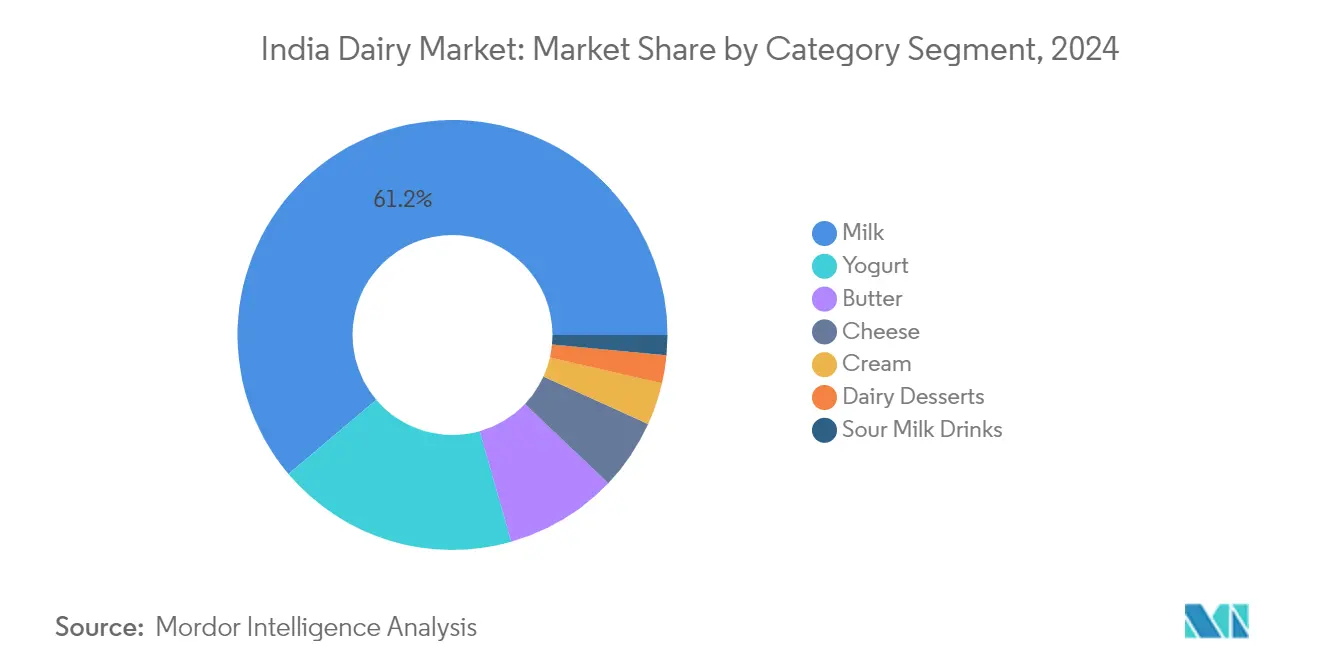
Yogurt Segment in Indian Dairy Market
The yogurt segment is emerging as the most dynamic category in the Indian dairy products industry, projected to grow at an impressive rate of approximately 12% during 2024-2029. This remarkable growth trajectory is driven by increasing health consciousness among Indian consumers and the rising preference for probiotic dairy products. The segment's expansion is further fueled by product innovations, particularly in flavored and functional yogurt varieties, along with the introduction of convenient packaging formats. Major dairy companies are investing significantly in yogurt production facilities and launching new product variants to capitalize on this growing demand. The segment is also benefiting from the increasing adoption of yogurt as a healthy snacking option and its integration into various culinary applications, particularly in urban households.
Remaining Segments in Category
The Indian dairy market encompasses several other significant segments, including butter, cheese, cream, dairy desserts, and sour milk drinks, each serving distinct consumer needs and preferences. The butter segment maintains its importance in Indian cooking and traditional food preparation, while cheese is gaining prominence due to the westernization of food habits and growing quick-service restaurant chains. The cream segment serves both household and commercial requirements, particularly in the food service sector. Dairy desserts are experiencing growth due to increasing disposable income and changing consumer preferences, especially in urban areas. Sour milk drinks maintain their traditional significance in Indian dietary habits, particularly during summer months. These segments collectively contribute to the market's diversity and cater to evolving consumer preferences across different regions of India.
Segment Analysis: Distribution Channel
Off-Trade Segment in India Dairy Market
The off-trade distribution channel dominates the Indian dairy products market, commanding approximately 91% dairy market share in 2024, driven by the extensive network of retail outlets across the country. This segment encompasses various retail formats, including supermarkets, hypermarkets, convenience stores, specialist retailers, and online platforms. Supermarkets and hypermarkets lead the off-trade channel, accounting for nearly 48% of dairy product sales, offering a wide assortment of products with dedicated shelf space for different dairy categories. The segment's growth is further propelled by the rising penetration of organized retail, with major chains like DMart, Reliance Retail, and SPAR India continuously expanding their presence. The convenience of product selection, competitive pricing strategies, and the availability of private label brands have made off-trade channels the preferred choice for consumers. Additionally, the emergence of online grocery platforms and specialty dairy stores has enhanced the accessibility of dairy products, particularly in urban areas. The off-trade segment is projected to maintain its market leadership while growing at approximately 7% annually from 2024 to 2029, supported by increasing urbanization and evolving consumer shopping preferences.
India Dairy Industry Overview
Top Companies in India Dairy Market
The Indian dairy market is characterized by intense competition among major dairy companies in India, who are actively pursuing growth through various strategic initiatives. Companies are heavily focused on product innovations, particularly in developing new flavors and variants across categories like yogurt, ice cream, and flavored milk to cater to evolving consumer preferences. Operational agility is demonstrated through investments in modern manufacturing facilities and cold chain infrastructure, enabling efficient production and distribution networks. Strategic moves in the sector primarily revolve around expanding production capacities, strengthening direct procurement relationships with farmers, and enhancing distribution networks through both traditional and digital channels. Market leaders are also emphasizing geographical expansion by establishing new manufacturing units across different states and increasing their retail presence through exclusive brand outlets and partnerships with modern retail chains.
Local Players Dominate Fragmented Dairy Market
The Indian dairy market exhibits a unique competitive structure where domestic cooperatives and local players hold significant market share among dairy companies in India alongside established private companies. The market is notably fragmented with a mix of large cooperative federations like Gujarat Cooperative Milk Marketing Federation (Amul) and Karnataka Cooperative Milk Producers Federation, alongside private players such as Nestlé, Mother Dairy, and numerous regional dairy brands in India. These organizations leverage their strong local procurement networks and deep understanding of regional preferences to maintain their market positions. The cooperative model, in particular, has proven highly successful in India's dairy sector, creating robust farmer networks and ensuring stable milk supply chains.
The market has witnessed increasing consolidation through strategic acquisitions and partnerships, particularly as companies seek to expand their geographical presence and product portfolios. Private players are actively acquiring regional dairy companies to gain instant access to established procurement networks and distribution channels. Meanwhile, cooperative federations are strengthening their positions through backward integration and farmer engagement programs. The competitive landscape is further shaped by the entry of new private players who are introducing value-added products and innovative packaging solutions to differentiate themselves in the market.
Innovation and Distribution Key to Growth
Success in the Indian dairy market increasingly depends on companies' ability to innovate across product categories while maintaining efficient distribution networks. Market leaders are focusing on developing premium products with health benefits, clean labels, and innovative flavors to capture higher-value market segments. Companies are also investing in cold chain infrastructure and direct procurement models to ensure product quality and supply chain efficiency. The adoption of digital technologies for both procurement and distribution is becoming crucial, with successful players leveraging e-commerce platforms and direct-to-consumer models to reach urban consumers.
Future growth opportunities lie in expanding product portfolios to include value-added dairy products and functional foods that cater to health-conscious consumers. Companies need to focus on building strong brands through quality consistency and innovative marketing strategies. The regulatory environment is becoming more stringent regarding quality standards and food safety, requiring companies to invest in quality control systems and certifications. Success also depends on managing raw material costs through efficient procurement strategies and maintaining strong relationships with dairy farmers. Companies that can balance product innovation with operational efficiency while maintaining strong distribution networks are likely to gain market share in this competitive landscape.
India Dairy Market Leaders
-
Gujarat Cooperative Milk Marketing Federation Ltd
-
Karnataka Cooperative Milk Producers Federation Ltd
-
Mother Dairy Fruit & Vegetable Pvt. Ltd
-
Rajasthan Co-operative Dairy Federation Ltd
-
Tamil Nadu Cooperative Milk Producers Federation Ltd
- *Disclaimer: Major Players sorted in no particular order

Need More Details on Market Players and Competiters?
Download PDF
India Dairy Market News
- July 2022: Amul announced an investment of USD 60.57 million to build a new dairy plant in Rajkot to expand its production capabilities across milk, yogurt, and buttermilk products.
- May 2022: Amul launched Isabcool flavor ice cream. It contains psyllium husk, which helps in proper digestion.
- March 2022: Dodla Dairy Ltd acquired Sri Krishna Milks for INR 50 crore. The acquisition aimed to expand the company's business.
Free With This Report
We provide a comprehensive and exhaustive set of data pointers for global, regional, and country-level metrics that illustrate the fundamentals of the dairy industry. With the help of 45+ free charts, clients can access in-depth market analysis based on per capita consumption numbers and production data of raw materials for dairy, through granular-level segmental information supported by a repository of market data, trends, and expert analysis. Data and analysis on dairy, categories of dairy products, product types, etc., are available in the form of comprehensive reports as well as excel based data worksheets.


India Dairy Market Report - Table of Contents
1. EXECUTIVE SUMMARY & KEY FINDINGS
2. REPORT OFFERS
3. INTRODUCTION
- 3.1 Study Assumptions & Market Definition
- 3.2 Scope of the Study
- 3.3 Research Methodology
4. KEY INDUSTRY TRENDS
- 4.1 Per Capita Consumption
-
4.2 Raw Material/commodity Production
- 4.2.1 Butter
- 4.2.2 Cheese
- 4.2.3 Milk
-
4.3 Regulatory Framework
- 4.3.1 India
- 4.4 Value Chain & Distribution Channel Analysis
5. MARKET SEGMENTATION (includes market size in Value in USD and Volume, Forecasts up to 2030 and analysis of growth prospects)
-
5.1 Category
- 5.1.1 Butter
- 5.1.1.1 By Product Type
- 5.1.1.1.1 Cultured Butter
- 5.1.1.1.2 Uncultured Butter
- 5.1.2 Cheese
- 5.1.2.1 By Product Type
- 5.1.2.1.1 Natural Cheese
- 5.1.2.1.2 Processed Cheese
- 5.1.3 Cream
- 5.1.3.1 By Product Type
- 5.1.3.1.1 Double Cream
- 5.1.3.1.2 Single Cream
- 5.1.3.1.3 Whipping Cream
- 5.1.3.1.4 Others
- 5.1.4 Dairy Desserts
- 5.1.4.1 By Product Type
- 5.1.4.1.1 Cheesecakes
- 5.1.4.1.2 Frozen Desserts
- 5.1.4.1.3 Ice Cream
- 5.1.4.1.4 Mousses
- 5.1.4.1.5 Others
- 5.1.5 Milk
- 5.1.5.1 By Product Type
- 5.1.5.1.1 Condensed milk
- 5.1.5.1.2 Flavored Milk
- 5.1.5.1.3 Fresh Milk
- 5.1.5.1.4 Powdered Milk
- 5.1.5.1.5 UHT Milk
- 5.1.6 Sour Milk Drinks
- 5.1.7 Yogurt
- 5.1.7.1 By Product Type
- 5.1.7.1.1 Flavored Yogurt
- 5.1.7.1.2 Unflavored Yogurt
-
5.2 Distribution Channel
- 5.2.1 Off-Trade
- 5.2.1.1 Convenience Stores
- 5.2.1.2 Online Retail
- 5.2.1.3 Specialist Retailers
- 5.2.1.4 Supermarkets and Hypermarkets
- 5.2.1.5 Others (Warehouse clubs, gas stations, etc.)
- 5.2.2 On-Trade
6. COMPETITIVE LANDSCAPE
- 6.1 Key Strategic Moves
- 6.2 Market Share Analysis
- 6.3 Company Landscape
-
6.4 Company Profiles (includes Global Level Overview, Market Level Overview, Core Business Segments, Financials, Headcount, Key Information, Market Rank, Market Share, Products and Services, and Analysis of Recent Developments).
- 6.4.1 Britannia Industries
- 6.4.2 Dodla Dairy Ltd
- 6.4.3 Gujarat Cooperative Milk Marketing Federation Ltd
- 6.4.4 Hatsun Agro Product Ltd
- 6.4.5 Karnataka Cooperative Milk Producers Federation Ltd
- 6.4.6 Mother Dairy Fruit & Vegetable Pvt. Ltd
- 6.4.7 Nestlé SA
- 6.4.8 Parag Milk Foods Ltd
- 6.4.9 Rajasthan Co-operative Dairy Federation Ltd
- 6.4.10 Tamil Nadu Cooperative Milk Producers Federation Ltd
7. KEY STRATEGIC QUESTIONS FOR DAIRY AND DAIRY ALTERNATIVE CEOS
8. APPENDIX
-
8.1 Global Overview
- 8.1.1 Overview
- 8.1.2 Porter’s Five Forces Framework
- 8.1.3 Global Value Chain Analysis
- 8.1.4 Market Dynamics (DROs)
- 8.2 Sources & References
- 8.3 List of Tables & Figures
- 8.4 Primary Insights
- 8.5 Data Pack
- 8.6 Glossary of Terms
You Can Purchase Parts Of This Report. Check Out Prices For Specific Sections
Get Price Break-up Now
List of Tables & Figures
- Figure 1:
- PER CAPITA CONSUMPTION OF MILK, BUTTER, CHEESE, KG, INDIA, 2017 - 2029
- Figure 2:
- PRODUCTION OF BUTTER, METRIC TONNES, INDIA, 2017 - 2021
- Figure 3:
- PRODUCTION OF CHEESE, METRIC TONNES, INDIA, 2017 - 2021
- Figure 4:
- PRODUCTION OF MILK, METRIC TONNES, INDIA, 2017 - 2021
- Figure 5:
- VOLUME OF DAIRY, METRIC TONNES, BY INDIA, 2017 - 2029
- Figure 6:
- VALUE OF DAIRY, USD MN, BY INDIA, 2017 - 2029
- Figure 7:
- VOLUME OF DAIRY MARKET BY CATEGORY, METRIC TONNES, INDIA, 2017 - 2029
- Figure 8:
- VALUE OF DAIRY MARKET BY CATEGORY, USD MN, INDIA, 2017 - 2029
- Figure 9:
- VOLUME SHARE OF DAIRY MARKET, BY CATEGORY , %, INDIA, 2017 VS 2023 VS 2029
- Figure 10:
- VALUE SHARE OF DAIRY MARKET, BY CATEGORY , %, INDIA, 2017 VS 2023 VS 2029
- Figure 11:
- VOLUME OF BUTTER MARKET BY PRODUCT TYPE, METRIC TONNES, INDIA, 2017 - 2029
- Figure 12:
- VALUE OF BUTTER MARKET BY PRODUCT TYPE, USD MN, INDIA, 2017 - 2029
- Figure 13:
- VOLUME SHARE OF BUTTER MARKET BY PRODUCT TYPE, %, INDIA, 2017 VS 2023 VS 2029
- Figure 14:
- VALUE SHARE OF BUTTER MARKET BY PRODUCT TYPE, %, INDIA, 2017 VS 2023 VS 2029
- Figure 15:
- VOLUME OF CULTURED BUTTER MARKET, METRIC TONNES, INDIA, 2017 - 2029
- Figure 16:
- VALUE OF CULTURED BUTTER MARKET, USD MN, INDIA, 2017 - 2029
- Figure 17:
- VALUE SHARE OF CULTURED BUTTER MARKET, BY DISTRIBUTION CHANNEL , %, INDIA, 2022 VS 2029
- Figure 18:
- VOLUME OF UNCULTURED BUTTER MARKET, METRIC TONNES, INDIA, 2017 - 2029
- Figure 19:
- VALUE OF UNCULTURED BUTTER MARKET, USD MN, INDIA, 2017 - 2029
- Figure 20:
- VALUE SHARE OF UNCULTURED BUTTER MARKET, BY DISTRIBUTION CHANNEL , %, INDIA, 2022 VS 2029
- Figure 21:
- VOLUME OF CHEESE MARKET BY PRODUCT TYPE, METRIC TONNES, INDIA, 2017 - 2029
- Figure 22:
- VALUE OF CHEESE MARKET BY PRODUCT TYPE, USD MN, INDIA, 2017 - 2029
- Figure 23:
- VOLUME SHARE OF CHEESE MARKET BY PRODUCT TYPE, %, INDIA, 2017 VS 2023 VS 2029
- Figure 24:
- VALUE SHARE OF CHEESE MARKET BY PRODUCT TYPE, %, INDIA, 2017 VS 2023 VS 2029
- Figure 25:
- VOLUME OF NATURAL CHEESE MARKET, METRIC TONNES, INDIA, 2017 - 2029
- Figure 26:
- VALUE OF NATURAL CHEESE MARKET, USD MN, INDIA, 2017 - 2029
- Figure 27:
- VALUE SHARE OF NATURAL CHEESE MARKET, BY DISTRIBUTION CHANNEL , %, INDIA, 2022 VS 2029
- Figure 28:
- VOLUME OF PROCESSED CHEESE MARKET, METRIC TONNES, INDIA, 2017 - 2029
- Figure 29:
- VALUE OF PROCESSED CHEESE MARKET, USD MN, INDIA, 2017 - 2029
- Figure 30:
- VALUE SHARE OF PROCESSED CHEESE MARKET, BY DISTRIBUTION CHANNEL , %, INDIA, 2022 VS 2029
- Figure 31:
- VOLUME OF CREAM MARKET BY PRODUCT TYPE, METRIC TONNES, INDIA, 2017 - 2029
- Figure 32:
- VALUE OF CREAM MARKET BY PRODUCT TYPE, USD MN, INDIA, 2017 - 2029
- Figure 33:
- VOLUME SHARE OF CREAM MARKET BY PRODUCT TYPE, %, INDIA, 2017 VS 2023 VS 2029
- Figure 34:
- VALUE SHARE OF CREAM MARKET BY PRODUCT TYPE, %, INDIA, 2017 VS 2023 VS 2029
- Figure 35:
- VOLUME OF DOUBLE CREAM MARKET, METRIC TONNES, INDIA, 2017 - 2029
- Figure 36:
- VALUE OF DOUBLE CREAM MARKET, USD MN, INDIA, 2017 - 2029
- Figure 37:
- VALUE SHARE OF DOUBLE CREAM MARKET, BY DISTRIBUTION CHANNEL , %, INDIA, 2022 VS 2029
- Figure 38:
- VOLUME OF SINGLE CREAM MARKET, METRIC TONNES, INDIA, 2017 - 2029
- Figure 39:
- VALUE OF SINGLE CREAM MARKET, USD MN, INDIA, 2017 - 2029
- Figure 40:
- VALUE SHARE OF SINGLE CREAM MARKET, BY DISTRIBUTION CHANNEL , %, INDIA, 2022 VS 2029
- Figure 41:
- VOLUME OF WHIPPING CREAM MARKET, METRIC TONNES, INDIA, 2017 - 2029
- Figure 42:
- VALUE OF WHIPPING CREAM MARKET, USD MN, INDIA, 2017 - 2029
- Figure 43:
- VALUE SHARE OF WHIPPING CREAM MARKET, BY DISTRIBUTION CHANNEL , %, INDIA, 2022 VS 2029
- Figure 44:
- VOLUME OF OTHERS MARKET, METRIC TONNES, INDIA, 2017 - 2029
- Figure 45:
- VALUE OF OTHERS MARKET, USD MN, INDIA, 2017 - 2029
- Figure 46:
- VALUE SHARE OF OTHERS MARKET, BY DISTRIBUTION CHANNEL , %, INDIA, 2022 VS 2029
- Figure 47:
- VOLUME OF DAIRY DESSERTS MARKET BY PRODUCT TYPE, METRIC TONNES, INDIA, 2017 - 2029
- Figure 48:
- VALUE OF DAIRY DESSERTS MARKET BY PRODUCT TYPE, USD MN, INDIA, 2017 - 2029
- Figure 49:
- VOLUME SHARE OF DAIRY DESSERTS MARKET BY PRODUCT TYPE, %, INDIA, 2017 VS 2023 VS 2029
- Figure 50:
- VALUE SHARE OF DAIRY DESSERTS MARKET BY PRODUCT TYPE, %, INDIA, 2017 VS 2023 VS 2029
- Figure 51:
- VOLUME OF CHEESECAKES MARKET, METRIC TONNES, INDIA, 2017 - 2029
- Figure 52:
- VALUE OF CHEESECAKES MARKET, USD MN, INDIA, 2017 - 2029
- Figure 53:
- VALUE SHARE OF CHEESECAKES MARKET, BY DISTRIBUTION CHANNEL , %, INDIA, 2022 VS 2029
- Figure 54:
- VOLUME OF FROZEN DESSERTS MARKET, METRIC TONNES, INDIA, 2017 - 2029
- Figure 55:
- VALUE OF FROZEN DESSERTS MARKET, USD MN, INDIA, 2017 - 2029
- Figure 56:
- VALUE SHARE OF FROZEN DESSERTS MARKET, BY DISTRIBUTION CHANNEL , %, INDIA, 2022 VS 2029
- Figure 57:
- VOLUME OF ICE CREAM MARKET, METRIC TONNES, INDIA, 2017 - 2029
- Figure 58:
- VALUE OF ICE CREAM MARKET, USD MN, INDIA, 2017 - 2029
- Figure 59:
- VALUE SHARE OF ICE CREAM MARKET, BY DISTRIBUTION CHANNEL , %, INDIA, 2022 VS 2029
- Figure 60:
- VOLUME OF MOUSSES MARKET, METRIC TONNES, INDIA, 2017 - 2029
- Figure 61:
- VALUE OF MOUSSES MARKET, USD MN, INDIA, 2017 - 2029
- Figure 62:
- VALUE SHARE OF MOUSSES MARKET, BY DISTRIBUTION CHANNEL , %, INDIA, 2022 VS 2029
- Figure 63:
- VOLUME OF OTHERS MARKET, METRIC TONNES, INDIA, 2017 - 2029
- Figure 64:
- VALUE OF OTHERS MARKET, USD MN, INDIA, 2017 - 2029
- Figure 65:
- VALUE SHARE OF OTHERS MARKET, BY DISTRIBUTION CHANNEL , %, INDIA, 2022 VS 2029
- Figure 66:
- VOLUME OF MILK MARKET BY PRODUCT TYPE, METRIC TONNES, INDIA, 2017 - 2029
- Figure 67:
- VALUE OF MILK MARKET BY PRODUCT TYPE, USD MN, INDIA, 2017 - 2029
- Figure 68:
- VOLUME SHARE OF MILK MARKET BY PRODUCT TYPE, %, INDIA, 2017 VS 2023 VS 2029
- Figure 69:
- VALUE SHARE OF MILK MARKET BY PRODUCT TYPE, %, INDIA, 2017 VS 2023 VS 2029
- Figure 70:
- VOLUME OF CONDENSED MILK MARKET, METRIC TONNES, INDIA, 2017 - 2029
- Figure 71:
- VALUE OF CONDENSED MILK MARKET, USD MN, INDIA, 2017 - 2029
- Figure 72:
- VALUE SHARE OF CONDENSED MILK MARKET, BY DISTRIBUTION CHANNEL , %, INDIA, 2022 VS 2029
- Figure 73:
- VOLUME OF FLAVORED MILK MARKET, METRIC TONNES, INDIA, 2017 - 2029
- Figure 74:
- VALUE OF FLAVORED MILK MARKET, USD MN, INDIA, 2017 - 2029
- Figure 75:
- VALUE SHARE OF FLAVORED MILK MARKET, BY DISTRIBUTION CHANNEL , %, INDIA, 2022 VS 2029
- Figure 76:
- VOLUME OF FRESH MILK MARKET, METRIC TONNES, INDIA, 2017 - 2029
- Figure 77:
- VALUE OF FRESH MILK MARKET, USD MN, INDIA, 2017 - 2029
- Figure 78:
- VALUE SHARE OF FRESH MILK MARKET, BY DISTRIBUTION CHANNEL , %, INDIA, 2022 VS 2029
- Figure 79:
- VOLUME OF POWDERED MILK MARKET, METRIC TONNES, INDIA, 2017 - 2029
- Figure 80:
- VALUE OF POWDERED MILK MARKET, USD MN, INDIA, 2017 - 2029
- Figure 81:
- VALUE SHARE OF POWDERED MILK MARKET, BY DISTRIBUTION CHANNEL , %, INDIA, 2022 VS 2029
- Figure 82:
- VOLUME OF UHT MILK MARKET, METRIC TONNES, INDIA, 2017 - 2029
- Figure 83:
- VALUE OF UHT MILK MARKET, USD MN, INDIA, 2017 - 2029
- Figure 84:
- VALUE SHARE OF UHT MILK MARKET, BY DISTRIBUTION CHANNEL , %, INDIA, 2022 VS 2029
- Figure 85:
- VOLUME OF SOUR MILK DRINKS MARKET, METRIC TONNES, INDIA, 2017 - 2029
- Figure 86:
- VALUE OF SOUR MILK DRINKS MARKET, USD MN, INDIA, 2017 - 2029
- Figure 87:
- VALUE SHARE OF SOUR MILK DRINKS MARKET, BY DISTRIBUTION CHANNEL , %, INDIA, 2022 VS 2029
- Figure 88:
- VOLUME OF YOGURT MARKET BY PRODUCT TYPE, METRIC TONNES, INDIA, 2017 - 2029
- Figure 89:
- VALUE OF YOGURT MARKET BY PRODUCT TYPE, USD MN, INDIA, 2017 - 2029
- Figure 90:
- VOLUME SHARE OF YOGURT MARKET BY PRODUCT TYPE, %, INDIA, 2017 VS 2023 VS 2029
- Figure 91:
- VALUE SHARE OF YOGURT MARKET BY PRODUCT TYPE, %, INDIA, 2017 VS 2023 VS 2029
- Figure 92:
- VOLUME OF FLAVORED YOGURT MARKET, METRIC TONNES, INDIA, 2017 - 2029
- Figure 93:
- VALUE OF FLAVORED YOGURT MARKET, USD MN, INDIA, 2017 - 2029
- Figure 94:
- VALUE SHARE OF FLAVORED YOGURT MARKET, BY DISTRIBUTION CHANNEL , %, INDIA, 2022 VS 2029
- Figure 95:
- VOLUME OF UNFLAVORED YOGURT MARKET, METRIC TONNES, INDIA, 2017 - 2029
- Figure 96:
- VALUE OF UNFLAVORED YOGURT MARKET, USD MN, INDIA, 2017 - 2029
- Figure 97:
- VALUE SHARE OF UNFLAVORED YOGURT MARKET, BY DISTRIBUTION CHANNEL , %, INDIA, 2022 VS 2029
- Figure 98:
- VOLUME OF DAIRY MARKET BY DISTRIBUTION CHANNEL, METRIC TONNES, INDIA, 2017 - 2029
- Figure 99:
- VALUE OF DAIRY MARKET BY DISTRIBUTION CHANNEL, USD MN, INDIA, 2017 - 2029
- Figure 100:
- VOLUME SHARE OF DAIRY MARKET, BY DISTRIBUTION CHANNEL , %, INDIA, 2017 VS 2023 VS 2029
- Figure 101:
- VALUE SHARE OF DAIRY MARKET, BY DISTRIBUTION CHANNEL , %, INDIA, 2017 VS 2023 VS 2029
- Figure 102:
- VOLUME OF DAIRY MARKET BY SUB DISTRIBUTION CHANNELS, METRIC TONNES, INDIA, 2017 - 2029
- Figure 103:
- VALUE OF DAIRY MARKET BY SUB DISTRIBUTION CHANNELS, USD MN, INDIA, 2017 - 2029
- Figure 104:
- VOLUME SHARE OF DAIRY MARKET, BY SUB DISTRIBUTION CHANNELS , %, INDIA, 2017 VS 2023 VS 2029
- Figure 105:
- VALUE SHARE OF DAIRY MARKET, BY SUB DISTRIBUTION CHANNELS , %, INDIA, 2017 VS 2023 VS 2029
- Figure 106:
- VOLUME OF DAIRY MARKET SOLD VIA CONVENIENCE STORES, METRIC TONNES, INDIA, 2017 - 2029
- Figure 107:
- VALUE OF DAIRY MARKET SOLD VIA CONVENIENCE STORES, USD MN, INDIA, 2017 - 2029
- Figure 108:
- VALUE SHARE OF DAIRY MARKET, SOLD VIA CONVENIENCE STORES, BY CATEGORY , %, INDIA, 2022 VS 2029
- Figure 109:
- VOLUME OF DAIRY MARKET SOLD VIA ONLINE RETAIL, METRIC TONNES, INDIA, 2017 - 2029
- Figure 110:
- VALUE OF DAIRY MARKET SOLD VIA ONLINE RETAIL, USD MN, INDIA, 2017 - 2029
- Figure 111:
- VALUE SHARE OF DAIRY MARKET, SOLD VIA ONLINE RETAIL, BY CATEGORY , %, INDIA, 2022 VS 2029
- Figure 112:
- VOLUME OF DAIRY MARKET SOLD VIA SPECIALIST RETAILERS, METRIC TONNES, INDIA, 2017 - 2029
- Figure 113:
- VALUE OF DAIRY MARKET SOLD VIA SPECIALIST RETAILERS, USD MN, INDIA, 2017 - 2029
- Figure 114:
- VALUE SHARE OF DAIRY MARKET, SOLD VIA SPECIALIST RETAILERS, BY CATEGORY , %, INDIA, 2022 VS 2029
- Figure 115:
- VOLUME OF DAIRY MARKET SOLD VIA SUPERMARKETS AND HYPERMARKETS, METRIC TONNES, INDIA, 2017 - 2029
- Figure 116:
- VALUE OF DAIRY MARKET SOLD VIA SUPERMARKETS AND HYPERMARKETS, USD MN, INDIA, 2017 - 2029
- Figure 117:
- VALUE SHARE OF DAIRY MARKET, SOLD VIA SUPERMARKETS AND HYPERMARKETS, BY CATEGORY , %, INDIA, 2022 VS 2029
- Figure 118:
- VOLUME OF DAIRY MARKET SOLD VIA OTHERS (WAREHOUSE CLUBS, GAS STATIONS, ETC.), METRIC TONNES, INDIA, 2017 - 2029
- Figure 119:
- VALUE OF DAIRY MARKET SOLD VIA OTHERS (WAREHOUSE CLUBS, GAS STATIONS, ETC.), USD MN, INDIA, 2017 - 2029
- Figure 120:
- VALUE SHARE OF DAIRY MARKET, SOLD VIA OTHERS (WAREHOUSE CLUBS, GAS STATIONS, ETC.), BY CATEGORY , %, INDIA, 2022 VS 2029
- Figure 121:
- VOLUME OF DAIRY MARKET SOLD VIA ON-TRADE, METRIC TONNES, INDIA, 2017 - 2029
- Figure 122:
- VALUE OF DAIRY MARKET SOLD VIA ON-TRADE, USD MN, INDIA, 2017 - 2029
- Figure 123:
- VALUE SHARE OF DAIRY MARKET, SOLD VIA ON-TRADE, BY CATEGORY , %, INDIA, 2022 VS 2029
- Figure 124:
- MOST ACTIVE COMPANIES BY NUMBER OF STRATEGIC MOVES, COUNT, INDIA, 2017 - 2029
- Figure 125:
- MOST ADOPTED STRATEGIES, COUNT, INDIA, 2017 - 2029
- Figure 126:
- VALUE SHARE OF MAJOR PLAYERS, %, INDIA
India Dairy Industry Segmentation
Butter, Cheese, Cream, Dairy Desserts, Milk, Sour Milk Drinks, Yogurt are covered as segments by Category. Off-Trade, On-Trade are covered as segments by Distribution Channel.| Category | Butter | By Product Type | Cultured Butter | |
| Uncultured Butter | ||||
| Cheese | By Product Type | Natural Cheese | ||
| Processed Cheese | ||||
| Cream | By Product Type | Double Cream | ||
| Single Cream | ||||
| Whipping Cream | ||||
| Others | ||||
| Dairy Desserts | By Product Type | Cheesecakes | ||
| Frozen Desserts | ||||
| Ice Cream | ||||
| Mousses | ||||
| Others | ||||
| Milk | By Product Type | Condensed milk | ||
| Flavored Milk | ||||
| Fresh Milk | ||||
| Powdered Milk | ||||
| UHT Milk | ||||
| Sour Milk Drinks | ||||
| Yogurt | By Product Type | Flavored Yogurt | ||
| Unflavored Yogurt | ||||
| Distribution Channel | Off-Trade | Convenience Stores | ||
| Online Retail | ||||
| Specialist Retailers | ||||
| Supermarkets and Hypermarkets | ||||
| Others (Warehouse clubs, gas stations, etc.) | ||||
| On-Trade | ||||
Need A Different Region or Segment?
Customize Now
Market Definition
- Butter - Butter is a yellow-to-white solid emulsion of fat globules, water, and inorganic salts produced by churning the cream from cows’ milk
- Dairy - Dairy product include milk and any of the foods made from milk, including butter, cheese, ice cream, yogurt, and condensed and dried milk.
- Frozen Desserts - Frozen dairy dessert means and includes products containing milk or cream and other ingredients which are frozen or semi-frozen prior to consumption, such as ice milk or sherbet, including frozen dairy desserts for special dietary purposes, and sorbet
- Sour Milk Drinks - Sour milk is thick, curdled milk, with a sour taste, obtained from the fermentation of milk. Sour milk drinks such as kefir, laban, buttermilk have been considered in the study
| Keyword | Definition |
|---|---|
| Cultured Butter | Cultured butter is prepared by having the raw butter go through chemical processing and has been added with certain emulsifiers and foreign ingredients. |
| Uncultured Butter | This type of butter is one which has not been processed in any way |
| Natural Cheese | The type of cheese in its most natural form. It is made from natural and simple products and ingredients, including fresh and natural salts, natural colors, enzymes, and high-quality milk. |
| Processed Cheese | Processed cheese undergoes the same processes as natural cheese; however, it requires more steps and many different forms of ingredients. Making processed cheese involves melting natural cheese, emulsifying it, and adding preservatives and other artificial ingredients or colorings. |
| Single Cream | Single cream contains around 18% fat. It’s a single layer of cream that appears over boiled milk. |
| Double Cream | Double cream contains 48% fat, more than double the amount of fat of single cream. It’s heavier and thicker than single cream |
| Whipping Cream | This has a much higher fat percentage than single cream (36%). Used to top cakes, pies, and puddings and as a thickener for sauces, soups, and fillings. |
| Frozen Desserts | Desserts that are meant to be eaten in frozen condition. E.g., sherbets, sorbets, frozen yogurts |
| UHT Milk (Ultra-high temperature milk) | Milk heated at a very high temperature. Ultra-high-temperature processing (UHT) of milk involves heating for 1–8 sec at 135–154°C. which kills the spore-forming pathogenic microorganism, resulting in a product with a shelf-life of several months. |
| Non-dairy butter/Plant-based butter | Butter made from plant-derived oil such as coconut, palm, etc. |
| Non-dairy Yogurt | Yogurt made from typically made from nuts, like almonds, cashews, coconuts, and even other foods like soybeans, plantains, oats, and peas |
| On-trade | It refers to restaurants, QSRs, and bars. |
| Off-trade | It refers to supermarkets, hypermarkets, on-line channels, etc. |
| Neufchatel cheese | One of the oldest kinds of cheese in France. It is a soft, slightly crumbly, mold-ripened, bloomy-rind cheese made in the Neufchâtel-en-Bray region of Normandy. |
| Flexitarian | It refers to a consumer preferring a semi-vegetarian diet, that is centered on plant foods with limited or occasional inclusion of meat. |
| Lactose Intolerance | Lactose intolerance is a reaction in digestive system to lactose, the sugar in milk. It causes uncomfortable symptoms in response to the consumption of dairy products. |
| Cream Cheese | Cream cheese is a soft and creamy fresh cheese with a tangy taste made from milk and cream. |
| Sorbets | Sorbet is a frozen dessert made using ice combined with fruit juice, fruit purée, or other ingredients, such as wine, liqueur, or honey. |
| Sherbet | Sherbet is a sweetened frozen dessert made with fruit and some sort of dairy product such as milk or cream. |
| Shelf stable | Foods that can be safely stored at room temperature, or "on the shelf," for at least one year and do not have to be cooked or refrigerated to eat safely. |
| DSD | Direct Store Delivery is the process in supply chain management wherein the product is delivered from manufacturing plant directly to the retailer. |
| OU Kosher | Orthodox Union Kosher is a kosher certification agency based in New York City. |
| Gelato | Gelato is a frozen creamy dessert made with milk, heavy cream and sugar. |
| Grass-fed Cows | Grass-fed cows are allowed to graze in pastures, where they eat a variety of grasses and clover. |
Need More Details on Market Definition?
Ask a Question
Research Methodology
Mordor Intelligence follows a four-step methodology in all our reports.
- Step-1: Identify Key Variables: In order to build a robust forecasting methodology, the variables and factors identified in Step 1 are tested against available historical market numbers. Through an iterative process, the variables required for market forecast are set, and the model is built on the basis of these variables.
- Step-2: Build a Market Model: Market-size estimations for the forecast years are in nominal terms. Inflation is not a part of the pricing, and the average selling price (ASP) is kept constant throughout the forecast period for each country.
- Step-3: Validate and Finalize: In this important step, all market numbers, variables, and analyst calls are validated through an extensive network of primary research experts from the market studied. The respondents are selected across levels and functions to generate a holistic picture of the market studied.
- Step-4: Research Outputs: Syndicated Reports, Custom Consulting Assignments, Databases & Subscription Platforms

Get More Details On Research Methodology
Download PDF


