
| Study Period | 2018 - 2030 |
| Base Year For Estimation | 2023 |
| Forecast Data Period | 2024 - 2030 |
| Market Size (2024) | USD 3.30 Billion |
| Market Size (2030) | USD 5.02 Billion |
| CAGR (2024 - 2030) | 7.24 % |
| Market Concentration | Low |
Major Players*Disclaimer: Major Players sorted in no particular order |


India Construction Chemicals Market Analysis
The India Construction Chemicals Market size is estimated at 3.30 billion USD in 2024, and is expected to reach 5.02 billion USD by 2030, growing at a CAGR of 7.24% during the forecast period (2024-2030).
India's construction sector is experiencing an unprecedented transformation driven by rapid urbanization and infrastructure development initiatives. The country's infrastructure spending reached USD 133 billion in 2022, reflecting the government's commitment to modernizing urban landscapes and transportation networks. This massive investment has catalyzed demand for advanced construction chemicals across various projects, from smart cities to transportation hubs. The construction chemicals industry in India is evolving with the integration of sustainable building practices and the adoption of innovative technologies, particularly in commercial and residential developments. The emphasis on durability and quality in construction has led to increased utilization of specialized chemical solutions for enhanced structural integrity.
The commercial real estate sector has emerged as a significant driver of construction chemicals adoption, with the top seven cities witnessing substantial development activities. In 2022, these metropolitan areas added approximately 2.6 million square feet of mall space, demonstrating robust growth in retail infrastructure. The Grade A office market in these cities is projected to expand to 1.2 billion square feet by 2030, necessitating advanced construction chemical solutions for modern building requirements. This expansion is accompanied by a growing emphasis on green building certifications and sustainable construction practices, pushing developers to adopt eco-friendly chemical solutions that meet stringent environmental standards.
The residential construction segment is undergoing a remarkable transformation, driven by ambitious government initiatives and changing consumer preferences. The Smart City Project, with a planned investment of USD 24.3 billion, is revolutionizing urban development patterns and construction methodologies. The sector faces unprecedented demand, with projections indicating a requirement for approximately 25 million affordable housing units by 2030. This massive scale of development has spurred innovation in construction chemicals, particularly in areas such as waterproofing solutions, concrete admixtures, and protective coatings, which are essential for ensuring building longevity and performance.
The infrastructure sector is witnessing a paradigm shift with the government's ambitious target of USD 4.5 trillion in infrastructure investments by 2030. This comprehensive development agenda encompasses various projects, including the revamping of 600 railway stations and the development of 11 industrial corridors. The scale and complexity of these projects have elevated the importance of specialized construction chemicals in ensuring structural durability and performance. Modern infrastructure projects increasingly require advanced chemical solutions for applications ranging from high-performance concrete to protective coatings, reflecting the growing sophistication of India's construction chemicals market.
India Construction Chemicals Market Trends
India’s Grade A office market is expected to reach 1.2 billion sq. ft by 2030 and is likely to drive the demand for the commercial construction sector
- In 2022, India's new commercial floor area saw a 6.2% volume growth compared to 2021. The retail sector, particularly in the top seven cities (Delhi NCR, Bangalore, Hyderabad, Mumbai, Pune, Chennai, and Kolkata), witnessed robust demand, adding over 2.6 million sq. ft of mall space, a 27% increase from 2021. Looking ahead to 2023, the sector's new floor area is expected to surge by 38 million sq. ft, driven by a surge in foreign direct investment (FDI) fueling the need for new offices, retail outlets, and other facilities. Notably, the FDI equity inflow for construction development in 2023 was projected to hit USD 96 million.
- In 2020, India's commercial new floor area plummeted by 68.3% in volume compared to 2019. This decline was primarily due to a nationwide lockdown imposed by the government, which disrupted ongoing projects, strained supply chains, and impacted labor availability. However, as restrictions eased in 2021, the country witnessed a significant rebound, with the new floor area surging by approximately 526 million sq. ft. Additionally, 2021 saw a notable uptick in green building initiatives, with around 55% of commercial projects embracing sustainability, further bolstering the demand for the sector.
- Looking ahead to 2030, India's commercial new floor area is projected to hit 358 million sq. ft, a significant jump from 2023. This surge drives a growing appetite for shopping malls, office spaces, and other commercial facilities. For instance, India's Grade A office market in the top seven cities is set to expand to 1 billion sq. ft by 2026 and further to 1.2 billion sq. ft by 2030. Consequently, the country's commercial new floor area is poised to witness a robust CAGR of 5.26% during the forecast period.

Understand The Key Trends Shaping This Market
Download PDF
Rise in demand for housing units and increasing real estate sector to boost residential sector demand
- In 2022, India witnessed a 9.4% growth in residential floor area, outpacing the previous year. The demand for housing in the country surged, with the top seven cities (Delhi NCR, Bangalore, Hyderabad, Mumbai, Pune, Chennai, and Kolkata) collectively adding approximately 402,000 new units, marking a 44% increase from 2021. In Q1 2023, housing sales in these cities reached 1.14 lakh units, a staggering jump of over 99,500 units from the previous year. Consequently, it was projected that the residential new floor area in India would expand by approximately 71 million sq. ft in 2023 compared to 2022.
- In 2020, the residential sector in India faced a setback, witnessing a 6.25% decline in new floor area compared to the previous year. This decline was attributed to the nationwide lockdown, disruptions in the supply chain, labor shortages, reduced construction productivity, and a dip in foreign investments. However, in 2021, the Indian residential real estate market rebounded, adding around 163,000 new residential units across the top seven cities. This surge translated into a significant increase of about 649 million sq. ft in the residential sector's new floor area in 2021 compared to 2020.
- Looking ahead, the residential sector in India is poised to exhibit a CAGR of 2.95% in terms of volume from 2023 to 2030. This growth can be attributed to sustained housing demand, increased investments, and favorable government policies. Notably, by 2030, it is projected that over 40% of India's population will reside in urban areas, driving a demand for approximately 25 million additional affordable housing units. Furthermore, by 2030, the residential real estate market is expected to hit 1.5 million units in key cities, further fueling the demand in the sector.

OTHER KEY INDUSTRY TRENDS COVERED IN THE REPORT
- Indian warehousing space is expected to reach around 500 million sq. ft by 2030 and is likely to boost the industrial and institutional sector demand
- India plans to invest USD 4.5 trillion in infrastructure development by 2030, which will increase demand for the construction sector
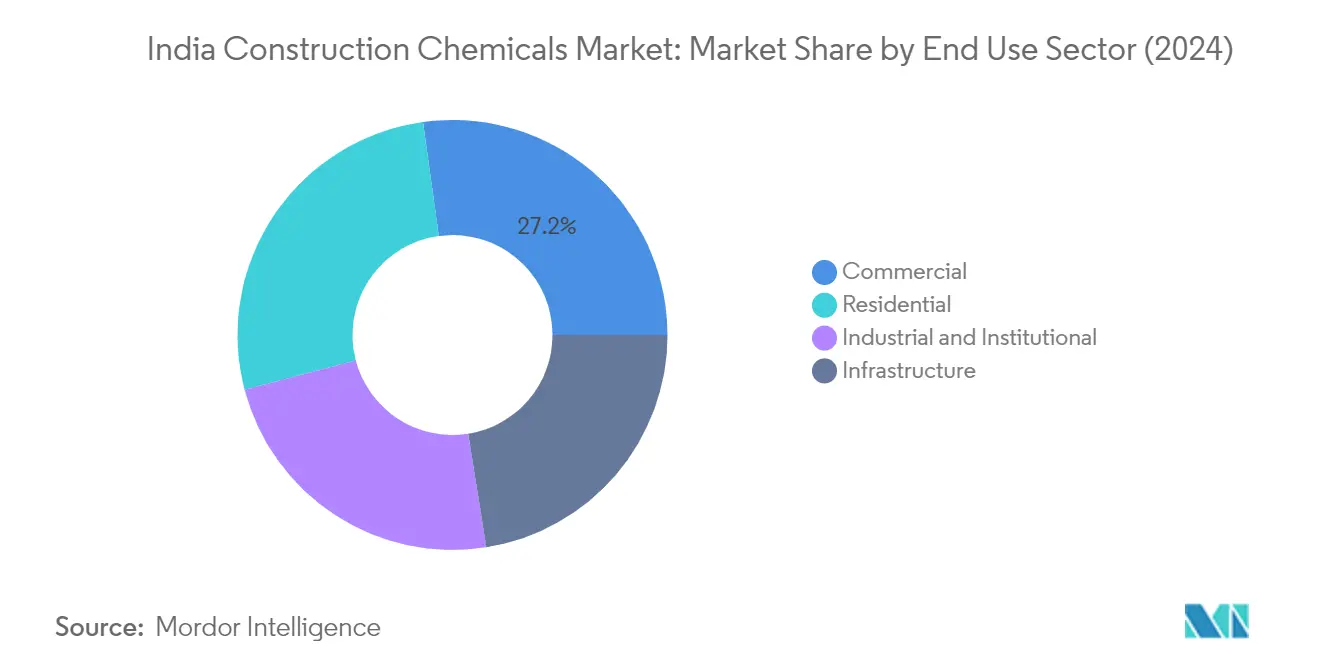
Segment Analysis: End Use Sector
Commercial Segment in India Construction Chemicals Market
The commercial sector has emerged as the dominant force in India's construction chemicals market, commanding approximately 27% market share in 2024. This leadership position is primarily driven by the sector's extensive funding sources, whether from government or private entities, which makes investing in construction chemical products more accessible compared to other building types. The segment's prominence is further reinforced by the higher densities and intricate designs characteristic of commercial buildings, necessitating a wider range of construction chemicals. The commercial sector's dominance is particularly evident in major cities like Delhi NCR, Bangalore, Hyderabad, Mumbai, Pune, Chennai, and Kolkata, where the Grade A office market is experiencing substantial growth, with projections indicating expansion to 1.2 billion square feet by 2030.
Residential Segment in India Construction Chemicals Market
The residential sector is demonstrating remarkable growth momentum, projected to expand at approximately 8% CAGR from 2024 to 2029. This accelerated growth is primarily driven by supportive government policies promoting housing construction, coupled with increasing awareness regarding the durability, safety, and quality of structures. The segment's growth is further bolstered by initiatives like the Smart City Project and the Pradhan Mantri Awas Yojana, which are catalyzing residential construction activities across the country. The rising demand for waterproofing solutions in residential construction, coupled with the increasing adoption of advanced construction technologies and sustainable building practices, is significantly contributing to this sector's rapid expansion.
Remaining Segments in End Use Sector
The industrial and institutional, as well as infrastructure segments, complete the market landscape, each playing crucial roles in driving the construction chemicals industry forward. The industrial and institutional sector is characterized by its demand for specialized chemicals that can withstand heavy industrial usage and maintain structural integrity in challenging environments. Meanwhile, the infrastructure segment is distinguished by its focus on large-scale projects requiring high-performance construction chemicals for applications in bridges, tunnels, and transportation infrastructure. Both segments are significantly influenced by government initiatives and private sector investments, with their demand patterns closely tied to national development projects and industrial growth strategies.
Segment Analysis: Product
Waterproofing Solutions Segment in India Construction Chemicals Market
Waterproofing solutions maintain their dominant position in India's construction chemicals market, commanding approximately 36% market share in 2024. This segment's leadership is driven by the widespread applications across various construction sectors, particularly in roofing, walls, basements, water tank linings, and bridge decks. The segment's prominence is further reinforced by India's challenging climate conditions, including heavy monsoons and high humidity levels, which necessitate robust waterproofing solutions. The segment encompasses both chemical-based solutions and membranes, with membranes holding a larger share due to their superior defense against hydrostatic pressure. The commercial and industrial sectors remain the primary consumers of waterproofing solutions, driven by the increasing focus on building durability and maintenance cost reduction. The waterproofing market size in India is expected to continue its growth trajectory, driven by these factors.
Surface Treatment Chemicals Segment in India Construction Chemicals Market
Surface treatment chemicals are emerging as the most dynamic segment in the construction chemicals market, projected to achieve a robust growth rate of approximately 8% during 2024-2029. This impressive growth trajectory is attributed to several factors, including the increasing adoption of precast concrete elements and the rising demand for mold release agents in construction projects. The segment's growth is further propelled by the expanding use of curing compounds, which help prevent shrinkage cracking in concrete and reduce resource wastage. The ease of application, low VOC content, and cost-effectiveness compared to chemical admixtures make surface treatment chemicals an increasingly preferred choice for protecting concrete surfaces across various construction applications.
Remaining Segments in Product Segmentation
The construction chemicals market features several other significant segments, including chemical admixtures, flooring resins, repair and rehabilitation chemicals, anchors and grouts, adhesives, and sealants. Chemical admixtures play a crucial role in enhancing concrete properties and durability, while flooring resins are essential for creating durable and aesthetic floor surfaces. Repair and rehabilitation chemicals are gaining importance in the maintenance and restoration of aging infrastructure. Anchors and grouts provide structural stability and support, while adhesives and sealants ensure proper bonding and sealing in various construction applications. Each of these segments contributes uniquely to the overall market dynamics, serving specific construction needs and applications across residential, commercial, and industrial sectors. The construction additives market is significantly influenced by these diverse product offerings.
India Construction Chemicals Industry Overview
Top Companies in India Construction Chemicals Market
The construction chemicals manufacturers in India include prominent players like Sika AG, Pidilite Industries, Saint-Gobain, MBCC Group, and Fosroc, who lead the industry. These construction chemical companies are actively pursuing product innovation, particularly in developing sustainable and environmentally friendly solutions, with a strong focus on low-VOC products and green building materials. Operational agility is demonstrated through extensive manufacturing networks and robust distribution channels across the country, allowing companies to serve diverse regional markets effectively. Strategic moves in the sector predominantly revolve around acquisitions and partnerships, with companies actively seeking to expand their product portfolios and market reach through strategic buyouts and collaborations with technology providers. Market leaders are also investing significantly in research and development facilities, establishing new manufacturing units, and expanding their presence in tier-2 and tier-3 cities to capture emerging opportunities in the rapidly growing construction sector.
Market Split Between Global and Local Players
The Indian construction chemicals market exhibits a fragmented structure with a mix of global conglomerates and local specialists competing for market share. Global players like Sika AG and Saint-Gobain leverage their international expertise and advanced technology capabilities, while domestic companies such as Pidilite Industries capitalize on their deep understanding of local market dynamics and established distribution networks. The market demonstrates moderate consolidation, with the top five companies collectively holding a significant but not dominant position, indicating healthy competition and opportunities for growth among smaller players. The competitive landscape is characterized by strong regional players who have carved out niches in specific product categories or geographical areas.
The market has witnessed significant merger and acquisition activity, particularly among global players seeking to strengthen their presence in the Indian market. Companies are actively pursuing vertical integration strategies to secure raw material supplies and enhance their manufacturing capabilities. The trend of strategic partnerships between international and local players has become increasingly prevalent, allowing companies to combine technological expertise with local market knowledge. This dynamic has created a competitive environment where success depends on a combination of technical capabilities, distribution reach, and customer relationships.
Innovation and Distribution Drive Market Success
For incumbent players to maintain and increase their market share, developing innovative products tailored to local construction needs and weather conditions has become crucial. Companies must focus on building strong relationships with key stakeholders in the construction industry, including architects, contractors, and developers, while simultaneously expanding their distribution networks to reach untapped markets. Success in the market increasingly depends on the ability to offer comprehensive solution packages rather than standalone products, coupled with technical support and after-sales service. Established players are also finding success through strategic investments in digital technologies for both marketing and technical support, while maintaining competitive pricing strategies.
New entrants and contenders in the market need to focus on developing specialized products for specific applications or regional requirements to gain a foothold. The market presents opportunities for companies that can address the growing demand for sustainable construction chemicals and meet increasingly stringent environmental regulations. Building strong distribution networks and establishing technical service capabilities are essential for gaining market acceptance. The risk of substitution remains relatively low due to the specialized nature of construction chemicals, but companies must stay ahead of technological advancements and changing construction practices. Success also depends on the ability to navigate regulatory requirements, particularly regarding environmental compliance and product safety standards.
India Construction Chemicals Market Leaders
-
Fosroc, Inc.
-
MBCC Group
-
Pidilite Industries Ltd.
-
Saint-Gobain
-
Sika AG
- *Disclaimer: Major Players sorted in no particular order

Need More Details on Market Players and Competiters?
Download PDF
India Construction Chemicals Market News
- May 2023: Sika, a global leader in construction chemicals, acquired the MBCC Group, including its waterproofing solutions, anchors & grouts, flooring resins, repair & rehabilitation chemicals, and other businesses, with the exception of its concrete admixture operations in Europe, North America, Australia, and New Zealand.
- February 2023: Master Builders Solutions, an MBCC Group brand, inaugurated a new offshore grout production plant in Taichung, Taiwan, in order to meet the ongoing demand of the offshore wind turbine market.
- November 2022: Saint-Gobain's subsidiary, Chryso, introduced CHRYSO Dem Aqua 800, a vegetable oil emulsion-based mold release agent for different concrete applications to provide excellent surface finish quality, mold protection, HSE profile, and optimized consumption.
Free With This Report
We provide a complimentary and exhaustive set of data points on global and regional metrics that present the fundamental structure of the industry. Presented in the form of 24+ free charts, the section covers rare data on newly built floor area, infrastructural spending, and existing construction floor area across residential, commercial, industrial and institutional sectors.


India Construction Chemicals Market Report - Table of Contents
1. EXECUTIVE SUMMARY & KEY FINDINGS
2. REPORT OFFERS
3. INTRODUCTION
- 3.1 Study Assumptions & Market Definition
- 3.2 Scope of the Study
- 3.3 Research Methodology
4. KEY INDUSTRY TRENDS
-
4.1 End Use Sector Trends
- 4.1.1 Commercial
- 4.1.2 Industrial and Institutional
- 4.1.3 Infrastructure
- 4.1.4 Residential
- 4.2 Major Infrastructure Projects (current And Announced)
- 4.3 Regulatory Framework
- 4.4 Value Chain & Distribution Channel Analysis
5. MARKET SEGMENTATION (includes market size, forecasts up to 2030 and analysis of growth prospects.)
-
5.1 End Use Sector
- 5.1.1 Commercial
- 5.1.2 Industrial and Institutional
- 5.1.3 Infrastructure
- 5.1.4 Residential
-
5.2 Product
- 5.2.1 Adhesives
- 5.2.1.1 By Sub Product
- 5.2.1.1.1 Hot Melt
- 5.2.1.1.2 Reactive
- 5.2.1.1.3 Solvent-borne
- 5.2.1.1.4 Water-borne
- 5.2.2 Anchors and Grouts
- 5.2.2.1 By Sub Product
- 5.2.2.1.1 Cementitious Fixing
- 5.2.2.1.2 Resin Fixing
- 5.2.2.1.3 Other Types
- 5.2.3 Concrete Admixtures
- 5.2.3.1 By Sub Product
- 5.2.3.1.1 Accelerator
- 5.2.3.1.2 Air Entraining Admixture
- 5.2.3.1.3 High Range Water Reducer (Super Plasticizer)
- 5.2.3.1.4 Retarder
- 5.2.3.1.5 Shrinkage Reducing Admixture
- 5.2.3.1.6 Viscosity Modifier
- 5.2.3.1.7 Water Reducer (Plasticizer)
- 5.2.3.1.8 Other Types
- 5.2.4 Concrete Protective Coatings
- 5.2.4.1 By Sub Product
- 5.2.4.1.1 Acrylic
- 5.2.4.1.2 Alkyd
- 5.2.4.1.3 Epoxy
- 5.2.4.1.4 Polyurethane
- 5.2.4.1.5 Other Resin Types
- 5.2.5 Flooring Resins
- 5.2.5.1 By Sub Product
- 5.2.5.1.1 Acrylic
- 5.2.5.1.2 Epoxy
- 5.2.5.1.3 Polyaspartic
- 5.2.5.1.4 Polyurethane
- 5.2.5.1.5 Other Resin Types
- 5.2.6 Repair and Rehabilitation Chemicals
- 5.2.6.1 By Sub Product
- 5.2.6.1.1 Fiber Wrapping Systems
- 5.2.6.1.2 Injection Grouting Materials
- 5.2.6.1.3 Micro-concrete Mortars
- 5.2.6.1.4 Modified Mortars
- 5.2.6.1.5 Rebar Protectors
- 5.2.7 Sealants
- 5.2.7.1 By Sub Product
- 5.2.7.1.1 Acrylic
- 5.2.7.1.2 Epoxy
- 5.2.7.1.3 Polyurethane
- 5.2.7.1.4 Silicone
- 5.2.7.1.5 Other Resin Types
- 5.2.8 Surface Treatment Chemicals
- 5.2.8.1 By Sub Product
- 5.2.8.1.1 Curing Compounds
- 5.2.8.1.2 Mold Release Agents
- 5.2.8.1.3 Other Product Types
- 5.2.9 Waterproofing Solutions
- 5.2.9.1 By Sub Product
- 5.2.9.1.1 Chemicals
- 5.2.9.1.2 Membranes
6. COMPETITIVE LANDSCAPE
- 6.1 Key Strategic Moves
- 6.2 Market Share Analysis
- 6.3 Company Landscape
-
6.4 Company Profiles
- 6.4.1 Ardex Group
- 6.4.2 Don Construction Products Ltd.
- 6.4.3 ECMAS Group
- 6.4.4 Fosroc, Inc.
- 6.4.5 MAPEI S.p.A.
- 6.4.6 MBCC Group
- 6.4.7 Pidilite Industries Ltd.
- 6.4.8 Saint-Gobain
- 6.4.9 Sika AG
- 6.4.10 Thermax Limited
- *List Not Exhaustive
7. KEY STRATEGIC QUESTIONS FOR CONCRETE, MORTARS AND CONSTRUCTION CHEMICALS CEOS
8. APPENDIX
-
8.1 Global Overview
- 8.1.1 Overview
- 8.1.2 Porter’s Five Forces Framework (Industry Attractiveness Analysis)
- 8.1.3 Global Value Chain Analysis
- 8.1.4 Market Dynamics (DROs)
- 8.2 Sources & References
- 8.3 List of Tables & Figures
- 8.4 Primary Insights
- 8.5 Data Pack
- 8.6 Glossary of Terms
You Can Purchase Parts Of This Report. Check Out Prices For Specific Sections
Get Price Break-up Now
List of Tables & Figures
- Figure 1:
- FLOOR AREA OF NEW COMMERCIAL CONSTRUCTION, SQUARE FEET, INDIA, 2018 - 2030
- Figure 2:
- FLOOR AREA OF NEW INDUSTRIAL AND INSTITUTIONAL CONSTRUCTION, SQUARE FEET, INDIA, 2018 - 2030
- Figure 3:
- SPENDING ON INFRASTRUCTURE PROJECTS, USD, INDIA, 2018 - 2030
- Figure 4:
- FLOOR AREA OF NEW RESIDENTIAL CONSTRUCTION, SQUARE FEET, INDIA, 2018 - 2030
- Figure 5:
- VALUE OF CONSTRUCTION CHEMICALS CONSUMED, USD, INDIA, 2018 - 2030
- Figure 6:
- VALUE OF CONSTRUCTION CHEMICALS CONSUMED BY END USE SECTOR, USD, INDIA, 2018 - 2030
- Figure 7:
- VALUE SHARE OF CONSTRUCTION CHEMICALS CONSUMED BY END USE SECTOR, %, INDIA, 2018 VS 2023 VS 2030
- Figure 8:
- VALUE OF CONSTRUCTION CHEMICALS CONSUMED IN COMMERCIAL SECTOR, USD, INDIA, 2018 - 2030
- Figure 9:
- VALUE SHARE OF CONSTRUCTION CHEMICALS CONSUMED IN COMMERCIAL SECTOR, BY PRODUCT, %, INDIA, 2023 VS 2030
- Figure 10:
- VALUE OF CONSTRUCTION CHEMICALS CONSUMED IN INDUSTRIAL AND INSTITUTIONAL SECTOR, USD, INDIA, 2018 - 2030
- Figure 11:
- VALUE SHARE OF CONSTRUCTION CHEMICALS CONSUMED IN INDUSTRIAL AND INSTITUTIONAL SECTOR, BY PRODUCT, %, INDIA, 2023 VS 2030
- Figure 12:
- VALUE OF CONSTRUCTION CHEMICALS CONSUMED IN INFRASTRUCTURE SECTOR, USD, INDIA, 2018 - 2030
- Figure 13:
- VALUE SHARE OF CONSTRUCTION CHEMICALS CONSUMED IN INFRASTRUCTURE SECTOR, BY PRODUCT, %, INDIA, 2023 VS 2030
- Figure 14:
- VALUE OF CONSTRUCTION CHEMICALS CONSUMED IN RESIDENTIAL SECTOR, USD, INDIA, 2018 - 2030
- Figure 15:
- VALUE SHARE OF CONSTRUCTION CHEMICALS CONSUMED IN RESIDENTIAL SECTOR, BY PRODUCT, %, INDIA, 2023 VS 2030
- Figure 16:
- VALUE OF CONSTRUCTION CHEMICALS CONSUMED BY PRODUCT, USD, INDIA, 2018 - 2030
- Figure 17:
- VALUE SHARE OF CONSTRUCTION CHEMICALS CONSUMED BY PRODUCT, %, INDIA, 2018 VS 2023 VS 2030
- Figure 18:
- VALUE OF ADHESIVES CONSUMED BY SUB PRODUCT, USD, INDIA, 2018 - 2030
- Figure 19:
- VALUE SHARE OF ADHESIVES CONSUMED BY SUB PRODUCT, %, INDIA, 2018 VS 2023 VS 2030
- Figure 20:
- VALUE OF HOT MELT ADHESIVES CONSUMED, USD, INDIA, 2018 - 2030
- Figure 21:
- VALUE SHARE OF HOT MELT ADHESIVES CONSUMED BY END USE SECTOR, %, INDIA, 2023 VS 2030
- Figure 22:
- VALUE OF REACTIVE ADHESIVES CONSUMED, USD, INDIA, 2018 - 2030
- Figure 23:
- VALUE SHARE OF REACTIVE ADHESIVES CONSUMED BY END USE SECTOR, %, INDIA, 2023 VS 2030
- Figure 24:
- VALUE OF SOLVENT-BORNE ADHESIVES CONSUMED, USD, INDIA, 2018 - 2030
- Figure 25:
- VALUE SHARE OF SOLVENT-BORNE ADHESIVES CONSUMED BY END USE SECTOR, %, INDIA, 2023 VS 2030
- Figure 26:
- VALUE OF WATER-BORNE ADHESIVES CONSUMED, USD, INDIA, 2018 - 2030
- Figure 27:
- VALUE SHARE OF WATER-BORNE ADHESIVES CONSUMED BY END USE SECTOR, %, INDIA, 2023 VS 2030
- Figure 28:
- VALUE OF ANCHORS AND GROUTS CONSUMED BY SUB PRODUCT, USD, INDIA, 2018 - 2030
- Figure 29:
- VALUE SHARE OF ANCHORS AND GROUTS CONSUMED BY SUB PRODUCT, %, INDIA, 2018 VS 2023 VS 2030
- Figure 30:
- VALUE OF CEMENTITIOUS FIXING ANCHORS AND GROUTS CONSUMED, USD, INDIA, 2018 - 2030
- Figure 31:
- VALUE SHARE OF CEMENTITIOUS FIXING ANCHORS AND GROUTS CONSUMED BY END USE SECTOR, %, INDIA, 2023 VS 2030
- Figure 32:
- VALUE OF RESIN FIXING ANCHORS AND GROUTS CONSUMED, USD, INDIA, 2018 - 2030
- Figure 33:
- VALUE SHARE OF RESIN FIXING ANCHORS AND GROUTS CONSUMED BY END USE SECTOR, %, INDIA, 2023 VS 2030
- Figure 34:
- VALUE OF OTHER TYPES ANCHORS AND GROUTS CONSUMED, USD, INDIA, 2018 - 2030
- Figure 35:
- VALUE SHARE OF OTHER TYPES ANCHORS AND GROUTS CONSUMED BY END USE SECTOR, %, INDIA, 2023 VS 2030
- Figure 36:
- VALUE OF CONCRETE ADMIXTURES CONSUMED BY SUB PRODUCT, USD, INDIA, 2018 - 2030
- Figure 37:
- VALUE SHARE OF CONCRETE ADMIXTURES CONSUMED BY SUB PRODUCT, %, INDIA, 2018 VS 2023 VS 2030
- Figure 38:
- VALUE OF ACCELERATOR CONCRETE ADMIXTURES CONSUMED, USD, INDIA, 2018 - 2030
- Figure 39:
- VALUE SHARE OF ACCELERATOR CONCRETE ADMIXTURES CONSUMED BY END USE SECTOR, %, INDIA, 2023 VS 2030
- Figure 40:
- VALUE OF AIR ENTRAINING ADMIXTURE CONCRETE ADMIXTURES CONSUMED, USD, INDIA, 2018 - 2030
- Figure 41:
- VALUE SHARE OF AIR ENTRAINING ADMIXTURE CONCRETE ADMIXTURES CONSUMED BY END USE SECTOR, %, INDIA, 2023 VS 2030
- Figure 42:
- VALUE OF HIGH RANGE WATER REDUCER (SUPER PLASTICIZER) CONCRETE ADMIXTURES CONSUMED, USD, INDIA, 2018 - 2030
- Figure 43:
- VALUE SHARE OF HIGH RANGE WATER REDUCER (SUPER PLASTICIZER) CONCRETE ADMIXTURES CONSUMED BY END USE SECTOR, %, INDIA, 2023 VS 2030
- Figure 44:
- VALUE OF RETARDER CONCRETE ADMIXTURES CONSUMED, USD, INDIA, 2018 - 2030
- Figure 45:
- VALUE SHARE OF RETARDER CONCRETE ADMIXTURES CONSUMED BY END USE SECTOR, %, INDIA, 2023 VS 2030
- Figure 46:
- VALUE OF SHRINKAGE REDUCING ADMIXTURE CONCRETE ADMIXTURES CONSUMED, USD, INDIA, 2018 - 2030
- Figure 47:
- VALUE SHARE OF SHRINKAGE REDUCING ADMIXTURE CONCRETE ADMIXTURES CONSUMED BY END USE SECTOR, %, INDIA, 2023 VS 2030
- Figure 48:
- VALUE OF VISCOSITY MODIFIER CONCRETE ADMIXTURES CONSUMED, USD, INDIA, 2018 - 2030
- Figure 49:
- VALUE SHARE OF VISCOSITY MODIFIER CONCRETE ADMIXTURES CONSUMED BY END USE SECTOR, %, INDIA, 2023 VS 2030
- Figure 50:
- VALUE OF WATER REDUCER (PLASTICIZER) CONCRETE ADMIXTURES CONSUMED, USD, INDIA, 2018 - 2030
- Figure 51:
- VALUE SHARE OF WATER REDUCER (PLASTICIZER) CONCRETE ADMIXTURES CONSUMED BY END USE SECTOR, %, INDIA, 2023 VS 2030
- Figure 52:
- VALUE OF OTHER TYPES CONCRETE ADMIXTURES CONSUMED, USD, INDIA, 2018 - 2030
- Figure 53:
- VALUE SHARE OF OTHER TYPES CONCRETE ADMIXTURES CONSUMED BY END USE SECTOR, %, INDIA, 2023 VS 2030
- Figure 54:
- VALUE OF CONCRETE PROTECTIVE COATINGS CONSUMED BY SUB PRODUCT, USD, INDIA, 2018 - 2030
- Figure 55:
- VALUE SHARE OF CONCRETE PROTECTIVE COATINGS CONSUMED BY SUB PRODUCT, %, INDIA, 2018 VS 2023 VS 2030
- Figure 56:
- VALUE OF ACRYLIC CONCRETE PROTECTIVE COATINGS CONSUMED, USD, INDIA, 2018 - 2030
- Figure 57:
- VALUE SHARE OF ACRYLIC CONCRETE PROTECTIVE COATINGS CONSUMED BY END USE SECTOR, %, INDIA, 2023 VS 2030
- Figure 58:
- VALUE OF ALKYD CONCRETE PROTECTIVE COATINGS CONSUMED, USD, INDIA, 2018 - 2030
- Figure 59:
- VALUE SHARE OF ALKYD CONCRETE PROTECTIVE COATINGS CONSUMED BY END USE SECTOR, %, INDIA, 2023 VS 2030
- Figure 60:
- VALUE OF EPOXY CONCRETE PROTECTIVE COATINGS CONSUMED, USD, INDIA, 2018 - 2030
- Figure 61:
- VALUE SHARE OF EPOXY CONCRETE PROTECTIVE COATINGS CONSUMED BY END USE SECTOR, %, INDIA, 2023 VS 2030
- Figure 62:
- VALUE OF POLYURETHANE CONCRETE PROTECTIVE COATINGS CONSUMED, USD, INDIA, 2018 - 2030
- Figure 63:
- VALUE SHARE OF POLYURETHANE CONCRETE PROTECTIVE COATINGS CONSUMED BY END USE SECTOR, %, INDIA, 2023 VS 2030
- Figure 64:
- VALUE OF OTHER RESIN TYPES CONCRETE PROTECTIVE COATINGS CONSUMED, USD, INDIA, 2018 - 2030
- Figure 65:
- VALUE SHARE OF OTHER RESIN TYPES CONCRETE PROTECTIVE COATINGS CONSUMED BY END USE SECTOR, %, INDIA, 2023 VS 2030
- Figure 66:
- VALUE OF FLOORING RESINS CONSUMED BY SUB PRODUCT, USD, INDIA, 2018 - 2030
- Figure 67:
- VALUE SHARE OF FLOORING RESINS CONSUMED BY SUB PRODUCT, %, INDIA, 2018 VS 2023 VS 2030
- Figure 68:
- VALUE OF ACRYLIC FLOORING RESINS CONSUMED, USD, INDIA, 2018 - 2030
- Figure 69:
- VALUE SHARE OF ACRYLIC FLOORING RESINS CONSUMED BY END USE SECTOR, %, INDIA, 2023 VS 2030
- Figure 70:
- VALUE OF EPOXY FLOORING RESINS CONSUMED, USD, INDIA, 2018 - 2030
- Figure 71:
- VALUE SHARE OF EPOXY FLOORING RESINS CONSUMED BY END USE SECTOR, %, INDIA, 2023 VS 2030
- Figure 72:
- VALUE OF POLYASPARTIC FLOORING RESINS CONSUMED, USD, INDIA, 2018 - 2030
- Figure 73:
- VALUE SHARE OF POLYASPARTIC FLOORING RESINS CONSUMED BY END USE SECTOR, %, INDIA, 2023 VS 2030
- Figure 74:
- VALUE OF POLYURETHANE FLOORING RESINS CONSUMED, USD, INDIA, 2018 - 2030
- Figure 75:
- VALUE SHARE OF POLYURETHANE FLOORING RESINS CONSUMED BY END USE SECTOR, %, INDIA, 2023 VS 2030
- Figure 76:
- VALUE OF OTHER RESIN TYPES FLOORING RESINS CONSUMED, USD, INDIA, 2018 - 2030
- Figure 77:
- VALUE SHARE OF OTHER RESIN TYPES FLOORING RESINS CONSUMED BY END USE SECTOR, %, INDIA, 2023 VS 2030
- Figure 78:
- VALUE OF REPAIR AND REHABILITATION CHEMICALS CONSUMED BY SUB PRODUCT, USD, INDIA, 2018 - 2030
- Figure 79:
- VALUE SHARE OF REPAIR AND REHABILITATION CHEMICALS CONSUMED BY SUB PRODUCT, %, INDIA, 2018 VS 2023 VS 2030
- Figure 80:
- VALUE OF FIBER WRAPPING SYSTEMS REPAIR AND REHABILITATION CHEMICALS CONSUMED, USD, INDIA, 2018 - 2030
- Figure 81:
- VALUE SHARE OF FIBER WRAPPING SYSTEMS REPAIR AND REHABILITATION CHEMICALS CONSUMED BY END USE SECTOR, %, INDIA, 2023 VS 2030
- Figure 82:
- VALUE OF INJECTION GROUTING MATERIALS REPAIR AND REHABILITATION CHEMICALS CONSUMED, USD, INDIA, 2018 - 2030
- Figure 83:
- VALUE SHARE OF INJECTION GROUTING MATERIALS REPAIR AND REHABILITATION CHEMICALS CONSUMED BY END USE SECTOR, %, INDIA, 2023 VS 2030
- Figure 84:
- VALUE OF MICRO-CONCRETE MORTARS REPAIR AND REHABILITATION CHEMICALS CONSUMED, USD, INDIA, 2018 - 2030
- Figure 85:
- VALUE SHARE OF MICRO-CONCRETE MORTARS REPAIR AND REHABILITATION CHEMICALS CONSUMED BY END USE SECTOR, %, INDIA, 2023 VS 2030
- Figure 86:
- VALUE OF MODIFIED MORTARS REPAIR AND REHABILITATION CHEMICALS CONSUMED, USD, INDIA, 2018 - 2030
- Figure 87:
- VALUE SHARE OF MODIFIED MORTARS REPAIR AND REHABILITATION CHEMICALS CONSUMED BY END USE SECTOR, %, INDIA, 2023 VS 2030
- Figure 88:
- VALUE OF REBAR PROTECTORS REPAIR AND REHABILITATION CHEMICALS CONSUMED, USD, INDIA, 2018 - 2030
- Figure 89:
- VALUE SHARE OF REBAR PROTECTORS REPAIR AND REHABILITATION CHEMICALS CONSUMED BY END USE SECTOR, %, INDIA, 2023 VS 2030
- Figure 90:
- VALUE OF SEALANTS CONSUMED BY SUB PRODUCT, USD, INDIA, 2018 - 2030
- Figure 91:
- VALUE SHARE OF SEALANTS CONSUMED BY SUB PRODUCT, %, INDIA, 2018 VS 2023 VS 2030
- Figure 92:
- VALUE OF ACRYLIC SEALANTS CONSUMED, USD, INDIA, 2018 - 2030
- Figure 93:
- VALUE SHARE OF ACRYLIC SEALANTS CONSUMED BY END USE SECTOR, %, INDIA, 2023 VS 2030
- Figure 94:
- VALUE OF EPOXY SEALANTS CONSUMED, USD, INDIA, 2018 - 2030
- Figure 95:
- VALUE SHARE OF EPOXY SEALANTS CONSUMED BY END USE SECTOR, %, INDIA, 2023 VS 2030
- Figure 96:
- VALUE OF POLYURETHANE SEALANTS CONSUMED, USD, INDIA, 2018 - 2030
- Figure 97:
- VALUE SHARE OF POLYURETHANE SEALANTS CONSUMED BY END USE SECTOR, %, INDIA, 2023 VS 2030
- Figure 98:
- VALUE OF SILICONE SEALANTS CONSUMED, USD, INDIA, 2018 - 2030
- Figure 99:
- VALUE SHARE OF SILICONE SEALANTS CONSUMED BY END USE SECTOR, %, INDIA, 2023 VS 2030
- Figure 100:
- VALUE OF OTHER RESIN TYPES SEALANTS CONSUMED, USD, INDIA, 2018 - 2030
- Figure 101:
- VALUE SHARE OF OTHER RESIN TYPES SEALANTS CONSUMED BY END USE SECTOR, %, INDIA, 2023 VS 2030
- Figure 102:
- VALUE OF SURFACE TREATMENT CHEMICALS CONSUMED BY SUB PRODUCT, USD, INDIA, 2018 - 2030
- Figure 103:
- VALUE SHARE OF SURFACE TREATMENT CHEMICALS CONSUMED BY SUB PRODUCT, %, INDIA, 2018 VS 2023 VS 2030
- Figure 104:
- VALUE OF CURING COMPOUNDS SURFACE TREATMENT CHEMICALS CONSUMED, USD, INDIA, 2018 - 2030
- Figure 105:
- VALUE SHARE OF CURING COMPOUNDS SURFACE TREATMENT CHEMICALS CONSUMED BY END USE SECTOR, %, INDIA, 2023 VS 2030
- Figure 106:
- VALUE OF MOLD RELEASE AGENTS SURFACE TREATMENT CHEMICALS CONSUMED, USD, INDIA, 2018 - 2030
- Figure 107:
- VALUE SHARE OF MOLD RELEASE AGENTS SURFACE TREATMENT CHEMICALS CONSUMED BY END USE SECTOR, %, INDIA, 2023 VS 2030
- Figure 108:
- VALUE OF OTHER PRODUCT TYPES SURFACE TREATMENT CHEMICALS CONSUMED, USD, INDIA, 2018 - 2030
- Figure 109:
- VALUE SHARE OF OTHER PRODUCT TYPES SURFACE TREATMENT CHEMICALS CONSUMED BY END USE SECTOR, %, INDIA, 2023 VS 2030
- Figure 110:
- VALUE OF WATERPROOFING SOLUTIONS CONSUMED BY SUB PRODUCT, USD, INDIA, 2018 - 2030
- Figure 111:
- VALUE SHARE OF WATERPROOFING SOLUTIONS CONSUMED BY SUB PRODUCT, %, INDIA, 2018 VS 2023 VS 2030
- Figure 112:
- VALUE OF CHEMICALS WATERPROOFING SOLUTIONS CONSUMED, USD, INDIA, 2018 - 2030
- Figure 113:
- VALUE SHARE OF CHEMICALS WATERPROOFING SOLUTIONS CONSUMED BY END USE SECTOR, %, INDIA, 2023 VS 2030
- Figure 114:
- VALUE OF MEMBRANES WATERPROOFING SOLUTIONS CONSUMED, USD, INDIA, 2018 - 2030
- Figure 115:
- VALUE SHARE OF MEMBRANES WATERPROOFING SOLUTIONS CONSUMED BY END USE SECTOR, %, INDIA, 2023 VS 2030
- Figure 116:
- MOST ACTIVE COMPANIES BY NUMBER OF STRATEGIC MOVES, INDIA, 2020 - 2023
- Figure 117:
- MOST ADOPTED STRATEGIES, COUNT, INDIA, 2020 - 2023
- Figure 118:
- REVENUE SHARE OF CONSTRUCTION CHEMICALS BY MAJOR PLAYERS, %, INDIA, 2022
India Construction Chemicals Industry Segmentation
Commercial, Industrial and Institutional, Infrastructure, Residential are covered as segments by End Use Sector. Adhesives, Anchors and Grouts, Concrete Admixtures, Concrete Protective Coatings, Flooring Resins, Repair and Rehabilitation Chemicals, Sealants, Surface Treatment Chemicals, Waterproofing Solutions are covered as segments by Product.| End Use Sector | Commercial | |||
| Industrial and Institutional | ||||
| Infrastructure | ||||
| Residential | ||||
| Product | Adhesives | By Sub Product | Hot Melt | |
| Reactive | ||||
| Solvent-borne | ||||
| Water-borne | ||||
| Anchors and Grouts | By Sub Product | Cementitious Fixing | ||
| Resin Fixing | ||||
| Other Types | ||||
| Concrete Admixtures | By Sub Product | Accelerator | ||
| Air Entraining Admixture | ||||
| High Range Water Reducer (Super Plasticizer) | ||||
| Retarder | ||||
| Shrinkage Reducing Admixture | ||||
| Viscosity Modifier | ||||
| Water Reducer (Plasticizer) | ||||
| Other Types | ||||
| Concrete Protective Coatings | By Sub Product | Acrylic | ||
| Alkyd | ||||
| Epoxy | ||||
| Polyurethane | ||||
| Other Resin Types | ||||
| Flooring Resins | By Sub Product | Acrylic | ||
| Epoxy | ||||
| Polyaspartic | ||||
| Polyurethane | ||||
| Other Resin Types | ||||
| Repair and Rehabilitation Chemicals | By Sub Product | Fiber Wrapping Systems | ||
| Injection Grouting Materials | ||||
| Micro-concrete Mortars | ||||
| Modified Mortars | ||||
| Rebar Protectors | ||||
| Sealants | By Sub Product | Acrylic | ||
| Epoxy | ||||
| Polyurethane | ||||
| Silicone | ||||
| Other Resin Types | ||||
| Surface Treatment Chemicals | By Sub Product | Curing Compounds | ||
| Mold Release Agents | ||||
| Other Product Types | ||||
| Waterproofing Solutions | By Sub Product | Chemicals | ||
| Membranes | ||||
Need A Different Region or Segment?
Customize Now
Market Definition
- END-USE SECTOR - Construction chemicals consumed in the construction sectors such as commercial, residential, industrial, institutional, and infrastructure are considered under the scope of the study.
- PRODUCT/APPLICATION - Under the scope of the study, the consumption of construction chemical products such as concrete admixtures, repair and rehabilitation chemicals, flooring resins, waterproofing solutions, anchors and grouts, adhesives and sealants, and surface treatment chemicals is considered.
| Keyword | Definition |
|---|---|
| Accelerator | Accelerators are admixtures used to fasten the setting time of concrete by increasing the initial rate and speeding up the chemical reaction between cement and the mixing water. These are used to harden and increase the strength of concrete quickly. |
| Acrylic | This synthetic resin is a derivative of acrylic acid. It forms a smooth surface and is mainly used for various indoor applications. The material can also be used for outdoor applications with a special formulation. |
| Adhesives | Adhesives are bonding agents used to join materials by gluing. Adhesives can be used in construction for many applications, such as carpet laying, ceramic tiles, countertop lamination, etc. |
| Air Entraining Admixture | Air-entraining admixtures are used to improve the performance and durability of concrete. Once added, they create uniformly distributed small air bubbles to impart enhanced properties to the fresh and hardened concrete. |
| Alkyd | Alkyds are used in solvent-based paints such as construction and automotive paints, traffic paints, flooring resins, protective coatings for concrete, etc. Alkyd resins are formed by the reaction of an oil (fatty acid), a polyunsaturated alcohol (Polyol), and a polyunsaturated acid or anhydride. |
| Anchors and Grouts | Anchors and grouts are construction chemicals that stabilize and improve the strength and durability of foundations and structures like buildings, bridges, dams, etc. |
| Cementitious Fixing | Cementitious fixing is a process in which a cement-based grout is pumped under pressure to fill forms, voids, and cracks. It can be used in several settings, including bridges, marine applications, dams, and rock anchors. |
| Commercial Construction | Commercial construction comprises new construction of warehouses, malls, shops, offices, hotels, restaurants, cinemas, theatres, etc. |
| Concrete Admixtures | Concrete admixtures comprise water reducers, air entrainers, retarders, accelerators, superplasticizers, etc., added to concrete before or during mixing to modify its properties. |
| Concrete Protective Coatings | To provide specific protection, such as anti-carbonation or chemical resistance, a film-forming protective coat can be applied on the surface. Depending on the applications, different resins like epoxy, polyurethane, and acrylic can be used for concrete protective coatings. |
| Curing Compounds | Curing compounds are used to cure the surface of concrete structures, including columns, beams, slabs, and others. These curing compounds keep the moisture inside the concrete to give maximum strength and durability. |
| Epoxy | Epoxy is known for its strong adhesive qualities, making it a versatile product in many industries. It resists heat and chemical applications, making it an ideal product for anyone needing a stronghold under pressure. It is widely used in adhesives, electrical and electronics, paints, etc. |
| Fiber Wrapping Systems | Fiber Wrapping Systems are a part of construction repair and rehabilitation chemicals. It involves the strengthening of existing structures by wrapping structural members like beams and columns with glass or carbon fiber sheets. |
| Flooring Resins | Flooring resins are synthetic materials applied to floors to enhance their appearance, increase their resistance to wear and tear or provide protection from chemicals, moisture, and stains. Depending on the desired properties and the specific application, flooring resins are available in distinct types, such as epoxy, polyurethane, and acrylic. |
| High-Range Water Reducer (Super Plasticizer) | High-range water reducers are a type of concrete admixture that provides enhanced and improved properties when added to concrete. These are also called superplasticizers and are used to decrease the water-to-cement ratio in concrete. |
| Hot Melt Adhesives | Hot-melt adhesives are thermoplastic bonding materials applied as melts that achieve a solid state and resultant strength on cooling. They are commonly used for packaging, coatings, sanitary products, and tapes. |
| Industrial and Institutional Construction | Industrial and institutional construction includes new construction of hospitals, schools, manufacturing units, energy and power plants, etc. |
| Infrastructure Construction | Infrastructure construction includes new construction of railways, roads, seaways, airports, bridges, highways, etc. |
| Injection Grouting | The process of injecting grout into open joints, cracks, voids, or honeycombs in concrete or masonry structural members is known as injection grouting. It offers several benefits, such as strengthening a structure and preventing water infiltration. |
| Liquid-Applied Waterproofing Membranes | Liquid-Applied membrane is a monolithic, fully bonded, liquid-based coating suitable for many waterproofing applications. The coating cures to form a rubber-like elastomeric waterproof membrane and may be applied over many substrates, including asphalt, bitumen, and concrete. |
| Micro-concrete Mortars | Micro-concrete mortar is made up of cement, water-based resin, additives, mineral pigments, and polymers and can be applied on both horizontal and vertical surfaces. It can be used to refurbish residential complexes, commercial spaces, etc. |
| Modified Mortars | Modified Mortars include Portland cement and sand along with latex/polymer additives. The additives increase adhesion, strength, and shock resistance while also reducing water absorption. |
| Mold Release Agents | Mold release agents are sprayed or coated on the surface of molds to prevent a substrate from bonding to a molding surface. Several types of mold release agents, including silicone, lubricant, wax, fluorocarbons, and others, are used based on the type of substrates, including metals, steel, wood, rubber, plastic, and others. |
| Polyaspartic | Polyaspartic is a subset of polyurea. Polyaspartic floor coatings are typically two-part systems that consist of a resin and a catalyst to ease the curing process. It offers high durability and can withstand harsh environments. |
| Polyurethane | Polyurethane is a plastic material that exists in various forms. It can be tailored to be either rigid or flexible and is the material of choice for a broad range of end-user applications, such as adhesives, coatings, building insulation, etc. |
| Reactive Adhesives | A reactive adhesive is made of monomers that react in the adhesive curing process and do not evaporate from the film during use. Instead, these volatile components become chemically incorporated into the adhesive. |
| Rebar Protectors | In concrete structures, rebar is one of the important components, and its deterioration due to corrosion is a major issue that affects the safety, durability, and life span of buildings and structures. For this reason, rebar protectors are used to protect against degrading effects, especially in infrastructure and industrial construction. |
| Repair and Rehabilitation Chemicals | Repair and Rehabilitation Chemicals include repair mortars, injection grouting materials, fiber wrapping systems, micro-concrete mortars, etc., used to repair and restore existing buildings and structures. |
| Residential Construction | Residential construction involves constructing new houses or spaces like condominiums, villas, and landed homes. |
| Resin Fixing | The process of using resins like epoxy and polyurethane for grouting applications is called resin fixing. Resin fixing offers several advantages, such as high compressive and tensile strength, negligible shrinkage, and greater chemical resistance compared to cementitious fixing. |
| Retarder | Retarders are admixtures used to slow down the setting time of concrete. These are usually added with a dosage rate of around 0.2% -0.6% by weight of cement. These admixtures slow down hydration or lower the rate at which water penetrates the cement particles by making concrete workable for a long time. |
| Sealants | A sealant is a viscous material that has little or no flow qualities, which causes it to remain on surfaces where they are applied. Sealants can also be thinner, enabling penetration to a certain substance through capillary action. |
| Sheet Waterproofing Membranes | Sheet membrane systems are reliable and durable thermoplastic waterproofing solutions that are used for waterproofing applications even in the most demanding below-ground structures, including those exposed to highly aggressive ground conditions and stress. |
| Shrinkage Reducing Admixture | Shrinkage-reducing admixtures are used to reduce concrete shrinkage, whether from drying or self-desiccation. |
| Silicone | Silicone is a polymer that contains silicon combined with carbon, hydrogen, oxygen, and, in some cases, other elements. It is an inert synthetic compound that comes in various forms, such as oil, rubber, and resin. Due to its heat-resistant properties, it finds applications in sealants, adhesives, lubricants, etc. |
| Solvent-borne Adhesives | Solvent-borne adhesives are mixtures of solvents and thermoplastic or slightly cross-linked polymers such as polychloroprene, polyurethane, acrylic, silicone, and natural and synthetic rubbers. |
| Surface Treatment Chemicals | Surface treatment chemicals are chemicals used to treat concrete surfaces, including roofs, vertical surfaces, and others. They act as curing compounds, demolding agents, rust removers, and others. They are cost-effective and can be used on roadways, pavements, parking lots, and others. |
| Viscosity Modifier | Viscosity Modifiers are concrete admixtures used to change various properties of admixtures, including viscosity, workability, cohesiveness, and others. These are usually added with a dosage of around 0.01% to 0.1% by weight of cement. |
| Water Reducer | Water reducers, also called plasticizers, are a type of admixture used to decrease the water-to-cement ratio in the concrete, thereby increasing the durability and strength of concrete. Various water reducers include refined lignosulfonates, gluconates, hydroxycarboxylic acids, sugar acids, and others. |
| Water-borne Adhesives | Water-borne adhesives use water as a carrier or diluting medium to disperse resin. They are set by allowing the water to evaporate or be absorbed by the substrate. These adhesives are compounded with water as a dilutant rather than a volatile organic solvent. |
| Waterproofing Chemicals | Waterproofing chemicals are designed to protect a surface from the perils of leakage. A waterproofing chemical is a protective coating or primer applied to a structure's roof, retaining walls, or basement. |
| Waterproofing Membranes | Waterproofing membranes are liquid-applied or self-adhering layers of water-tight materials that prevent water from penetrating or damaging a structure when applied to roofs, walls, foundations, basements, bathrooms, and other areas exposed to moisture or water. |
Need More Details on Market Definition?
Ask a Question
Research Methodology
Mordor Intelligence follows a four-step methodology in all our reports.
- Step-1: Identify Key Variables: The quantifiable key variables (industry and extraneous) pertaining to the specific product segment and country are selected from a group of relevant variables & factors based on desk research & literature review; along with primary expert inputs. These variables are further confirmed through regression modeling (wherever required).
- Step-2: Build a Market Model: In order to build a robust forecasting methodology, the variables and factors identified in Step-1 are tested against available historical market numbers. Through an iterative process, the variables required for market forecast are set and the model is built on the basis of these variables.
- Step-3: Validate and Finalize: In this important step, all market numbers, variables and analyst calls are validated through an extensive network of primary research experts from the market studied. The respondents are selected across levels and functions to generate a holistic picture of the market studied.
- Step-4: Research Outputs: Syndicated Reports, Custom Consulting Assignments, Databases & Subscription Platforms

Get More Details On Research Methodology
Download PDF


