
Market Overview
| Study Period | 2020 - 2031 |
|---|---|
| Forecast Data Period | 2026 - 2031 |
| Base Year Market Size (2025) | USD 411.45 Million |
| Market Size (2026) | USD 438.81 Million |
| Market Size (2031) | USD 605.14 Million |
| Growth Rate (2026 - 2031) | 6.65 % |
| Market Concentration | High |
Major Players
*Disclaimer: Major Players sorted in no particular order Image © Mordor Intelligence. Reuse requires attribution under CC BY 4.0. |
|
India Computed Tomography Market Analysis by Mordor Intelligence
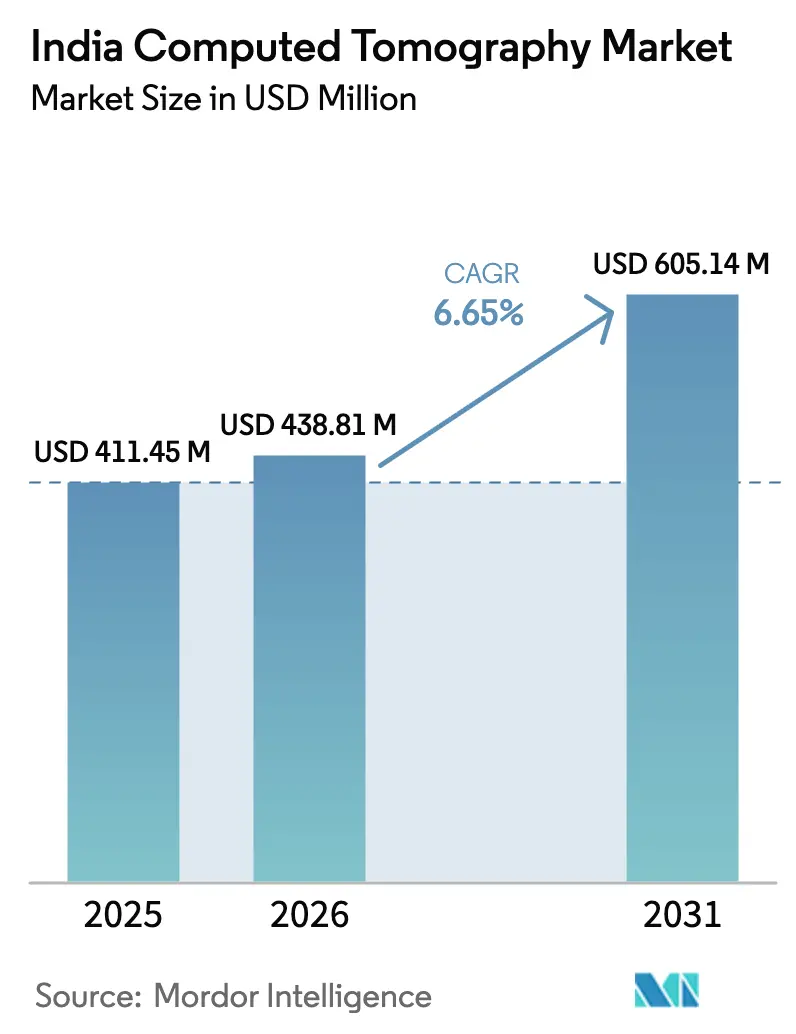
The India Computed Tomography (CT) market size was valued at USD 411.45 million in 2025 and estimated to grow from USD 438.81 million in 2026 to reach USD 605.14 million by 2031, at a CAGR of 6.65% during the forecast period (2026-2031). Robust government incentives, rapid private-sector expansion and persistent cancer screening programs are sustaining double-digit volume growth across the India Computed Tomography (CT) market. High patient throughput requirements are steering hospitals toward mid-slice systems, while simultaneous AI adoption is raising expectations for low-dose scans and shorter exam times. Domestic production under the Production Linked Incentive (PLI) scheme is trimming import costs and shortening delivery cycles, giving local buyers quicker access to the newest platforms. Intensifying regional competition is pushing vendors to embed advanced cardiac and oncology workflows in mid-price scanners, widening the clinical reach of the India Computed Tomography (CT) market.
Key Report Takeaways
- By technology, 64-slice platforms held 42.78% of the India Computed Tomography (CT) market share in 2025.
- By product type, stationary scanners accounted for 88.22% share of the India Computed Tomography (CT) market size in 2025.
- By application, oncology captured 42.55% of the India Computed Tomography (CT) market share in 2025.
- By end-user, hospitals commanded 61.12% of the India Computed Tomography (CT) market size in 2025.
- By device architecture, spiral systems dominated with 81.35% share of the India Computed Tomography (CT) market in 2025.
Note: Market size and forecast figures in this report are generated using Mordor Intelligence’s proprietary estimation framework, updated with the latest available data and insights as of 2026.
Market Trends and Insights
Drivers Impact Analysis of India Computed Tomography Market*
| Driver | (~) % Impact on CAGR Forecast | Geographic Relevance | Impact Timeline |
|---|---|---|---|
| Escalating cancer prevalence & screening programmes | +1.2% | National, with early gains in metros and tier-1 cities | Medium term (2-4 years) |
| Rising public-sector hospital capex (Ayushman Bharat, state tenders) | +1.8% | National, concentrated in underserved regions | Long term (≥ 4 years) |
| Rapid AI/ML integration for dose-optimized scans & workflow | +0.9% | Metro cities and tier-1 centers initially | Short term (≤ 2 years) |
| PLI-led domestic CT manufacturing push | +1.1% | Manufacturing hubs: Karnataka, Tamil Nadu, Maharashtra | Medium term (2-4 years) |
| Teleradiology uptake in Tier-2/3 cities enabling scanner demand | +0.8% | Tier-2/3 cities across all states | Medium term (2-4 years) |
| Micro-leasing & NBFC financing models for stand-alone diagnostics | +0.6% | Semi-urban and rural areas | Short term (≤ 2 years) |
| Source: Mordor Intelligence | |||
Escalating Cancer Prevalence & Screening Programs
Nearly 2 million new cancer cases are expected annually by 2040, heightening the need for timely CT-based diagnosis. Standardized pathways from the National Cancer Grid are funneling more patients to imaging centers equipped with 64-slice or higher platforms. Government projects such as MegCan Care are removing cost barriers, lifting examination volume at public hospitals. AI-powered oncology suites introduced at AIIMS Delhi demonstrate how image-analysis algorithms can cut report turnaround time and improve tumor detection accuracy. With oncology already the largest clinical segment inside the India Computed Tomography (CT) market, broader screening protocols are reinforcing equipment replacement cycles in metropolitan hubs before diffusing to tier-2 cities.
Rising Public-Sector Hospital Capex (Ayushman Bharat, State Tenders)
The Pradhan Mantri Ayushman Bharat Health Infrastructure Mission allocates USD 7.7 billion for new and upgraded diagnostic suites across India. Procurement guidelines favor domestically manufactured scanners, accelerating order flow for vendors with PLI-certified plants. Recent installations of 128-slice units in government trauma centers are raising the benchmark for image quality in emergency medicine. Sixteen additional AIIMS campuses, each requiring multi-room imaging departments, promise recurring tenders through the decade. Reimbursement revisions under CGHS, with higher tariffs for accredited facilities, are cushioning operating margins for public hospitals that invest in dose-efficient CT platforms.
Rapid AI/ML Integration for Dose-Optimized Scans & Workflow
India’s healthcare AI market is expanding at 40.6% CAGR, catalyzing upgrades toward scanners that embed real-time image reconstruction and automated protocol selection. GE HealthCare’s TrueFidelity-equipped systems reduce radiation by as much as 80% while preserving spatial resolution, a vital benefit in pediatric and oncology imaging. Partnerships between the National Health Authority and IIT Kanpur are generating open-source models that standardize chest CT interpretation, permitting faster nationwide rollouts. Private hospital chains are leveraging AI dashboards to balance scanner load and boost throughput, further elevating utilization rates across the India Computed Tomography (CT) market.
PLI-Led Domestic CT Manufacturing Push
A dedicated USD 410 million PLI incentive pool for medical imaging has sparked 13 greenfield plants, cutting lead times for mid-slice systems by 30%. Wipro GE Healthcare exported its first “Made in India” PET-CT to 15 countries in 2024, underlining the shift from import substitution to global supply participation. The prohibition on refurbished equipment imports removes a low-cost alternative, channeling demand into newer locally built scanners whose prices are already 30-50% below comparable imports. State tenders now carry 50% domestic value-addition mandates, further strengthening local assembly lines
Restraints Impact Analysis of India Computed Tomography Market*
| Restraint | (~) % Impact on CAGR Forecast | Geographic Relevance | Impact Timeline |
|---|---|---|---|
| High acquisition & lifecycle costs of ≥64-slice systems | -1.4% | Tier-2/3 cities and rural areas | Long term (≥ 4 years) |
| Shortage of radiologists / service engineers | -0.9% | National, acute in rural and semi-urban areas | Medium term (2-4 years) |
| Low reimbursement tariffs under CGHS & private insurers | -0.7% | National, affecting all healthcare providers | Medium term (2-4 years) |
| Radiation-safety licensing delays (AERB) | -0.5% | National, regulatory bottleneck | Short term (≤ 2 years) |
| Source: Mordor Intelligence | |||
High Acquisition & Lifecycle Costs of ≥64-Slice Systems
Premium systems can exceed total equipment budgets of mid-sized hospitals, especially where per-bed capital outlay is capped near USD 18,000. Service contracts, tube replacements and software updates often equal 40-60% of the original invoice across a decade. These economics constrain adoption beyond metropolitan centers despite rising clinical demand for cardiac CT angiography. Although domestic manufacturing trims list prices, financing innovations will remain critical for broader penetration of the India Computed Tomography (CT) market.
Shortage of Radiologists / Service Engineers
India’s radiologist density lags global norms, limiting after-hours coverage and undercutting scanner utilization. Skilled service personnel are scarce outside state capitals, extending downtime during tube or detector failures. Remote maintenance modules and predictive analytics are reducing unplanned outages, yet a nationwide service talent pipeline remains essential for sustained performance of the India Computed Tomography (CT) market.
*Our forecasts treat driver/restraint impacts as directional, not additive. The impact forecasts reflect baseline growth, mix effects, and variable interactions.
India Computed Tomography Market Segment Analysis
By Technology:
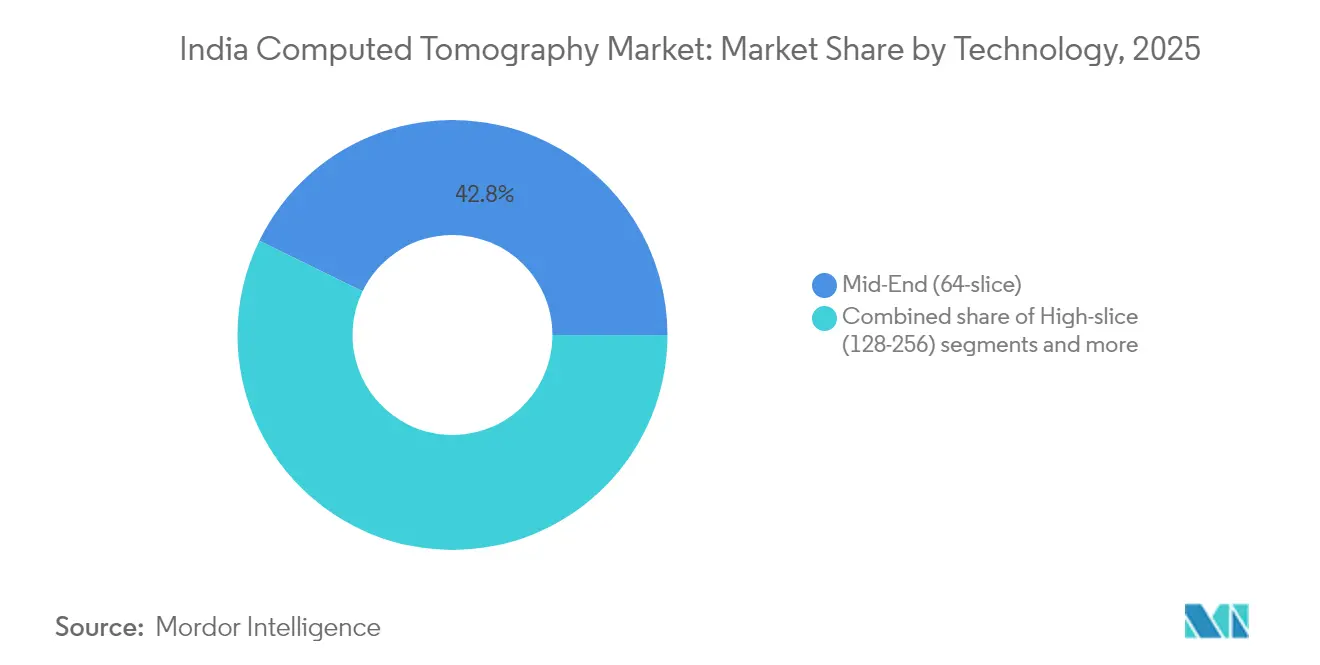
Mid-Slice Systems Retain Center-StageMid-slice scanners accounted for 42.78% of the India Computed Tomography (CT) market in 2025, confirming their sweet-spot balance between price and performance. Rising cardiology and trauma volumes are prompting tier-1 hospitals to upgrade to 128-slice platforms, which are advancing at 7.08% CAGR through 2031. The India Computed Tomography (CT) market size for 64-slice equipment remains substantial, but share is drifting toward higher arrays as procurement specifications tighten. Vendors are launching AI-ready mid-slice models with iterative reconstruction engines, preserving the segment’s relevance in budget-sensitive districts. Over time, lower total cost of ownership and dual-energy add-ons are expected to accelerate the shift away from <64-slice machines.
Second-generation photon-counting prototypes showcased at AOCR 2025 spotlight long-term innovation pathways, yet commercial uptake will hinge on price curves suitable for the India Computed Tomography (CT) market. Government tenders are also specifying radiation dose caps, giving AI-assisted 128-slice units an edge. Consequently, the technology landscape will feature a gradual laddering effect, with mid-slice as entry point and high-slice as clinical aspiration.

By Product Type:
Stationary Systems Dominate While Mobility Gains PaceStationary platforms held 88.22% share of the India Computed Tomography (CT) market size in 2025. Their integration with PACS, power infrastructure and shielding makes them the backbone of multispecialty hospitals. Portable scanners, however, are registering the quickest 7.56% CAGR by delivering bedside neuro imaging in intensive-care units. Manufacturers are shrinking gantry footprints and using lithium-ion power packs to suit makeshift isolation wards. Policy efforts to equip disaster-response teams with mobile CT vans are opening a parallel growth track. As trauma protocols mature, dual-duty deployments that swing between emergency departments and operating suites are likely to lift mobility’s contribution inside the India Computed Tomography (CT) market.
Financiers are experimenting with pay-per-day rental contracts for pop-up radiology camps, fostering first-time adoption in remote areas. Yet image-quality limitations and cooling requirements confine mobile units to targeted clinical scenarios. The stationary segment will thus preserve its structural dominance, aided by hospital-bed expansion programs that anchor volume stability.
By Application:
Oncology Remains Centerpiece Amid Maxillofacial UpsurgeOncology represented 42.55% of the India Computed Tomography (CT) market share in 2025, underscoring cancer imaging’s entrenched priority. Lung screening pilots in metro populations are multiplying scan counts, and radiotherapy planning needs precise 3D datasets. Dental and maxillofacial imaging is the fastest-growing application at 7.36% CAGR, fueled by cosmetic dentistry and implant workflows in urban clinics. AI-enabled nodule detection aids pulmonology, while improved reconstruction speeds favor rapid trauma triage.
Cardiac CT angiography volumes are climbing after NABH standardized accreditation criteria, making calcium scoring routine before elective interventions. Orthopedic practices are adopting low-dose protocols for pre-surgical planning, broadening the India Computed Tomography (CT) market size across musculoskeletal use-cases. Growth in neurology stems from decentralized stroke centers that require perfusion CT capability. Collectively, these shifts sustain multi-slice adoption and diversify revenue streams beyond core oncology usage.
By End-User:
Hospitals Anchor Sales While Outpatient Hubs AccelerateHospitals generated 61.12% of India Computed Tomography (CT) market revenue in 2025, supported by new AIIMS campuses and multi-hospital private chains. Bed additions across tier-2 cities guarantee baseline scanner demand over the forecast window. Ambulatory surgical centers lead growth at 7.05% CAGR as insurers incentivize day-care procedures. Radiology chains are scaling hub-and-spoke models, pooling CT referrals from satellite clinics through shared PACS.
Academic institutes capture research grants for AI model training, buying high-slice systems with dual-energy options. Veterinary and dental clinics represent smaller but noticeably rising pockets in the India Computed Tomography (CT) market, propelled by higher pet ownership and premium oral-care demand. Flexible financing, combined with modular upgrade paths, is lowering ownership thresholds for these niche buyers.

By Device Architecture:
Spiral Systems Hold Ground, C-Arm Spurs Hybrid SuitesSpiral scanners controlled 81.35% of the India Computed Tomography (CT) market in 2025. Continuous helical acquisition supports routine thorax-to-pelvis protocols and contrast-enhanced studies. C-arm CT is advancing at 7.22% CAGR, propelled by hybrid operating rooms that integrate imaging with angiographic guidance. Neurosurgical teams prefer O-arm configurations for intra-operative spine navigation, a trend still nascent but visible.
Flat-panel detector CT finds niche use in orthopedic clinics for weight-bearing extremity exams. Ring-gantry devices anchored to radiotherapy systems remain steady in large oncology centers. The India Computed Tomography (CT) market size for spiral systems will continue to dwarf other architectures, yet cross-disciplinary procedures are ensuring incremental share gains for C-arm platforms.
Geography Analysis
Northern and western metros dominate revenue owing to dense hospital networks and higher per-capita spending. Delhi-NCR and Mumbai cumulatively host more than 600 CT rooms, many equipped with ≥128-slice scanners for advanced cardiology. Southern metros such as Bengaluru and Chennai form the manufacturing and R&D nucleus, partly because Karnataka’s PLI incentives attract multinational assembly lines. State investments in Kalyani and Mangalagiri AIIMS are leveling regional access, routing procurement to eastern and southern corridors.
Tier-2 and tier-3 cities contribute a rising share of India Computed Tomography (CT) market volume as 40 million residents shift to urban clusters by FY27. Setup costs that are 90% below metro benchmarks let operators achieve faster breakeven, sparking chain-clinic proliferation. Revised CGHS rules mandating specialist referral for scans over INR 3,000 are fostering standardized imaging pathways from district hospitals to private centers, spurring equipment deployments.
Rural belts are beginning to see mobile scanner rollouts funded by disaster management agencies and CSR foundations. BharatNet’s fiber network backhaul permits teleradiology services that offset radiologist scarcity. Centralized equipment grants within the Ayushman Bharat mission are expected to place low-slice units in 150 community health centers by 2027, cementing a long-tail demand pipeline for the India Computed Tomography (CT) market.
Regulatory Landscape
CT scanners in India are regulated as medical devices under the Drugs and Cosmetics Act, 1940 and the Medical Devices Rules, 2017 (MDR 2017). CT scanner equipment was brought explicitly under the Drugs and Cosmetics Act framework effective April 1, 2021, which makes licensing, registration, and compliance obligations applicable to manufacturers and importers.
The Central Drugs Standard Control Organisation (CDSCO), as the Central Licensing Authority, oversees device registration and import licensing. In parallel, market conduct and competitive dynamics are being scrutinized through policy work such as the Competition Commission of India (CCI) market study (2024) on diagnostic medical imaging equipment. On the operating side, radiation-safety approvals and facility readiness remain an execution gate for new installations, so compliant site planning and documentation must run alongside device-level regulatory clearances.
Value Chain Analysis
The India CT scanner value chain includes global component suppliers (detectors, tubes, scintillators and electronics), OEM platform design and manufacturing/assembly, authorized importers and distributors, and downstream site planners and shielding contractors. Downstream operators include hospitals and diagnostic imaging centers. Historically, the value chain has been import-dependent, and the CCI (2024) notes that a large share of diagnostic medical imaging equipment in India is imported, linking system availability and pricing to foreign supply lead times and currency movements.
PLI-led localization is shifting the midstream as major OEMs increase local assembly/production and build service infrastructure in hubs such as Bengaluru, Pune, and Chennai. This improves parts positioning and reduces downtime risk for operators. At the same time, critical components remain largely sourced internationally, leaving residual exposure to component availability and logistics, which keeps after-sales service networks, preventive maintenance, and local spare-part stocking central to how hospitals and imaging chains evaluate total lifecycle cost.
Competitive Landscape
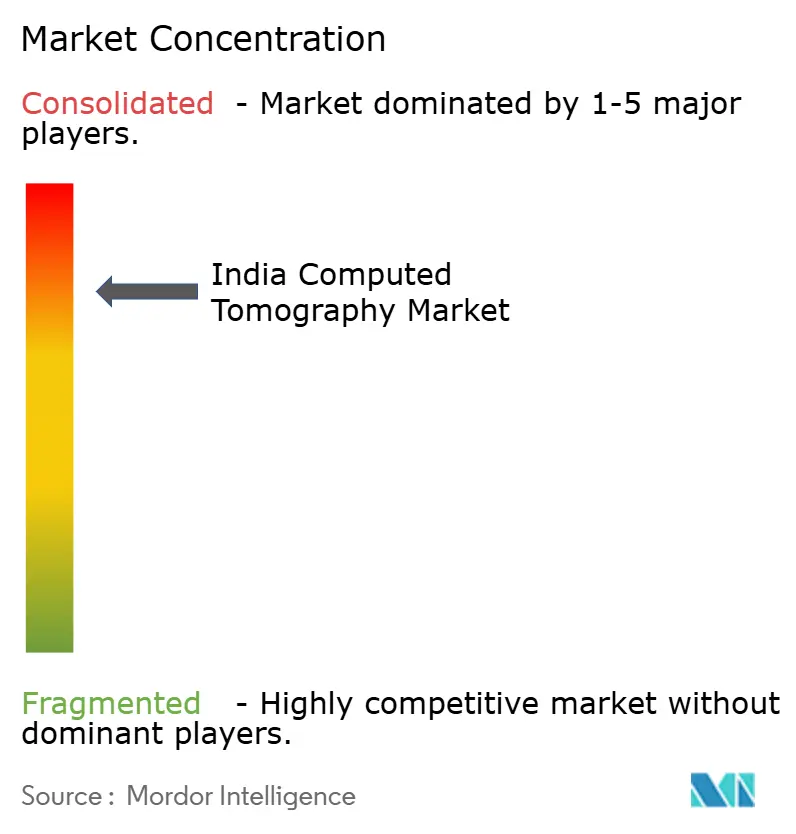
Competition is moderate with a tilt toward five international vendors collectively controlling more than half of shipments. Localization mandates are redrawing supply chains; GE HealthCare committed USD 960 million for Bangalore-based production, securing cost advantages and faster delivery. Siemens Healthineers is building dedicated CT and MRI lines in Karnataka, while Philips is expanding R&D capacity in Pune. These moves tighten lead times and empower vendors during price-sensitive tenders.
Strategic differentiation now pivots on embedded AI and <1 mSv scan protocols rather than pure detector count. Canon’s prospective India expansion signals fresh rivalry, especially in high-slice cardiology niches. Value-engineered domestic brands leverage PLI incentives to close feature gaps, targeting tier-2 hospitals with bundled service contracts. The ban on refurbished imports removes a historical price disruptor, compelling buyers to evaluate new compact models instead.
Collaborations with cloud PACS providers and teleradiology firms are becoming common, letting vendors package scanners with workflow analytics. GE HealthCare’s SmartTechnology suite integrates auto-triage algorithms, aligning with hospital chains that emphasize throughput and dose governance. Overall, vendor success will hinge on balancing feature-rich flagship units for metros with budget-friendly yet upgradable platforms for emerging catchment areas within the India Computed Tomography (CT) market.
India Computed Tomography Industry Leaders
-
Siemens Healthineers AG
-
Koninklijke Philips N.V.
-
GE Healthcare
-
Canon Medical Systems Corporation
-
Fujifilm Holdings Corporation
- *Disclaimer: Major Players sorted in no particular order
India Computed Tomography Market Companies Covered in this Report
- GE HealthCare Technologies Inc.
- Siemens Healthineers
- Koninklijke Philips
- Canon
- United Imaging Healthcare Co., Ltd.
- Hitachi
- FUJIFILM
- Trivitron Healthcare
- Allengers Medical Systems Ltd.
- Carestream Health
- Neusoft
- Shenzhen Anke High-tech Co., Ltd.
- Planmed
- Shimadzu
- Samsung Group
- Vatech Co., Ltd.
Market Opportunities and Future Outlook
Public and private procurement is creating whitespace in tier-2 and tier-3 catchments where access constraints are increasingly addressed through Ayushman Bharat-linked utilization and expanding diagnostic infrastructure. The Pradhan Mantri Ayushman Bharat Health Infrastructure Mission allocation (USD 7.7 billion) supports creation and upgrades of diagnostic suites, while tender preferences for domestically manufactured scanners are steering demand toward locally assembled mid-slice and high-slice configurations that meet domestic value-addition requirements.
Technology-led opportunity is tightening around workflow and dose governance, where AI-enabled reconstruction and protocoling improve throughput for radiology departments constrained by staffing. Clinical partnerships are also influencing premium adoption pathways, including Philips working with ACTREC and Tata Memorial Centre on Spectral CT for earlier cancer detection (Feb 2026), and AI-integrated innovation programs such as the AIIMS and Wipro GE Healthcare collaboration (Dec 2024) aimed at deployment-ready imaging intelligence. With refurbished imports restricted and OEMs expanding India-based manufacturing footprints, operators are comparing upgradeable new systems bundled with service, training, and digital workflow integration rather than relying on older secondary-market supply.
Recent Industry Developments in India Computed Tomography Market
- April 2026: CENT (Centre for Early Detection) in partnership with Siemens Healthineers opened a clinical prevention centre in Bengaluru and deepened partnership with Siemens Healthineers for MRI, CT, and DEXA imaging infrastructure. The launch expands local imaging capacity and accelerates vendor localization footprint in India.
- March 2026: Philips (Philips and ACTREC Tata Memorial Centre) partnered to implement Spectral CT imaging technology at ACTREC Tata Memorial Centre for cancer detection. The deployment strengthens oncology workflows and signals rising momentum for advanced CT capabilities in premier cancer care centers.
- January 2026: GE Healthcare Sri Ramachandra Institute of Higher Education and Research commissioned South Asia’s first GE Revolution Apex Elite 512-slice Spectral CT scanner. The introduction demonstrates rapid adoption of cutting-edge CT technology and potential workflow innovations in a major Indian academic hospital.
India Computed Tomography Market Report Scope and Research Methodology
Market Definition and Coverage
This market covers revenue generated from computed tomography (CT) systems sold and installed in India, including related system-level components that are commonly bundled with the scanner sale and initial setup. It reflects purchases across healthcare providers and diagnostic centers where CT is used for both routine and advanced imaging.
Scope exclusions: CT scan procedure revenue, radiology reading fees, PACS and IT services, and broader hospital imaging services are excluded from this market sizing.
Segments Covered in This Report
-
By Technology (Slice Count)
- Low-slice (<64)
- Mid-slice (64)
- High-slice (128–256)
-
By Product Type
- Stationary CT Scanners
- Portable / Mobile CT Scanners
-
By Application
-
Oncology
- Lung Cancer Screening
- Head & Neck Oncology
- Colorectal Oncology
- Other Oncology
-
Cardiology
- Coronary CT Angiography
- Calcium Scoring
- Structural Heart Disease
-
Neurology
- Stroke Assessment
- Brain Trauma
-
Vascular
- Peripheral Vascular Disease
- Pulmonary Angiography
-
Musculoskeletal
- Orthopedic Trauma
- Sports Injuries
- Dental & Maxillofacial
- Trauma & Emergency
- Other Applications
-
Oncology
-
By End-User
-
Hospitals
- Public Hospitals
- Private Hospitals
- Diagnostic Imaging Centers
- Dental Clinics
- Veterinary Clinics & Hospitals
- Academic & Research Institutes
-
Hospitals
-
By Device Architecture
- Spiral / Helical CT
- Ring-Gantry CT
- C-arm CT
- O-arm CT
- Flat-Panel Detector CT
Data Sources, Market Sizing, and Validation
Desk Research
Desk research was used to build a clean India-specific demand picture before any modeling assumptions were finalized. We relied on public health statistics and utilization signals, including Ministry of Health and Family Welfare releases, National Health Mission documents, and National Sample Survey style health indicators where available, to identify where imaging demand is building.
To cross-check supply-side movement, we reviewed sources such as Indian Customs trade statistics for CT-related imports, Press Information Bureau updates on medical device manufacturing and policy (including PLI-linked announcements), and peer-reviewed clinical and radiology journals that indicate scan intensity by disease area and care setting. Company annual reports, investor presentations, and reputed press coverage were also used to understand scanner placements, service footprints, and pricing direction, and then a paid subscription covering company financials and another covering shipment-level import or export data were used selectively to validate gaps. The desk sources listed here are illustrative and not exhaustive, and many other references were used for data collection, validation, and clarification.
Primary Interviews and Surveys
Primary work focused on verifying how CT systems are actually bought, priced, and replaced across India, since public data rarely shows deal-level patterns. We spoke with a mix of hospital procurement stakeholders, radiology and imaging heads, independent diagnostic center managers, and channel-side experts across major metros and fast-growing tier 2 cities, so assumptions on slice-mix, utilization pressure, and tender behavior could be checked and corrected.
Distribution of primary research fieldwork respondents
| Company type | Respondent position |
|---|---|
| Top tier: 26% | CXOs: 17% |
| Mid tier: 55% | Functional/Unit leaders: 39% |
| Smaller Players: 19% | Managers: 44% |
Market-Sizing & Forecasting
Market sizing was built using a top-down approach where India CT demand was reconstructed from installation base signals, replacement cycles, and expected yearly additions by care setting, and then translated into revenue using observed pricing ranges. Once the total was created, we corroborated it with selective bottom-up checks, including sampled deal pricing, channel feedback on unit volumes, and a sanity roll-up of visible procurement activity, to reduce the impact of outliers.
Key inputs used in the model included the CT installed base trend by facility type, the replacement rate tied to uptime and lifecycle expectations, the mix shift across slice categories as throughput needs rise, import dependence and lead times that affect delivery schedules, and the direction of average selling prices as domestic manufacturing and financing options evolve. For forecasting, scenario analysis was applied around public procurement intensity and private expansion plans, and the final forecast path was aligned to expert consensus on realistic adoption speed and budget constraints. Where granular unit data was missing for smaller geographies, we filled gaps using proxy indicators such as hospital bed additions and diagnostic center expansion patterns, and then re-checked these assumptions during interviews.
Data Validation & Update Cycle
Validation happens in layers so the final numbers do not depend on one data stream. We compare modeled revenue against independent signals such as import movement, public tender visibility, and installed base logic, and then check for sudden year-to-year jumps that do not fit procurement realities. When a variance is noticed, assumptions on pricing, replacement timing, or mix are revisited, and if needed, respondents are re-contacted to confirm what changed.
Before sign-off, the model and write-up go through multi-step internal reviews where calculations are re-performed and key inputs are traced back to their source notes. Reports are refreshed annually, with interim updates triggered by material events such as policy shifts, major tender waves, or sharp currency movement that affects equipment pricing. Right before delivery, we do a final pass to ensure the view reflects the latest available information.
Mordor Intelligence's India Computed Tomography Ct Market Size Measured Against Other Published Estimates
Published market sizes for India CT often differ because writers may not be counting the same scope, even when the title sounds identical. The main variation typically comes from what is included in the revenue pool, which year is treated as the base, how pricing is converted to USD, and how quickly older systems are assumed to be replaced.
CT scan procedure revenue and PACS software fees sit outside Mordor Intelligence's scope, and this single exclusion can materially reduce the value versus estimates that blend device sales with imaging workflow spending. The gap can also widen when some sources assume a faster upgrade to high-slice systems without checking affordability, or when a forecast is built from a single growth rate rather than installation, replacement, and ASP movement that are reviewed with India-based buyers.
Benchmark comparison
| Source | Market Size | Gaps in Research Methodology |
|---|---|---|
| Mordor Intelligence | USD 411.45 M (2025) | |
| Trade Journal A | USD 304.00 M (2024) | Uses an earlier base year and appears to describe the scanner market alongside adjacent digital workflow spend, which can shift what is counted as CT market revenue and how fast it grows. |
| Industry Publisher B | USD 325.40 M (2025) | May rely more heavily on a device-category growth rate and a broad ASP assumption across slice types, with limited visibility into replacement timing and public tender seasonality in India. |
The table shows that spreads are usually explained by what is included, the base year selected, and whether the model reflects real replacement and procurement behavior. Our method keeps the total traceable to installations, lifecycle-driven replacements, and realistic ASP ranges, and that makes the number easier to replicate and re-check when conditions change.
Key Questions Answered in the Report
How large is the India Computed Tomography (CT) market in 2026?
The market is valued at USD 438.81 million in 2026 and is forecast to reach USD 605.14 million by 2031.
Which CT technology segment is growing the fastest?
High-slice systems (128-256) are expanding at a 7.08% CAGR through 2031.
What share do hospitals hold in scanner purchases?
Hospitals account for 61.12% of current unit sales, reflecting their dominance in imaging demand.
How is the PLI scheme influencing local production?
PLI incentives have triggered 13 greenfield plants that shorten delivery times and cut prices by up to 30%.
What is the main growth driver for oncology imaging?
Rising cancer incidence and national screening programs are pushing more patients toward CT-based diagnosis.
Are mobile CT scanners gaining popularity?
Yes, portable units are growing at 7.56% CAGR, mainly for emergency and outreach settings.