
Market Overview
| Study Period | 2020 - 2031 |
|---|---|
| Forecast Data Period | 2026 - 2031 |
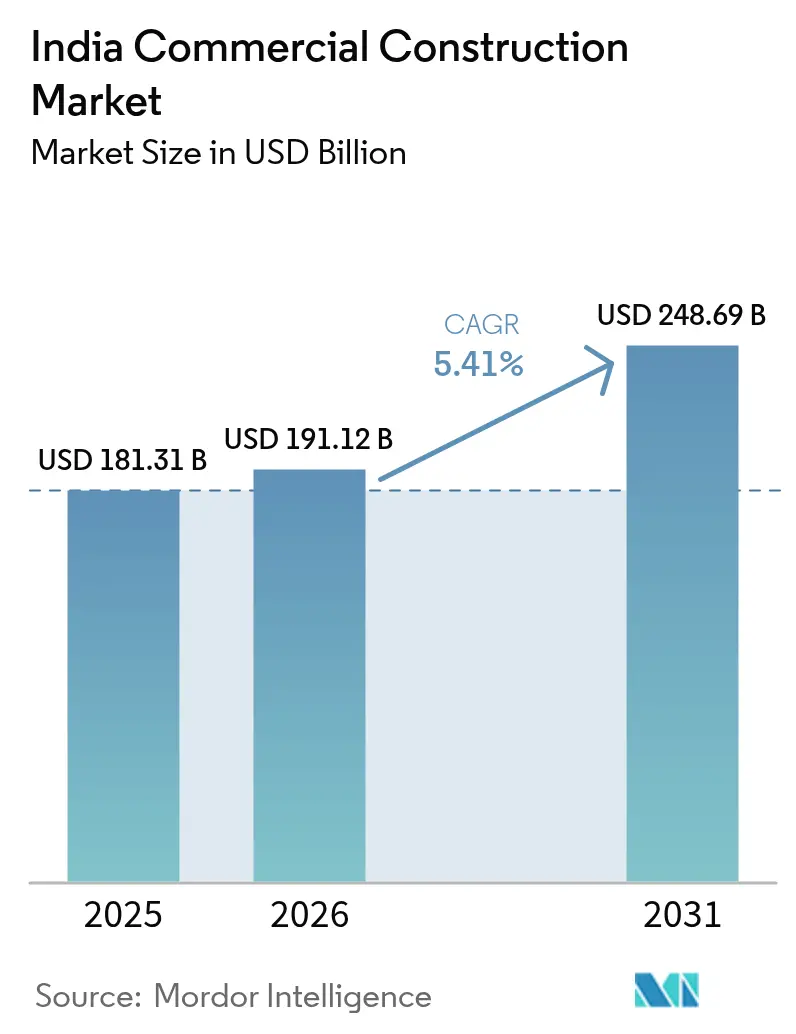
| Base Year Market Size (2025) | USD 181.31 Billion |
| Market Size (2026) | USD 191.12 Billion |
| Market Size (2031) | USD 248.69 Billion |
| Growth Rate (2026 - 2031) | 5.41% CAGR |
| Market Concentration | Medium |
Major Players *Disclaimer: Major Players sorted in no particular order Image © Mordor Intelligence. Reuse requires attribution under CC BY 4.0. | |
India Commercial Construction Market Analysis by Mordor Intelligence
India Commercial Construction market size in 2026 is estimated at USD 191.12 billion, growing from 2025 value of USD 181.31 billion with 2031 projections showing USD 248.69 billion, growing at 5.41% CAGR over 2026-2031. Ongoing government capital outlays of USD 135.1 billion in FY 2025–26, paired with the Smart Cities Mission’s USD 18.1 billion project pipeline, continue to lift core demand. Liquidity from REITs, surging data-center developments, and sustained private capital inflows sustain project momentum despite near-term cost inflation. Developers refine supply chains and adopt digital site-management tools to counter rising material costs while meeting tighter sustainability mandates. Across regions, the India commercial construction market reflects a pivot toward South India’s technology corridors even as West India retains scale advantages through deep capital pools and dense corporate occupancies.
Key Report Takeaways
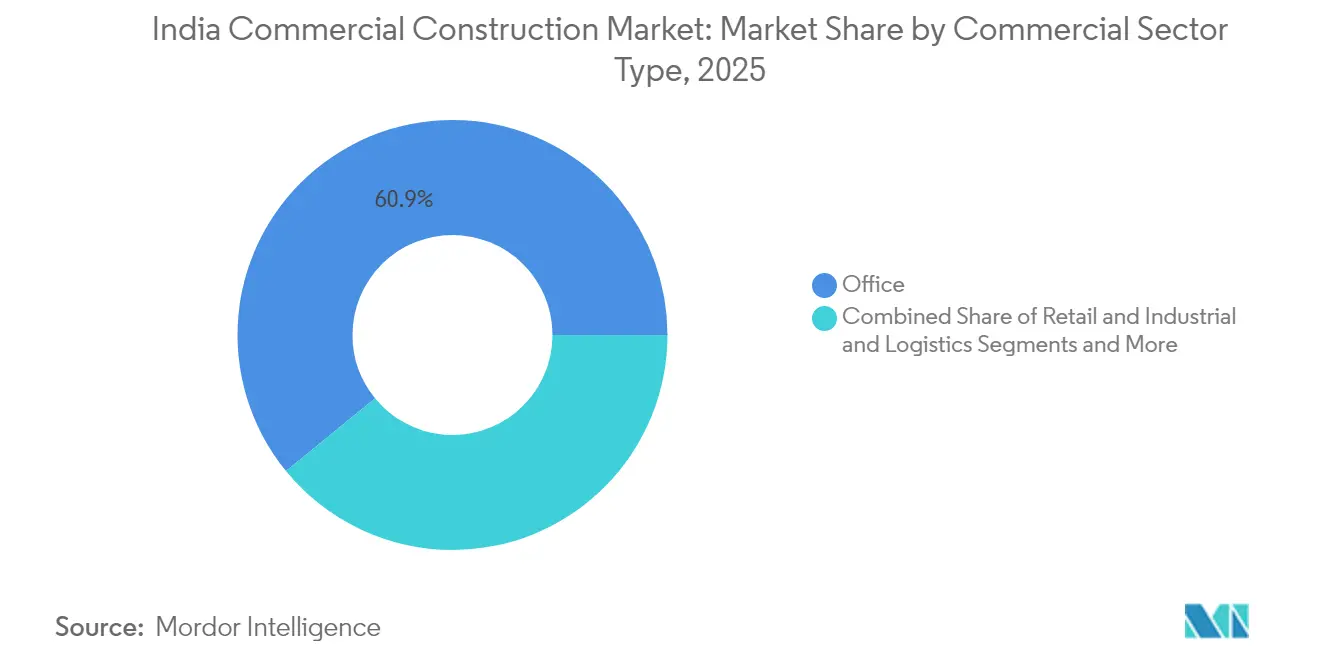
- By commercial sector type, Office led with 60.90% revenue share in 2025; Industrial & Logistics is projected to expand at a 6.84% CAGR through 2031.
- By construction type, new builds accounted for 73.65% of the India commercial construction market size in 2025, while renovation activities are advancing at a 6.93% CAGR to 2031.
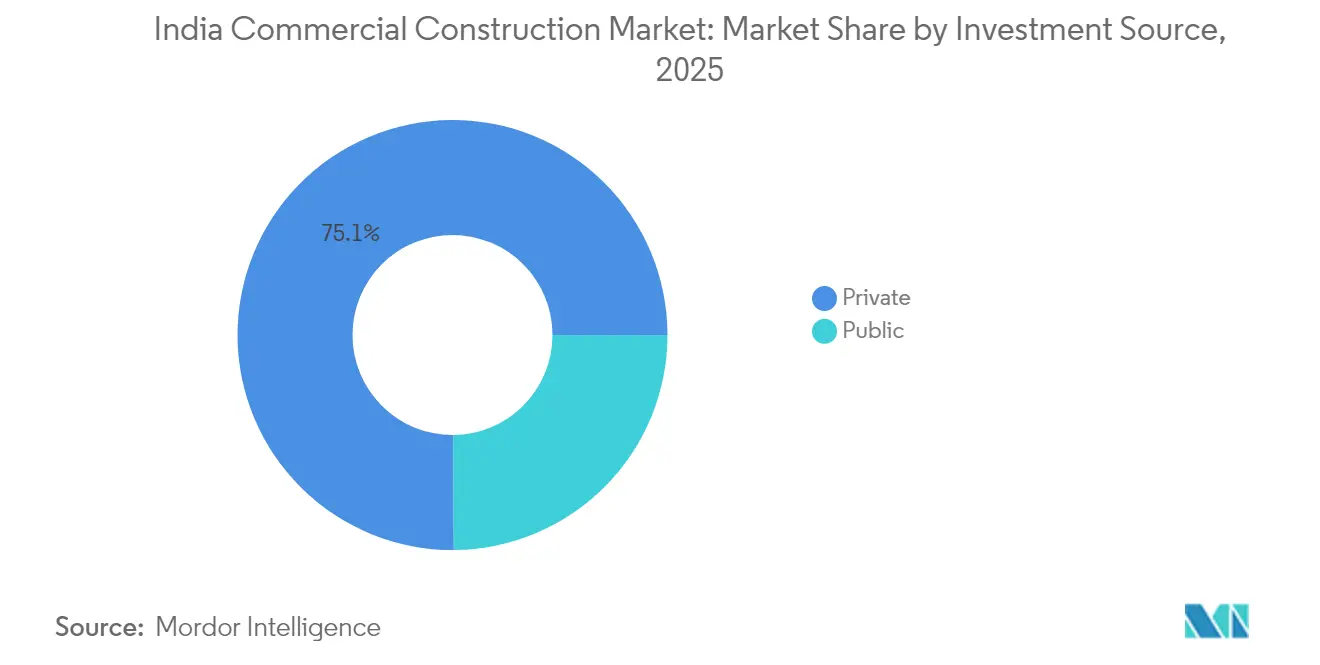
- By investment source, private capital held 75.10% of the India commercial construction market share in 2025; public funding registers the fastest 7.05% CAGR to 2031.
- By region, West India secured 39.20% revenue share in 2025, whereas South India is forecast to rise at a 7.48% CAGR through 2031.
Note: Market size and forecast figures in this report are generated using Mordor Intelligence’s proprietary estimation framework, updated with the latest available data and insights as of 2026.
India Commercial Construction Market Trends and Insights
Drivers Impact Analysis*
| Driver | (~) % Impact on CAGR Forecast | Geographic Relevance | Impact Timeline |
|---|---|---|---|
| Smart-Cities & infra push | 1.5% | National, with early gains in Tier-1 cities | Medium term (2-4 years) |
| REIT-led liquidity injection | 1.2% | Mumbai, Bengaluru, Hyderabad, Delhi-NCR | Short term (≤ 2 years) |
| Data-centre build-outs | 0.9% | Mumbai, Chennai, Hyderabad, Gujarat | Short term (≤ 2 years) |
| Flex-space culture | 0.8% | Metro cities, expanding to Tier-2 | Medium term (2-4 years) |
| Net-zero retrofit wave | 0.7% | Global, concentrated in Grade A office stock | Long term (≥ 4 years) |
| Source: Mordor Intelligence | |||
Smart-Cities & Infrastructure Push
More than 7,500 smart-city projects worth USD 18.1 billion have reached completion, and early successes in Agra and Pune demonstrate replicable models for mixed-use districts. Integrated command centers drive specialty demand for data-rich operations buildings, while transit upgrades spur commercial clusters along new corridors. Land-aggregation hurdles in smaller municipalities still delay timelines, prompting state governments to refine acquisition policies. Public-private partnerships proliferate as municipalities bundle road, utility, and commercial precincts into single concessions. Over the medium term, these initiatives provide a consistent demand floor for the India commercial construction market.
REIT-Led Liquidity Injection
Four active REITs now steward USD 1.72 billion in cumulative distributions and have unlocked a USD 7.47 billion gross asset base for reinvestment. The August 2025 listing of Knowledge Realty Trust raised USD 578 million, signaling maturing investor appetite for yield-oriented commercial portfolios. Roughly 60% of Grade-A office stock meets REIT eligibility, expanding the investable universe for pension and sovereign funds. Fresh equity enables faster ground-breaking for large campuses, especially in corridors with reliable fiber and power links. Wider acceptance of small-and medium-sized REIT structures is poised to funnel retail capital toward mid-tier projects in Tier 2 locations, widening the funding base across the India commercial construction market[1]Bureau of Energy Efficiency, “Star Rating Scheme for Commercial Buildings,” beeindia.gov.in.
Data-Center Build-Outs
National IT load is projected to swell from 0.9 GW in 2023 to nearly 2 GW by 2026, requiring USD 6.02 billion in fresh capital. Reliance’s planned hyperscale campus in Gujarat exemplifies the shift toward multi-tier, liquid-immersion-cooled halls designed for AI workloads. Construction cost per MW has escalated to USD 8–9 million, intensifying focus on value engineering and prefabricated electrical skids. International EPC majors such as CIMIC’s Leighton Asia partner with local specialists to blend global uptime standards with regional permitting fluency. The resulting pipeline continues to enlarge the India commercial construction market, especially in power-rich districts with fiber backbones.
Flex-Space Culture
Gross co-working stock is forecast to more than double to 126 million square feet by 2028 as enterprises hardwire hybrid work policies. Embassy Group’s USD 84.3 million acquisition of WeWork India and its planned IPO validate the asset-light, service-rich operating model. Flexible demand profiles favor modular floorplates, pre-engineered walls, and IoT-driven space-management systems. Older central business district buildings retrofit acoustic pods and wellness zones to stay relevant. Consequently, developers embed move-in-ready suites into new towers, thereby chaining construction timelines to ever-shorter leasing cycles.
Restraints Impact Analysis*
| Restraint | (~) % Impact on CAGR Forecast | Geographic Relevance | Impact Timeline |
|---|---|---|---|
| Construction-cost inflation | -0.6% | National, acute in metro cities | Short term (≤ 2 years) |
| Regulatory approval delays | -0.4% | State-specific, severe in North & West | Medium term (2-4 years) |
| Grid-capacity bottlenecks (Tier-2) | -0.3% | Tier-2 cities, particularly in North & Central India | Medium term (2-4 years) |
| Flight-to-quality vacancy risk | -0.2% | Metro office markets, concentrated in Hyderabad & Bengaluru | Short term (≤ 2 years) |
| Source: Mordor Intelligence | |||
Construction-Cost Inflation
Average build costs touched USD 33.4 per square foot in 2025 after a 39% four-year climb. Labor alone rose 25% in the past 12 months as migration to urban centers slowed. Volatile steel and cement pricing squeeze smaller developers that lack hedging facilities. Contractors respond by substituting locally quarried aggregates, adopting automated rebar-bending stations, and scheduling pours during off-peak power-tariff windows. Nonetheless, if wage pressures persist into 2026, marginal projects could slip beneath hurdle rates, trimming the headline growth of the India commercial construction market.
Regulatory Approval Delays
While digitized land records and single-window dashboards improve transparency, multistage clearances for environment, heritage, and utilities still stretch beyond 12 months in several states. Delays can erode internal rates of return by up to 200 basis points, prompting developers to preload legal diligence and employ parallel-track design reviews. The central government’s arbitration-settlement scheme aims to unlock stuck payments on public projects, though adoption differs among agencies. Prolonged timelines remain a material risk that tempers near-term expansion across parts of the India commercial construction market.
*Our forecasts treat driver/restraint impacts as directional, not additive. The impact forecasts reflect baseline growth, mix effects, and variable interactions.
Segment Analysis
By Commercial Sector Type: Office Dominance Amid Industrial Upswing
The Office segment captured 60.90% of 2025 revenue, illustrating the primacy of global capability centers in metros like Bengaluru and Mumbai. Workspace densification, wellness-oriented designs, and pre-certified green cores now define premium absorption patterns. The India commercial construction market size for Office assets is set to advance at a steady clip as multinationals renew long-term commitments and domestic tech firms upscale headquarters footprints. Rising preference for touch-down areas and meeting-rich layouts underpins fit-out flexibility, while landlords deploy smart sensors to track utilization and cut operating expenses.
Industrial & Logistics, energized by e-commerce and production-linked incentives, exhibits the strongest 6.84% CAGR outlook. Grade-A warehouses integrate solar rooftops, high-bay automation, and cold-chain nodes near consumption centers. Developers parcel last-mile hubs into multi-story structures that optimize expensive urban land. The India commercial construction market harmonizes industrial sheds, cross-dock facilities, and collaborative office pods within single parks to shrink tenant commute times and slash emissions. As supply chains regionalize, land acquisition along the Delhi-Mumbai Freight Corridor and Chennai-Bengaluru belt intensifies, further tilting the growth axis toward integrated industrial townships.


By Construction Type: New-Build Leadership with Retrofit Acceleration
New construction contributed 73.65% of 2025 turnover, buoyed by greenfield corridors and airport-anchored business districts. Mega-campuses allocate plugs for solar façades, daylight-harvesting skylights, and micro-grid readiness from blueprint stages. Contractors standardize precast cores and aluminum formwork to compress schedules. Capital expenditure across South India’s tech hubs keeps the India commercial construction market weighted toward fresh builds through mid-decade.
Retrofit demand, however, now rises at a 6.93% CAGR as asset owners race to align with 2030 carbon-neutral pledges. The India commercial construction market size associated with retrofits widens each time marquee towers secure LEED Platinum or GRIHA 5-Star badges. Portfolio landlords deploy digital twins to map energy leaks before prescribing envelope upgrades, high-efficiency chillers, and demand-responsive lighting. Payback periods shorten as power tariffs escalate, making deep-retrofit economics more attractive than tear-down-and-rebuild in premium micro-markets.
By Investment Source: Private Capital Pre-eminence with Public Momentum
Private investors supplied 75.10% of 2025 outlays, guided by proven strata-sale models and predictable REIT exits. Global pension funds co-develop with local giants, insuring against policy shifts while harvesting yield spreads over developed-market bonds. The India commercial construction industry records recurring club deals clustering around special economic zones and transportation overlays.
Public spending, climbing at a 7.05% CAGR, now concentrates on transit-oriented commercial precincts and digital infrastructure hubs. Maharashtra’s Maha InvIT pioneers a blended finance template that packages toll roads and adjacent retail plazas, attracting multi-tranche private commitments. States extend viability-gap grants and land-lease concessions to catalyze mixed-use anchors along highway spines. This shared-risk approach enlarges the investable canvas and mitigates cyclical volatility for the India commercial construction market.
Geography Analysis
West India retained a 39.20% share in 2025 on the strength of Mumbai’s financial ecosystem and Gujarat’s manufacturing estates. Mindspace REIT’s 90.6% committed occupancy anchors investor confidence while USD 7.47 billion in gross assets circulates back into expansion projects. Land scarcity inside Mumbai’s core nudges developers toward Navi Mumbai and Thane, where metro extensions unlock lower-cost parcels. Gujarat’s special investment regions attract battery, semiconductor, and data-center projects, reinforcing the India commercial construction market’s western tilt.
South India, projected to post a 7.48% CAGR, leverages Bengaluru’s deep tech talent and Hyderabad’s policy agility. Hyderabad has 28.7 million square feet under construction, yet vacancy could reach 24% if absorption lags. Chennai’s port-led economy underpins logistics parks that blend container yards with cross-dock pavilions. Tamil Nadu’s 2024 Space Industrial Policy earmarks land banks for aerospace clusters, inviting niche suppliers and doubling commercial demand in peri-urban belts. Power-grid upgrades and renewable corridors are pivotal to sustaining South India’s surge within the India commercial construction market.
North and East India trail in absolute value yet showcase outsized government pipeline potential. The Noida International Airport project, 80% complete on a USD 3.46 billion capex, spurs hospitality and office frontages along the Yamuna Expressway. East India aligns its port-modernization drive with inland logistics hubs, fostering integrated warehousing near Kolkata and Paradip. Central India benefits from mining-linked industrial towns and concessional land parcels. Developers calibrate go-to-market strategies around state-level incentive matrices, cognizant that regulatory throughput and utility reliability vary widely across the India commercial construction market.
Regulatory Landscape
India's commercial construction activity operates under a multi-layered framework covering national laws (including the Real Estate (Regulation and Development) Act, 2016 (RERA) and core contract and property statutes), plus state or municipal building by-laws that govern planning permissions, fire and life safety, and utilities tie-ins. On 30 April 2026, the Bureau of Indian Standards (BIS) notified National Building Construction Standards (NBCS) 2026 (SP 7:2026) as a successor reference to NBC 2016, and the practical compliance trigger depends on adoption into local by-laws, which creates state-wise transition timelines for developers and EPCs.
Environmental and waste compliance is tightening alongside digitized permitting. From 1 April 2026, the Ministry of Environment, Forests and Climate Change (MoEFCC) implementation of the 2025 Construction Waste Rules introduced Extended Producer Responsibility (EPR) obligations for developers above defined built-up area thresholds (20,000 sq m and above), pushing project teams to formalize waste segregation, take-back, and documentation. Approval workflows are also becoming more schedule-sensitive as automated plan scrutiny and single-window systems expand, including TG-bPASS in Telangana and Auto-DCR based submissions in Maharashtra bodies such as MCGM and PMC, as well as processes tied to Delhi authorities, with CAD-compliant digital submissions and portal-based tracking shaping execution discipline.
Value Chain Analysis
The India commercial construction value chain starts with land assembly and development planning (developers, financiers, and legal due diligence), then moves into design (architectural and engineering consultants), procurement, and execution (EPC contractors and specialist subcontractors for MEP, facades, and fit-outs). Commissioning and operations follow, where property managers and facility operators translate technical specifications into lifecycle performance. Funding and de-risking mechanisms are now more closely intertwined with delivery, as REIT-backed recycling of stabilized assets into new builds, institutional joint ventures, and long-term pre-lease commitments influence design choices such as floorplate modularity, ESG features, and uptime standards for data centers.
Upstream inputs include cement, steel, aggregates, glass, HVAC, electrical equipment, and prefabricated elements, while project logistics and labor availability frequently constrain schedules. Industry evidence points to bottlenecks such as land acquisition, late material deliveries, and skilled labor shortages, and the supply side also faces risk from potential raw-material constraints for metals (steel, copper, aluminum) without adequate logistics and policy follow-through. On logistics, initiatives such as the National Logistics Policy and the Unified Logistics Interface Platform (ULIP) are used to improve shipment visibility and reduce friction across multimodal movement. The delivery ecosystem is further pulled by large, infrastructure-linked commercial hubs (including airport city developments and hyperscale data-center campuses), which require tighter coordination of heavy equipment movement, power and fiber readiness, and specialized MEP supply chains.
Competitive Landscape
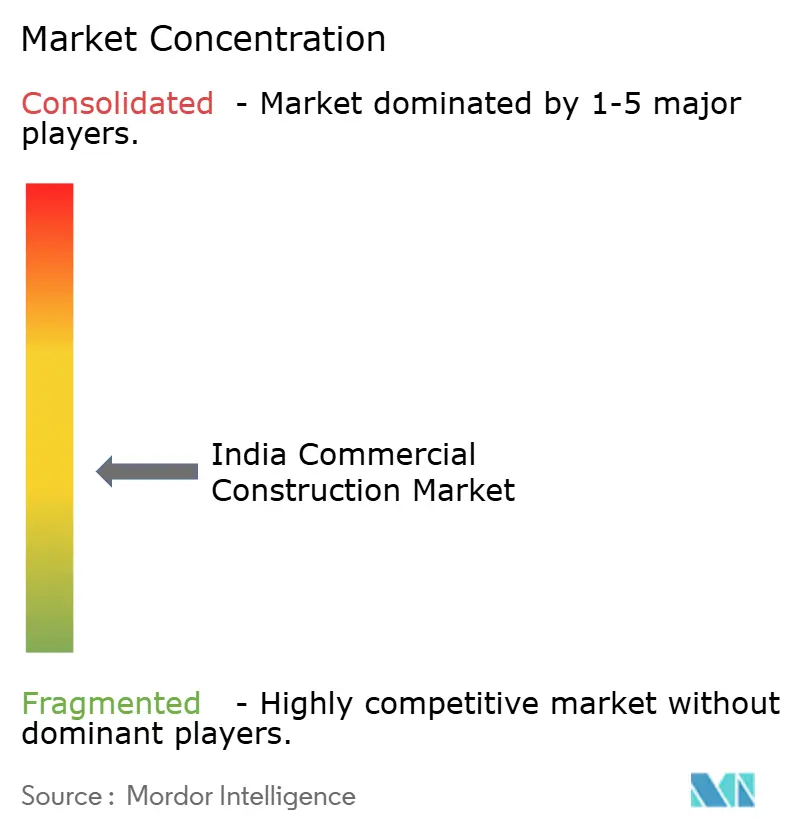
Competition remains moderately fragmented as incumbents such as DLF, Prestige, and Lodha sustain multi-city brand equity and institutional funding access. Adani Group’s negotiations to buy Emaar India for USD 482–603 million illustrate a consolidatory impulse that can quickly reshape regional hierarchies. Market leaders differentiate via intelligent building-management platforms, zero-defect handover protocols, and end-to-end project management offices that compress cycle times.
Engineering-procurement-construction conglomerates like Larsen & Toubro reported double-digit revenue growth and USD 9.65 billion in fresh orders for Q2 FY 2025, underlining the advantage of integrated design-to-build capabilities. These giants pilot drone-enabled progress monitoring and 3D concrete printing to elevate productivity. Mid-tier specialists capture niche pockets in data-center fit-outs, façade engineering, and ESG retrofits, often partnering with global contractors to climb the complexity curve.
Regulatory oversight through RERA enhances consumer trust by mandating escrowed customer advances and time-bound delivery covenants. Compliance costs, though, skew in favor of capital-rich platforms, prompting smaller developers to pivot toward joint ventures or exit outright. Green building expertise, advanced modular construction, and pan-India land pipelines will continue to define competitive moats in the India commercial construction market through 2030.
India Commercial Construction Industry Leaders
DLF Ltd.
Prestige Group
Macrotech Developers (Lodha)
Embassy Group
Brigade Enterprises
- *Disclaimer: Major Players sorted in no particular order

Market Opportunities and Future Outlook
Public capex and structured PPP pipelines are expanding the addressable canvas for commercial formats tied to mobility and civic infrastructure. Union Budget 2026-27 increased public capital expenditure to INR 12.2 lakh crore (from INR 11.2 lakh crore in FY2025-26), while the Department of Economic Affairs rolled out a three-year PPP pipeline spanning 852 projects valued at over INR 17 lakh crore. These programs create a clearer demand runway for commercial construction around transit-oriented nodes, airport-linked districts, and public-asset-adjacent mixed-use precincts, particularly where states provide land-lease and viability-support mechanisms.
Private capital rotation is also narrowing toward specialized commercial assets, where tenant requirements raise technical specifications and fit-out intensity. Data centers are drawing real estate private equity, reported as the largest destination for PE inflows in H1 2026, including a 38% share of inflows in Q2 2026, which reinforces momentum behind power-dense campuses and resilient MEP packages. In execution, industrialized delivery and digital coordination offer another route to differentiation, with organizations such as NCRTC using BIM for Namo Bharat station design and coordinating through the APARIMIT BIM lab at Duhai Depot, indicating a shift toward model-based delivery even as national BIM standards remain fragmented. Contractors and developers that can standardize ISO 19650-aligned workflows, prefabricated MEP assemblies, and traceable material logistics (including ULIP-enabled tracking) stand to improve schedule compression and compliance documentation, particularly as waste and sustainability requirements tighten.
Recent Industry Developments
- July 2026: Prestige Estates Projects Ltd signed an investment agreement to acquire a 50% stake in Advent Convention and Hotels International Ltd for around INR 504 crore to develop a commercial project in Andheri East, Mumbai (about 1.5 million sq ft, with stated gross development value of INR 4,500 crore). The transaction strengthens Prestige's commercial position in Mumbai and adds an execution-ready pipeline supported by a partner-led structure. It also reflects continued appetite for scaling through platform and project-level investments rather than relying only on organic land aggregation.
- June 2026: Prestige Group and Bangalore Airport City Ltd (BACL) entered a partnership to develop a convention center on a 14.2-acre parcel at Bangalore Airport City, with an investment of about INR 1,800 crore. The project ties commercial construction demand to airport-driven mixed-use ecosystems where hospitality, events, and retail can cluster alongside business parks. It highlights how developers are packaging destination assets to diversify cash flows beyond traditional office towers.
- August 2025: Knowledge Realty Trust raised about USD 578 million in a REIT IPO, covering a large portfolio across Mumbai, Bengaluru, and Hyderabad. The listing expanded institutional liquidity for stabilized commercial assets and reinforced the recycling pathway from completed projects into fresh development capital. This funding mechanism supports faster capital rotation for developers with REIT-grade office portfolios.


Research Methodology Framework and Report Scope
Market Definition and Coverage
This market covers the total value of commercial building construction activity in India, tracked as spending on building creation and upgrades across common commercial end uses, and measured in USD for the stated base year and forecast period.
Scope exclusions: It excludes residential housing, heavy civil infrastructure (roads, rail, airports, ports), and pure engineering design-only services that do not result in executed construction work value.
Segmentation Overview
- By Commercial Sector Type
- Office
- Retail
- Industrial and Logistics
- Others
- By Construction Type
- New Construction
- Renovation
- By Investment Source
- Public
- Private
- By Region
- North India
- South India
- West India
- East India
- Central India
Data Sources, Market Sizing, and Validation
Desk Research
Desk research was used to set the starting point for India project activity, spending direction, and regional demand signals. We reviewed public sources such as MOSPI national accounts, the Reserve Bank of India credit and interest rate series, DPIIT FDI releases for construction and real estate, and National Statistical Office publications that help explain investment cycles and price pressures.
To translate activity into market value, we also referenced CPWD and state schedule of rates where available, and materials price series and tender notices from central and state procurement portals, along with builder and developer annual reports and investor presentations. Select paid databases for company financials and news were used to cross-check revenue pools, project awards, and timing of large developments. The sources listed above are illustrative, and many other public documents and datasets were also referred to for data collection, validation, and clarification.
Primary Interviews and Surveys
Primary work focused on validating what is truly getting built and paid for, and how project budgets are moving across offices, retail, and industrial and logistics assets. We spoke with a mix of contractors, EPC staff, subcontractors, material distributors, consultants, and asset owners to confirm typical project sizes, renovation shares, execution timelines, and the impact of approvals and funding.
Coverage was balanced across major construction hubs, with added checks in fast-growing secondary cities so regional mix assumptions did not get overfit to a few metros.
Distribution of primary research fieldwork respondents
| Company type | Respondent position | Region |
|---|---|---|
| Top tier: 34% | CXOs: 15% | |
| Mid tier: 51% | Functional/Unit leaders: 36% | |
| Smaller Players: 15% | Managers: 49% |
Market-Sizing & Forecasting
Sizing was built using a top-down approach, where construction output and investment signals are reconstructed into commercial building spend, and then filtered using India-specific mix factors for offices, retail, and industrial and logistics. Once the first total was obtained, selective bottom-up checks were used, such as sampled project ticket sizes multiplied by observed project counts, along with contractor revenue splits and channel feedback on billing cycles, to adjust for timing gaps.
Key inputs that shaped the model included new construction versus renovation share, typical cost-per-square-foot ranges by asset type, the pipeline of planned and awarded projects, lending conditions for developers and occupiers, and materials and labor cost inflation that changes the value even when volumes are steady. Where bottom-up signals were patchy in smaller cities, the missing pieces were handled through calibrated regional ratios anchored to interview ranges and public project announcements.
For forecasting, we leaned on scenario analysis supported by expert consensus, where macro variables (rates, credit availability, and capex intent) and sector drivers (office absorption outlook, retail leasing recovery, and warehousing demand) are translated into spend growth, and then tested against execution capacity constraints.
Data Validation & Update Cycle
Estimates were triangulated using multiple independent checks, including construction spending direction in national accounts, visible tender activity, and a sanity check against large contractor commercial exposure. Outliers were flagged early, followed by a second-pass review of assumptions like cost inflation, renovation intensity, and the timing of delayed projects before numbers were finalized.
We also re-contact sources when the model shows sharp shifts that cannot be explained by known policy or funding changes, so the final story matches market reality. Reports are refreshed annually, and interim updates are made when material events occur, such as major budget changes, rate shocks, or unusually large project awards. Before delivery, the latest news and data points are reviewed one more time so clients receive an updated view.
Mordor Intelligence's India Commerical Construction Market Estimate Compared With Other Published Estimates
Published market size figures for India commercial construction often look far apart because the word commercial is treated differently across sources, and because project value can be booked at different stages. Currency conversion timing, inflation handling, and whether renovation is included can also shift a USD value even when underlying activity stays similar.
Heavy civil infrastructure spending (such as metros and highways) sits outside Mordor Intelligence's scope, and that single inclusion difference usually explains why some publicized totals look much larger than a pure commercial building construction number. Another driver is how the value is counted, since some estimates mix real estate transaction values or leasing proxies with construction spend, and others apply aggressive growth assumptions without project pipeline checks or regional mix validation.
Benchmark comparison
| Source | Market Size | Gaps in Research Methodology |
|---|---|---|
| Mordor Intelligence | USD 181.31 B (2025) | |
| Regional Consultancy A | USD 65.00 B (2024) | Uses a narrower definition focused mainly on select building types and may not fully capture India-wide execution value across new build plus renovation, which tends to understate totals when compared with full commercial construction spend. |
| Industry Publisher B | USD 220.00 B (2025) | Likely includes adjacent construction categories, and it can also uplift values using high inflation or aggressive pipeline conversion without consistent checks on what was actually awarded and executed in the year. |
The table shows that the spread is mainly explained by what gets counted as commercial construction and when the value is recognized, rather than a simple math difference. By tying the estimate to project execution signals, cost progression, and regional mix checks, the final number stays traceable to repeatable inputs that can be re-tested when new awards, funding, or price trends shift.


Key Questions Answered in the Report
What is the current value of the India commercial construction market?
The India commercial construction market size is USD 191.12 billion in 2026 and is forecast to reach USD 248.69 billion by 2031.
Which segment is expanding fastest within Indian commercial real estate?
Industrial & Logistics projects lead with a projected 6.84% CAGR through 2031, buoyed by e-commerce fulfillment and manufacturing relocation.
How large is the public spending pipeline that supports commercial building activity?
Government allocations of USD 135.1 billion for FY 2025-26 and state-level initiatives such as Maha InvIT sustain a multi-year pipeline of publicly aided projects.
Why are data centers so pivotal to future commercial construction demand?
National IT load is set to more than double by 2026, requiring over USD 6 billion in specialized construction that incorporates high-density cooling and resilient power.
What strategies help developers mitigate rising construction costs?
Firms increasingly rely on local material substitution, prefab concrete systems, and digital project-management tools to offset inflation and accelerate schedules.
Page last updated on:






