
Market Overview
| Study Period | 2020 - 2031 |
|---|---|
| Forecast Data Period | 2026 - 2031 |
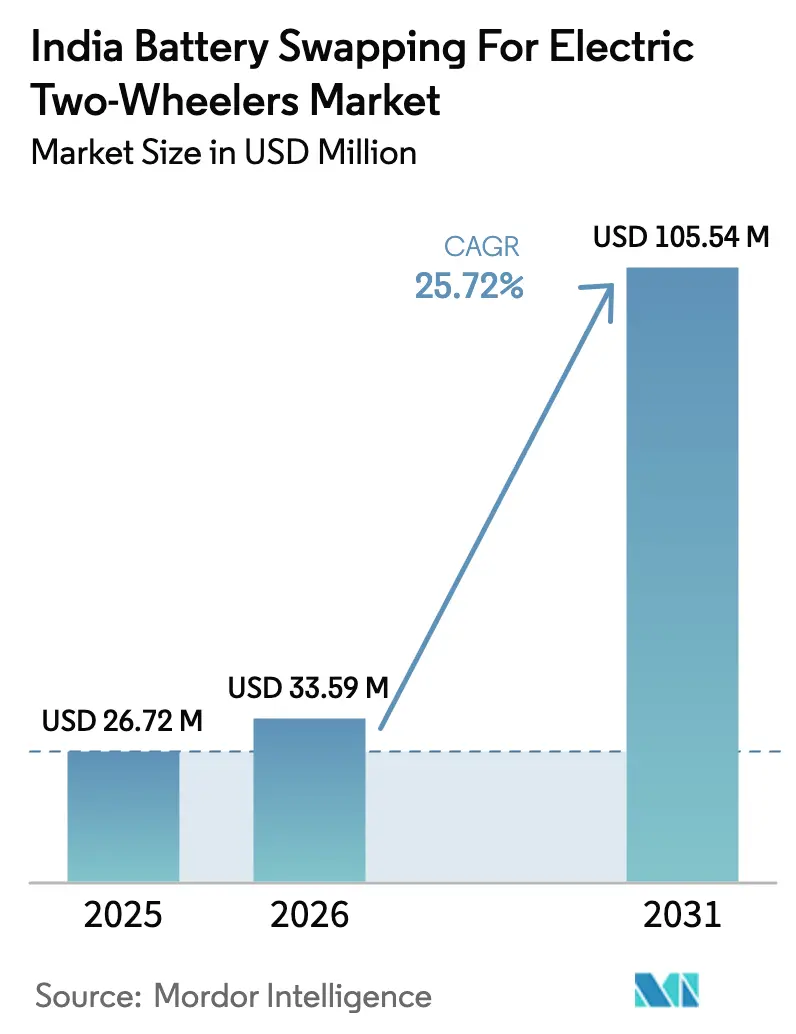
| Base Year Market Size (2025) | USD 26.72 Million |
| Market Size (2026) | USD 33.59 Million |
| Market Size (2031) | USD 105.54 Million |
| Growth Rate (2026 - 2031) | 25.72 % |
| Market Concentration | Medium |
Major Players *Disclaimer: Major Players sorted in no particular order Image © Mordor Intelligence. Reuse requires attribution under CC BY 4.0. | |
India Battery Swapping For Electric Two-Wheelers Market Analysis by Mordor Intelligence
The India battery swapping for electric two-wheelers market size was valued at USD 26.72 million in 2025 and estimated to grow from USD 33.59 million in 2026 to reach USD 105.54 million by 2031, at a CAGR of 25.72% during the forecast period (2026-2031). Rapid sales growth in electric two-wheelers, federal and state-level purchase incentives, and a maturing venture-capital pipeline are reinforcing confidence that swapping infrastructure will underpin India’s broader electrification roadmap. The transition from FAME-II to the PM E-DRIVE scheme sustains direct purchase subsidies while earmarking funds for interoperable packs and Internet-of-Things (IoT) battery monitoring, ensuring that subsidies translate into real-world utilization. Private capital from oil-marketing companies (OMCs) and global investors is speeding up station deployment, and the introduction of Bureau of Indian Standards (BIS) safety norms is unlocking institutional lending. Mobile kiosk formats now complement fixed cabinets, raising network density without equivalent real-estate costs. Fragmented pack designs, tax ambiguity, and import-dependent cell supply remain headwinds, yet domestic cell manufacturing under the Production-Linked Incentive (PLI) program is set to soften these risks.
Key Report Takeaways
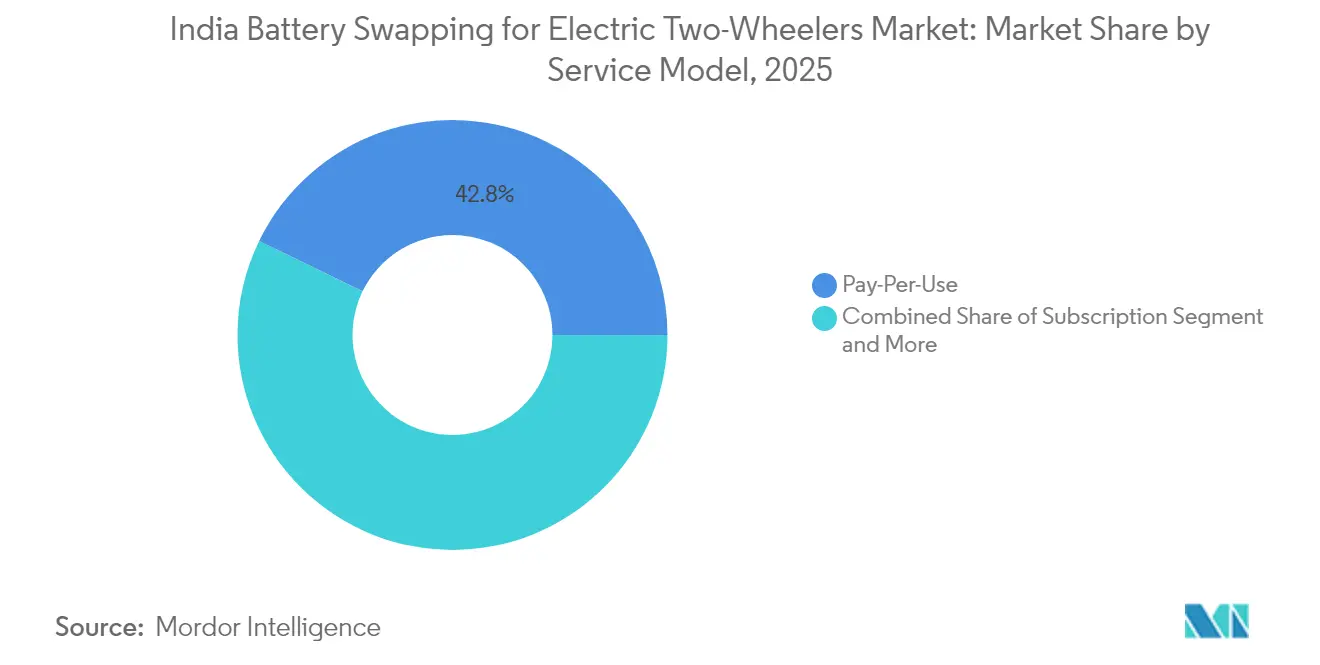
- By service model, the Pay-Per-Use option held 42.80% of the Indian battery swapping for electric two-wheelers market share in 2025, while subscription plans are projected to expand at a 27.36% CAGR through 2031.
- By battery chemistry, lithium-ion NMC/NCA commanded 62.40% of the Indian battery swapping for electric two-wheelers market size in 2025; lithium-iron-phosphate (LFP) variants are advancing at a 27.70% CAGR to 2031.
- By vehicle category, electric scooters captured 68.65% of the Indian battery swapping for electric two-wheelers market share in 2025, and electric motorcycles are forecast to post the fastest 28.10% CAGR through 2031.
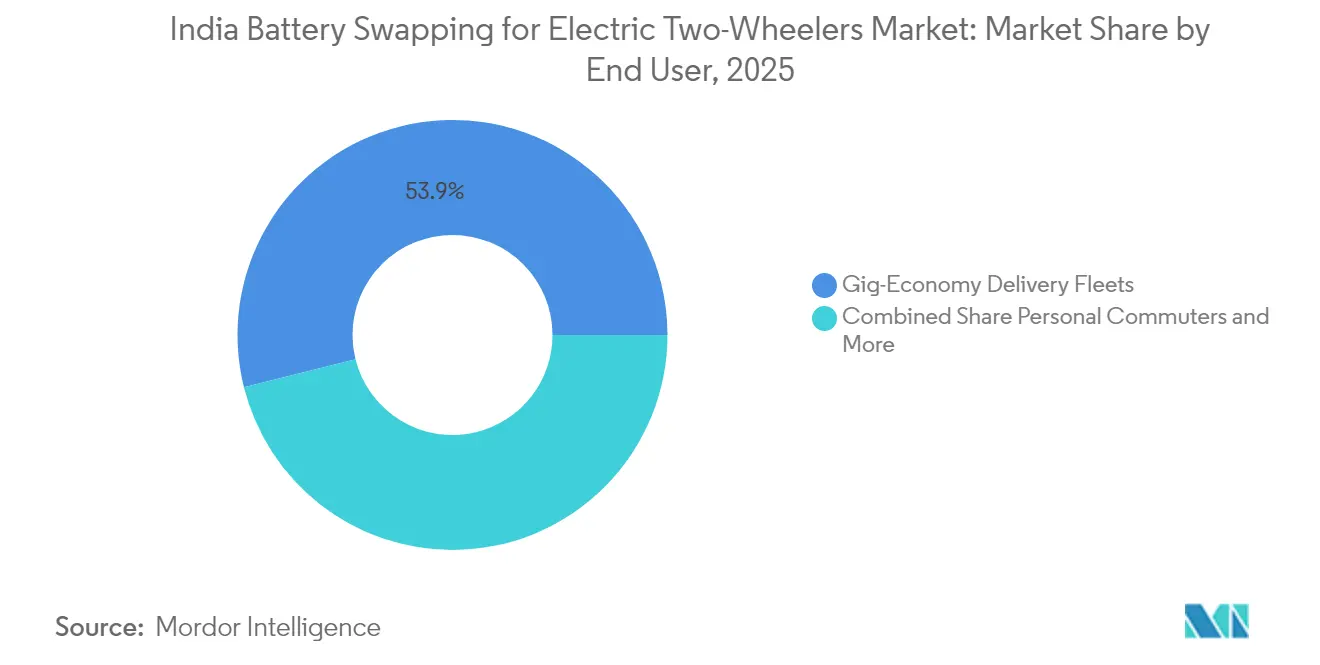
- By end user, gig-economy fleets accounted for a 53.90% share of the Indian battery swapping for electric two-wheelers market size in 2025 and are progressing at a 26.55% CAGR to 2031.
- By battery capacity, 2.1-3.0 kWh packs dominated with 62.95% of the Indian battery swapping for electric two-wheelers market share in 2025, whereas the 3.1-5.0 kWh band is projected to expand at a 26.40% CAGR through 2031.
- By swap station type, fixed cabinets led with 75.90% of the Indian battery swapping for electric two-wheelers market share in 2025; mobile kiosks are growing at a 27.30% CAGR to 2031.
Note: Market size and forecast figures in this report are generated using Mordor Intelligence’s proprietary estimation framework, updated with the latest available data and insights as of 2026.
India Battery Swapping For Electric Two-Wheelers Market Trends and Insights
Drivers Impact Analysis*
| Driver | (~) % Impact on CAGR Forecast | Geographic Relevance | Impact Timeline |
|---|---|---|---|
| Gig-Economy Downtime Demand | +6.3% | Metro delivery hubs | Short term (≤ 2 years) |
| VC and OMC Investments | +5.1% | Urban centers to Tier-II cities | Medium term (2-4 years) |
| FAME-II E2W Sales Growth | +4.2% | National; Maharashtra, Karnataka, Tamil Nadu | Short term (≤ 2 years) |
| Li-Ion Cost Decline | +3.9% | Tamil Nadu, Gujarat | Long term (≥ 4 years) |
| Battery Swapping Policy | +3.8% | National metro clusters | Medium term (2-4 years) |
| BIS Safety Standards | +2.7% | Nationwide | Medium term (2-4 years) |
| Source: Mordor Intelligence | |||
Rapid Growth in E-Two-Wheeler Sales Via FAME-II Incentives
PM e-DRIVE was approved on June 26, 2025, with an outlay of ₹10,900 crore for 2024-25 to 2028-29 to support demand incentives for EVs. With the phasing out of previous subsidy schemes, manufacturers are channeling their efforts into innovation and operational efficiency to maintain price competitiveness. Adoption is rising, especially in states like Maharashtra, Karnataka, and Tamil Nadu, which offer extra incentives. This has led to a broader user base, many turning to battery-swapping infrastructure for its convenience and cost benefits.
Declining Li-Ion Costs and Localization of Pack Assembly
India is witnessing a pivotal shift in its battery ecosystem, with domestic production lines poised to commence operations. This transition aims to curtail import dependence, alleviate foreign exchange strains, and trim overall expenses. Lithium iron phosphate (LFP) is gaining traction among battery chemistries, especially for high-usage applications like swapping, due to its extended lifespan and cost-effectiveness compared to other options.
Domestic manufacturing fosters nimble supply chains, facilitating just-in-time deliveries and diminishing the necessity for extensive inventory. Moreover, standardized battery housings for robotic handling enhance operational efficiency. As these efficiencies accumulate, subscription costs are anticipated to decrease, broadening the accessibility of electric mobility and amplifying market reach.
Draft Battery Swapping Policy Enabling Interoperability
NITI Aayog’s draft framework specifies connector design, communications, and pack dimensions, removing the most significant barrier—platform fragmentation—by forcing OEM alignment[1]“Draft Battery Swapping Policy,”, NITI Aayog, niti.gov.in. BIS fire-safety testing complements the technical mandate, while clear liability definitions build lender confidence. Early rollouts in Delhi and Bengaluru serve as proof points, and phased geographic expansion is expected to trigger demand in Tier-II cities. Standardization curbs capex per station because operators carry fewer SKUs, and riders can choose any network, mirroring the convenience of gasoline refueling.
BIS Safety Standards Unlocking Financing and Insurance
BIS certification enforces thermal-runaway tests, ingress protection, and live data logging, reducing fire claims that once spooked insurers[2]“Safety Standards for Swappable Batteries,”, Bureau of Indian Standards, bis.gov.in. Standardized risk scores now allow underwriters to price premiums competitively, and lenders treat batteries as recoverable collateral, unlocking working-capital lines. IoT telemetry captures cycle counts, depth-of-discharge, and temperature anomalies, enabling predictive maintenance that sharply reduces catastrophic failures.
Restraints Impact Analysis*
| Restraint | (~) % Impact on CAGR Forecast | Geographic Relevance | Impact Timeline |
|---|---|---|---|
| Fire Safety Concerns | -4.2% | Nationwide | Short term (≤ 2 years) |
| Fragmented Battery Formats | -3.4% | Nationwide | Medium term (2-4 years) |
| Import-Dependent Cell Supply | -2.8% | Nationwide | Long term (≥ 4 years) |
| GST Uncertainty on BaaS | -2.1% | Nationwide | Short term (≤ 2 years) |
| Source: Mordor Intelligence | |||
Fire-Safety Incidents Dent Consumer Confidence
Safety concerns loom large over the electric two-wheeler market, especially when incidents gain traction on social media. Even when fires stem from unauthorized aftermarket conversions, the public often generalizes the risk across the entire category.
While regulatory standards like BIS norms provide a framework for safer products, merely adhering to these standards isn't enough to rebuild consumer trust. To reassure price-sensitive buyers and maintain momentum in the shift to electric mobility, it's crucial to ensure consistent safety performance, conduct transparent investigations, and communicate incidents clearly.
Import-Dependent Cell Supply Exposed to Geo-Political Risk
India's battery supply chain, heavily dependent on Chinese imports, faces significant geopolitical and currency-related risks. Disruptions, be they trade tensions or currency fluctuations, can swiftly escalate costs or limit availability. This scenario compels operators to maintain larger inventories as a safeguard, tying up working capital and complicating financial planning—especially for the rapidly evolving electric mobility sector.
Although government-backed initiatives promise a surge in domestic production capacity in the coming years, the current landscape remains precarious. Until local manufacturing achieves scale, the sector will grapple with supply-chain volatility, jeopardizing cost stability and operational agility.
*Our forecasts treat driver/restraint impacts as directional, not additive. The impact forecasts reflect baseline growth, mix effects, and variable interactions.
Segment Analysis
By Service Model: Subscription Plans Capture Fleet Wallet Share
Subscription plans increased their footprint even though the Pay-Per-Use option retained 42.80% of 2025 revenue. Commercial fleets value fixed monthly outlays and off-balance-sheet treatment, helping the subscription segment log a forecast 27.36% CAGR. Hero MotoCorp’s July 2025 VIDA VX2 launch separates chassis and battery financing, showcasing OEM agility in serving gig-economy clients.
Subscription contracts convert capex into opex, mitigating the 30-40% battery cost that often stalls purchases. Tiered plans from Battery Smart align pricing with daily-kilometer bands, ensuring fleets avoid overpaying during slack demand. Predictable revenue streams lower lenders’ risk, reducing interest burdens. Individual commuters still lean toward Pay-Per-Use to avoid fixed commitments, while fleet-leasing hybrids fill mid-tenure niches.


By Battery Chemistry: LFP Gains Traction on Cost and Safety
Lithium-ion NMC/NCA held 62.40% share in 2025, yet LFP’s 27.70% CAGR suggests the safety-value trade-off tilts in its favor. LFP’s 3,000–5,000 cycle life pairs naturally with high-throughput swapping, and inherent thermal stability curbs fire risks, a vital reputation safeguard.
OEM moves validate the shift: Ola Electric’s Gen 3 platform pivots to LFP, while domestic cell lines favor iron-phosphate chemistry due to raw-material availability. The India battery swapping for electric two-wheelers market size tied to LFP packs is forecast to close the gap with NMC by 2031 as vertical integration compresses pack costs. Lead-acid persists only in low-speed, sub-25 km/h vehicles, a niche eroding fast as lithium prices fall.
By Vehicle Category: Motorcycles Deliver the Next Wave
Scooters still ruled 68.65% of 2025 volumes, but motorcycles are sprinting at 28.10% CAGR thanks to Ola’s Roadster and upmarket entries from TVS and Hero. Higher payload and range make motorcycles attractive to inter-city couriers and ride-hail fleets, preparing the segment to narrow the share gap by decade’s end.
The India battery swapping for electric two-wheelers market share attributed to scooters remains robust in metro commuting, yet motorcycles are expected to dominate incremental growth. Mopeds continue to serve price-sensitive buyers exempt from licensing, but technology trickle-down and cheaper packs will erode this low-speed moat.
By End User: Gig-Economy Fleets Anchor Early Scale
Gig-platform fleets constituted 53.90% of 2025 demand, and ride-sharing subscriptions are rising at a 26.55% CAGR. Aggregated kilometers stabilize station loads, improving payback periods. Personal commuters lag due to station density and higher per-kilometer swap costs versus cheap home charging, but network expansion may unlock latent demand.
Platform-level procurement drives pack standardization as fleet operators pressure OEMs for interchangeable modules. The Indian battery swapping for electric two-wheelers market size linked to the gig economy will stay dominant until personal usage overtakes commercial kilometers in the latter half of the decade.
By Battery Capacity: Extended-Range Packs Scale Up
Packs between 2.1 kWh and 3.0 kWh held 62.95% share in 2025; 3.1–5.0 kWh variants are scaling at a 26.40% CAGR as riders seek longer routes without mid-shift swapping. Honda’s 1.5 kWh module for the Activa e: illustrates low-capacity standardization, while Ola’s dual-pack S1 Z covers 75–146 km ranges with modular add-ons.
Higher energy density and falling dollars per kWh reduce weight penalties, making bigger packs feasible without sacrificing handling. Extended-range packs let operators tier pricing by range bands when tied to subscription models, broadening consumer choice.
By Swap Station Type: Mobile Kiosks Bridge Accessibility Gaps
Fixed cabinets comprised 75.90% of active stations in 2025, but mobile kiosks are racing ahead at a 27.30% CAGR. These trailer-based or containerized units sidestep high street rents and expedite permits, crucial for dense markets like Delhi, where real estate costs stifle fixed deployment.
Mobile formats allow operators to pilot new catchments, relocating under-performing assets with minimal sunk cost. The Indian battery swapping for electric two-wheelers market size tied to mobile kiosks is modest today, yet pivotal for Tier-III towns that cannot sustain permanent infrastructure initially. As labor costs rise, automated robotic systems are emerging in premium hubs, while retail-integrated “battery ATMs” exploit existing foot traffic.
Geography Analysis
Maharashtra recorded 211,880 electric two-wheeler registrations in FY 2025, representing 18% of national volume, cementing its lead through additive state subsidies and a mature automotive cluster . Karnataka followed with 148,254 units, benefiting from Bengaluru’s tech ecosystem and Ather’s home-based effect. Tamil Nadu hosted 118,836 units and anchors the south-India manufacturing corridor, including Ola’s Gigafactory and TVS Motor.
India's EV adoption shows regional disparities, with Uttar Pradesh leading in total EV sales but lagging in electric two-wheeler uptake. This signals growth potential as battery-swapping infrastructure expands. Gujarat faces a slowdown, indicating early saturation and the need for renewed incentives. High real estate costs in Delhi hinder fixed swapping stations, but mobile kiosks offer a flexible solution. Localized strategies and infrastructure are crucial to unlocking India's electric two-wheeler market.
Regional deployment mirrors policy agility. Honda Power Pack Energy India is staging 500 swap stations across Bengaluru, Delhi, and Mumbai by March 2026 via partnerships with HPCL, metro rail operators, and Adani Electricity. Progressive states streamline land allotment and provide tariff rebates, shaving upfront costs. Demonstration success in these corridors galvanizes investor confidence to seed stations in secondary cities such as Coimbatore and Jaipur.
Regulatory Landscape
India's battery swapping framework continues to evolve through a mix of central guidelines, draft interoperability proposals, and safety standards. NITI Aayog's Battery Swapping Policy Draft (April 2022) set interoperability principles around connectors, communications, and pack considerations, while as of June 2026 a comprehensive national policy remained under review by the Ministry of Heavy Industries, with the focus widening to economic viability alongside standardization.
On operations and safety, the Ministry of Power's 2025 guidelines for installation and operation of EV charging infrastructure formally recognize battery swapping and provide an enabling basis for swapping-station operations under existing electricity connections. Safety and traceability requirements are also tightening through BIS and automotive standards, including BIS IS 17896 (Part 2: 2022) for swap system safety and AIS-156 Amendment 4, which defines swappable packs and station requirements such as RFID-based tracking of battery history and state-of-health, supporting clearer liability boundaries for insurers and lenders.
Value Chain Analysis
The value chain covers cell and pack manufacturing and assembly, battery management systems and software platforms (including IoT telemetry and diagnostics), swapping-cabinet and power-electronics suppliers, station and network operators, and vehicle OEMs that integrate swappable architecture into scooters and motorcycles. Operators such as SUN Mobility and Battery Smart typically own or finance battery inventory and swapping cabinets, while OEM participation varies by model, ranging from direct ecosystem involvement to partnerships that embed swapping access at the point of sale.
Interoperability remains a friction point across the chain. Some OEMs stay cautious about common battery specifications because proprietary BMS logic, vehicle packaging, and safety liability are linked to differentiation and warranty risk. Standards-led traceability, including RFID tagging referenced in AIS-156 Amendment 4, strengthens asset tracking and lifecycle management, which supports refurbishment, redeployment, and end-of-life routing. Policy programs such as PM E-DRIVE primarily support the broader electrification push, and they can indirectly support site electrification and deployment readiness for networks.
Competitive Landscape
Early station operators carved a share via speed-to-market, but scale now hinges on capital depth and strategic alliances. Battery Smart surpassed 1,000 stations in 2024 across 30 cities after attracting Tiger Global and responsAbility debt, holding nearly 15% of operational cabinets. Sun Mobility, partnered with Indian Oil Corporation, leverages national pump networks to roll out multi-format stations, while RACEnergy dominates in the three-wheeler niche.
OEM integration is a rising moat. Ola Electric’s vertical stack combines cell production, battery management systems, and vehicle hardware, lowering the bill of materials and tightening feedback loops. Honda’s dedicated subsidiary injects global quality benchmarks and retail muscle, raising the competitive bar. Smaller independents are responding with interoperability coalitions and co-branded packs to avoid isolation in a standardizing ecosystem.
M&A chatter is increasing as infrastructure intensity demands larger balance sheets. Sun Mobility has signaled its intent to acquire regional players to achieve sub-1 km urban station radii. Battery Smart is exploring franchise models to accelerate market entry in Tier-II towns, promising financiers minimum-guarantee returns. Overall, competitive dynamics are moving from land-grab to network-effect monetization, where customer lock-in derives from densest coverage and lowest swap downtime.
India Battery Swapping For Electric Two-Wheelers Industry Leaders
Ola Electric Mobility Ltd.
SUN Mobility
RACE Energy Limited
Upgrid Solutions Private Limited (Battery Smart)
Gogoro
- *Disclaimer: Major Players sorted in no particular order


Market Opportunities and Future Outlook
High-utilization use cases remain the clearest whitespace for swapping economics in electric two-wheelers, particularly gig-economy delivery fleets and other commercial riders that prioritize uptime and predictable operating costs. This aligns with the market structure in 2025, where gig-economy fleets accounted for 53.90% of demand and helped sustain subscription-led Battery-as-a-Service models that shift the battery's upfront cost into operating expenditure.
The near-term opportunity also includes scaling networks beyond early metro corridors through capital deployment and standardization. By mid-2026, battery swapping in India has crossed 3,000 deployed stations with more than USD 325 million in disclosed investment, while the national policy discussion has moved toward economic viability and affordability frameworks rather than interoperability alone. Work on BIS swap standards, including IS 17896 and additional parts under development, along with the Ministry of Power's 2025 operational guidelines, creates more direct pathways for financing, insurance, and multi-city rollouts, which supports broader OEM-network collaborations and more bankable station utilization models.
Recent Industry Developments
- July 2026: Battery Smart raised 124 crore INR debt funding from responsAbility Investments AG to expand its battery-as-a-service network across India. The debt funding scales the BaaS network, accelerating swap-station density and consumer access.
- July 2026: SUN Mobility launched a modular battery-swapping platform for heavy commercial vehicles (3-tonne to 55-tonne) at the Prawaas 5.0 event in Gandhinagar. The market expansion covers heavy-duty fleets, broadening addressable market beyond two and three-wheelers.
- July 2026: SUN Mobility announced a strategic separation of its technology business (software, analytics, platforms) from its India-based asset-heavy swapping network operations (IndoFast Energy, a JV with Indian Oil Corporation) to facilitate global expansion. The IT and IP separation enables scalable global monetization of software platforms while supporting asset-light expansion.


Research Methodology Framework and Report Scope
Market Definition and Coverage
For this report, the market covers revenue generated in India from battery swapping used by electric two-wheelers, including swap transactions and related subscription or service fees that enable battery access and uptime for riders and fleets.
Scope exclusions: We exclude slow charging equipment sales that do not support swapping, and we also exclude swapping revenue tied to electric three-wheelers, cars, buses, and trucks.
Segmentation Overview
- By Service Model
- Pay-Per-Use
- Subscription
- Fleet Leasing (Long-Term)
- By Battery Chemistry
- Lithium-ion (NMC/NCA)
- Lithium-ion (LFP)
- Lead-acid
- By Vehicle Category
- Electric Scooters
- Electric Motorcycles
- Electric Mopeds
- By End User
- Personal Commuters
- Gig-Economy Delivery Fleets
- Ride-Sharing / Subscription Platforms
- By Battery Capacity (kWh)
- Up to 2.0
- 2.1-3.0
- 3.1-5.0
- Above 5.0
- By Swap Station Type
- Fixed Cabinet
- Mobile Kiosk
- Fully-Automated Robotic
- Retail-Outlet Integrated (Battery ATM)
Data Sources, Market Sizing, and Validation
Desk Research
Desk research was used to set the base context for adoption, policy, and the pace at which swapping networks can expand in India. We reviewed public sources such as Ministry of Heavy Industries notifications on FAME incentives, Ministry of Road Transport and Highways vehicle registration dashboards, NITI Aayog discussion papers on swapping and interoperability, and BIS standards related to battery safety and swapping interfaces to anchor demand and compliance assumptions.
We also used India-focused EV sales and deployment statistics from government and public bodies such as Vahan where applicable. Alongside this, we reviewed secondary materials including company filings, investor presentations, credible news coverage, and association websites that track station activity and partnership announcements. Where public data was thin, we also used select paid subscriptions for company financial intelligence, news and financials screening, and patent databases to cross-check expansion plans and product-readiness claims. The desk sources mentioned here are illustrative only, and many other documents and datasets were used for data collection, validation, and clarification during the research.
Primary Interviews and Surveys
Primary work focused on validating the India-specific operating reality, since swapping economics and usage can change quickly by city and by fleet type. We spoke with battery swapping network operators, station and battery pack ecosystem participants, two-wheeler OEM-adjacent experts, fleet managers, and channel partners. The aim was to test assumptions on swap frequency, pricing, utilization, and rollout pace across major Indian demand centers.
Distribution of primary research fieldwork respondents
| Company type | Respondent position |
|---|---|
| Top tier: 34% | CXOs: 14% |
| Mid tier: 50% | Functional/Unit leaders: 39% |
| Smaller Players: 16% | Managers: 47% |
Market-Sizing & Forecasting
Sizing was built using a top-down and bottom-up approach, where a demand pool was reconstructed from the active electric two-wheeler base and the share that is actually compatible with swapping. The core math then links expected swap events per vehicle, average price per swap (or effective subscription price per swap), and network utilization to reach annual revenue.
To keep the model practical, we used a small set of inputs that stakeholders can sanity check, such as growth in electric two-wheeler sales and registrations, swap station additions and live station utilization, average swaps per day by rider and by fleet, battery pack capacity bands used in two-wheelers, and pricing structures (pay-per-swap versus monthly plans). Where a clean data series was missing, the gap was handled through city-level spot checks and ranges from expert calls, which were then tightened through repeated validation.
Forecasting was done using scenario analysis. We varied policy continuity, fleet electrification pace, and network density targets, and then tested the implied utilization and pricing outcomes against the primary inputs. The final output was corroborated with selective bottom-up checks, including sampled operator revenue logic using observed station counts and indicative swaps per station per day, and then adjusted to stay consistent with the broader demand pool constraints.
Data Validation & Update Cycle
Validation was done in layers so one unusual input did not distort the full market value. We compared outputs against independent signals such as two-wheeler EV adoption momentum, visible station deployment activity, and realistic utilization ranges shared by operators and fleet users.
Any sharp year-to-year jumps were reviewed, and assumptions were revisited when the implied swaps per vehicle, pricing, or capacity use looked out of line with India conditions. Before sign-off, the model and narrative go through multi-step analyst reviews, and follow-up calls are triggered when new policy moves, major launches, or network expansion announcements change the near-term outlook. Reports are refreshed annually, with interim updates for material events, and a fresh pre-delivery check is done so clients receive the latest view.
Mordor Intelligence's India Battery Swapping for Electric Two Wheelers Market Size Measured Against Other Published Estimates
Published market values for swapping can spread out because the boundaries are not always consistent, and also because station utilization and pricing assumptions are handled differently. We keep the comparison focused on what is counted as revenue, which vehicle types are included, and how quickly the ramp-up is assumed to happen.
The table shows a wide gap, and in Mordor Intelligence's model the value is limited to India revenue from battery swapping tied to electric two-wheelers. We check swap-frequency and effective price inputs against operator utilization discussions rather than applying a single swaps-per-day rate across all cities. Differences also show up when some estimates roll in multiple vehicle categories, use earlier base years that capture pilot-stage utilization, or convert currency using a different timing window, which can shift the reported USD value.
Benchmark comparison
| Source | Market Size | Gaps in Research Methodology |
|---|---|---|
| Mordor Intelligence | USD 26.72 M (2025) | |
| Global Consultancy A | USD 22.33 M (2025) | Often scoped to overall EV battery swapping across several vehicle types, and then split to two-wheelers using broad shares, which can miss two-wheeler specific swap revenue where station density is already high in select cities. |
| Industry Brief B | USD 10.20 M (2022) | Uses an older base year that reflects early deployments with lower utilization, and it can also mix segment weighting where three-wheelers dominate, which makes the two-wheeler swapping revenue look smaller. |
Across the three figures, the spread mainly comes from scope and timing, followed by how utilization and pricing are translated into annual revenue. By tying the model to clear levers like compatible electric two-wheeler base, swap intensity, and realized price, the estimate stays traceable and can be updated in a repeatable way as rollout speed and rider behavior shift.


Key Questions Answered in the Report
How big is India’s battery-swapping opportunity for electric two-wheelers in 2026?
The India battery swapping for electric two-wheelers market size stands at USD 33.59 million in 2026.
What CAGR is projected for battery-swapping between 2026 and 2031?
The market is expected to grow at a 25.72% CAGR over the forecast period.
Which service model is growing fastest?
Subscription plans are expanding at 27.36% CAGR as fleets favor predictable monthly costs.
Why are LFP batteries gaining share?
LFP chemistry offers 20-30% lower costs and stronger safety credentials, supporting a 27.70% CAGR through 2031.
Which Indian state leads two-wheeler electrification?
Maharashtra leads with 211,880 units in FY 2025, accounting for 18% of national sales.
Who are the major players in swapping infrastructure?
Battery Smart, Sun Mobility, RACEnergy, Ola Electric, and Honda Power Pack Energy India are the most active operators.
Page last updated on:


 Your data is secure and never sold or shared.


