
Market Overview
| Study Period | 2021 - 2031 |
|---|---|
| Forecast Data Period | 2026 - 2031 |
| Base Year Market Size (2025) | USD 12.68 Billion |
| Market Size (2026) | USD 14.01 Billion |
| Market Size (2031) | USD 23.30 Billion |
| Growth Rate (2026 - 2031) | 10.71 % |
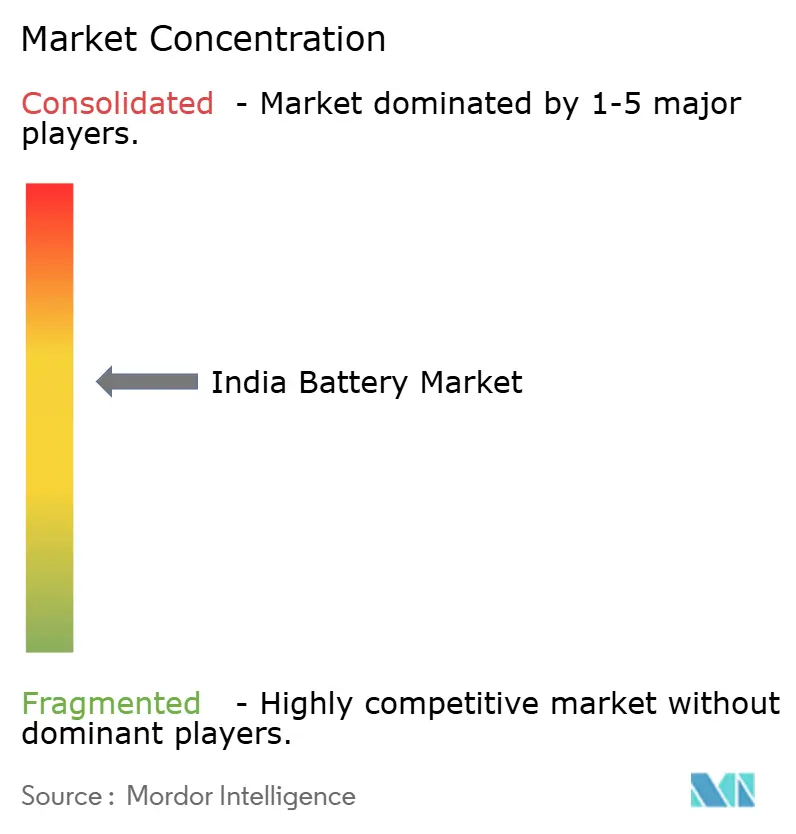
| Market Concentration | Medium |
Major Players *Disclaimer: Major Players sorted in no particular order Image © Mordor Intelligence. Reuse requires attribution under CC BY 4.0. | |
India Battery Market Analysis by Mordor Intelligence
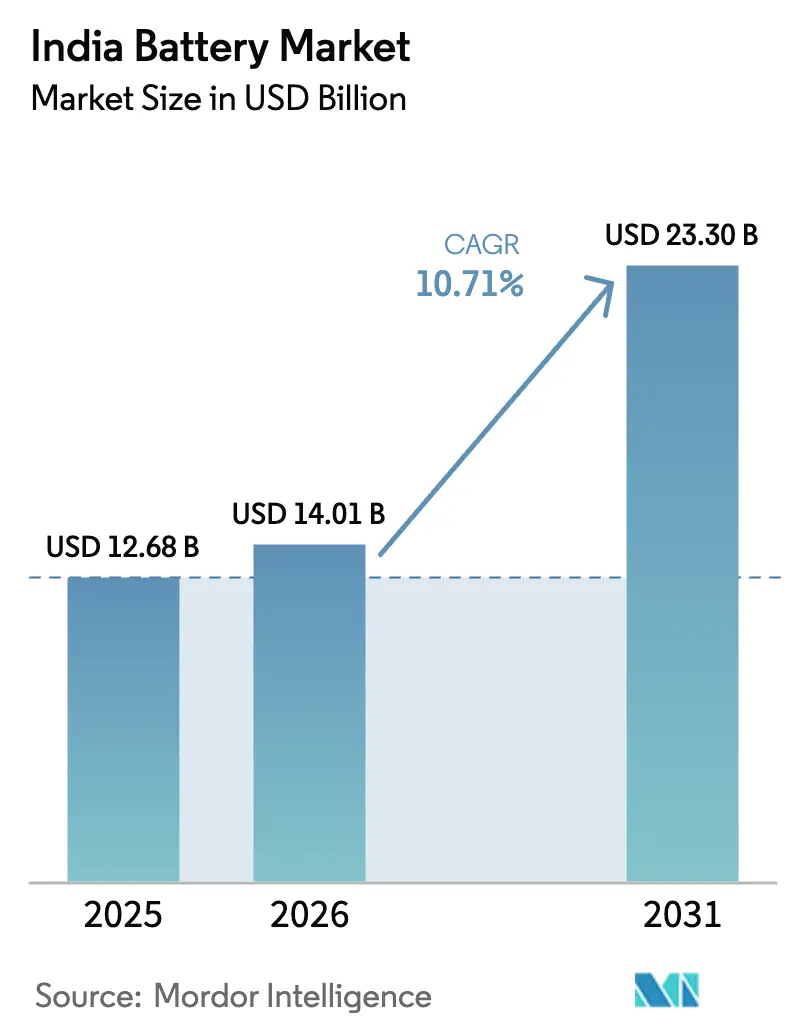
The India Battery Market size is projected to expand from USD 12.68 billion in 2025 and USD 14.01 billion in 2026 to USD 23.30 billion by 2031, registering a CAGR of 10.71% between 2026 to 2031.
Growth is propelled by rapid electrification of two- and three-wheelers, gigafactory investments under the Production-Linked Incentive for Advanced Chemistry Cell scheme, and surging demand from telecom and data-center backup segments. Declining global lithium-ion pack prices, state-level fiscal incentives, and technology migration from lead-acid to lithium-ion are compressing payback periods and widening addressable use-cases for domestic cell suppliers. Meanwhile, the India battery market is diversifying chemistry portfolios: solid-state, sodium-ion, and LFP lines are moving from pilot to commercial scale to mitigate critical-mineral exposure and improve thermal safety. Competitive intensity is shifting toward vertical integration as OEMs such as Ola Electric operationalize in-house 4680 cylindrical-cell production and legacy leaders Exide Industries and Amara Raja redirect capital expenditure to lithium-ion units.
Key Report Takeaways
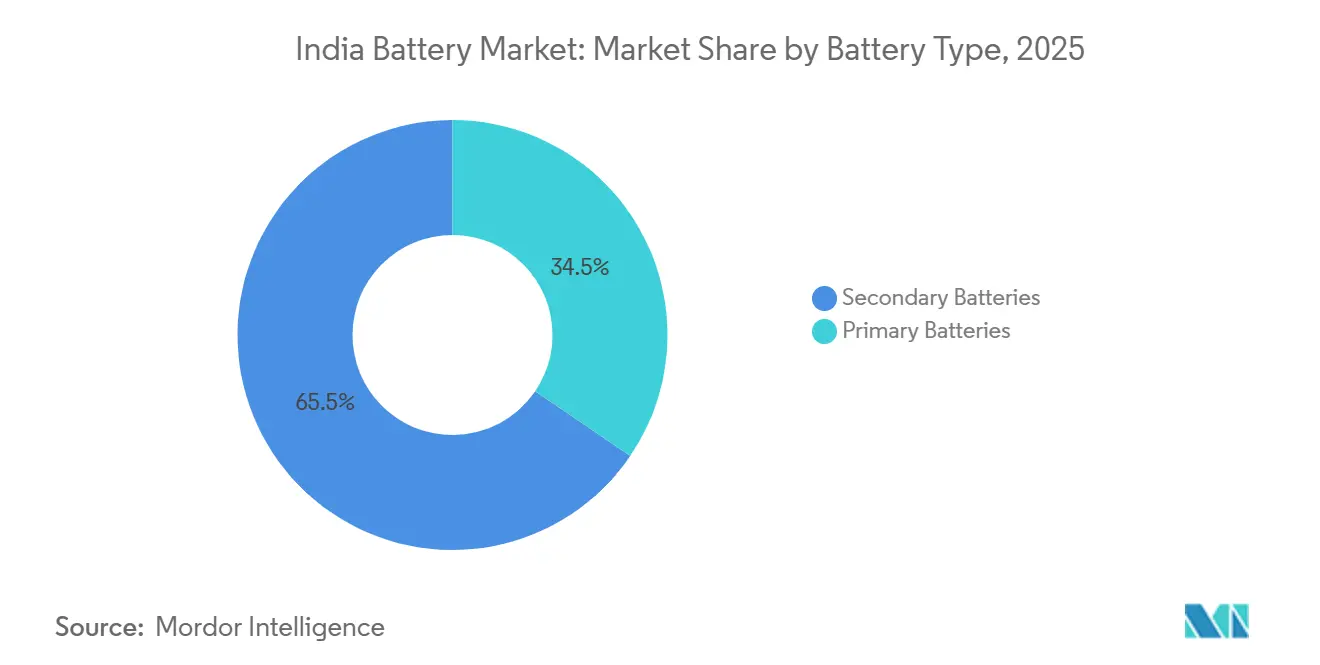
- By battery type, secondary batteries led with 65.5% revenue in 2025 and are projected to grow at a 15.9% CAGR through 2031, outpacing primary cells.
- By technology, lead-acid retained 53.2% share of the India battery market size in 2025, while solid-state batteries are forecast to expand at a 33.5% CAGR to 2031.
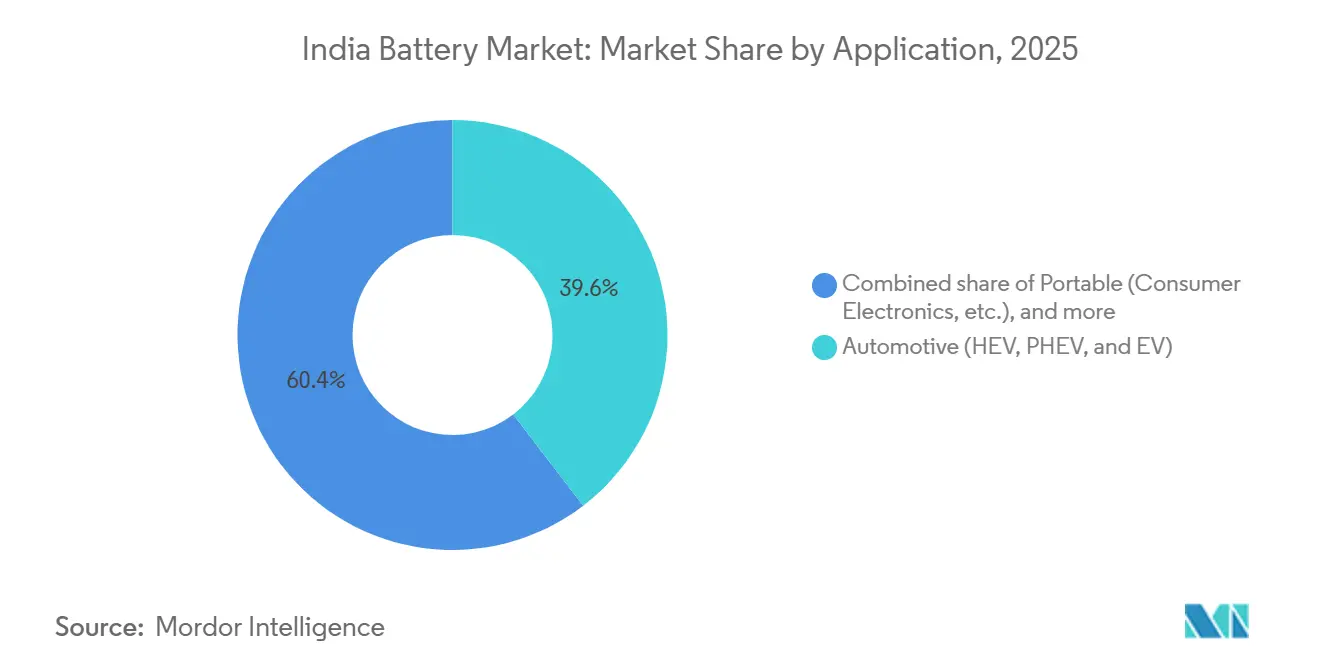
- By application, automotive captured 39.6% of India's battery market share in 2025, and the segment is advancing at a 15.2% CAGR through 2031.
Note: Market size and forecast figures in this report are generated using Mordor Intelligence’s proprietary estimation framework, updated with the latest available data and insights as of January 2026.
India Battery Market Trends and Insights
Drivers Impact Analysis*
| Driver | (~) % Impact on CAGR Forecast | Geographic Relevance | Impact Timeline |
|---|---|---|---|
| Supportive Government Incentives & Policies | +2.8% | National, with early gains in Gujarat, Maharashtra, Tamil Nadu | Medium term (2-4 years) |
| Declining Lithium-ion Battery Prices | +1.9% | National | Short term (≤ 2 years) |
| Rapid EV Adoption in Two- & Three-Wheelers | +3.2% | National, urban clusters in Bangalore, Delhi, Pune | Short term (≤ 2 years) |
| Expanding Telecom & Data-Center Backup Needs | +1.5% | National, metro hubs | Medium term (2-4 years) |
| PLI-ACC Scheme Catalyzing Domestic Gigafactories | +2.1% | Gujarat, Karnataka, Tamil Nadu | Long term (≥ 4 years) |
| Emergence of Sodium-ion & Alt-Chemistries | +0.9% | National, pilot clusters in Gujarat | Long term (≥ 4 years) |
| Source: Mordor Intelligence | |||
Supportive Government Incentives & Policies
Multi-tiered fiscal measures are lowering entry barriers across the India battery market. The PM E-DRIVE scheme, launched in 2024 with a Rs 10,900 crore (USD 1.3 billion) corpus, extends demand incentives to e-ambulances and e-trucks, broadening the subsidy horizon beyond FAME-II, which had earlier supported 1.6 million electric vehicles.[1]Press Information Bureau, “Cabinet Approves PLI Scheme for Advanced Chemistry Cell (ACC) Battery Storage,” pib.gov.in Maharashtra’s 2025 EV policy adds capital subsidies of up to Rs 10 lakh per charging station, while Tamil Nadu waives road tax and registration fees until 2030 to accelerate fleet turnover.[2]Ministry of Heavy Industries, “FAME-II Scheme Performance Report FY 2024-25,” mhi.gov.in These incentives shorten payback cycles for OEMs and encourage gigafactory siting in states that layer state perks atop federal grants. As a result, domestic capacity commitments reached 68 GWh in 2025, a 40% jump over 2024 announcements.
Declining Lithium-ion Battery Prices
Global pack prices fell to USD 115 per kWh in 2024 and are trending toward USD 80 per kWh by 2026, easing the cost barrier that historically constrained India's battery market penetration.[3]BloombergNEF, “Battery Pack Prices Fall to USD 139/kWh,” about.bnef.com Ola Electric sources cathode precursors at spot rates 18% below 2023 averages, allowing its S1 scooter pack to retail at Rs 45,000, undercutting lead-acid alternatives across a ten-year lifecycle. Exide Industries and Amara Raja target sub-Rs 50,000 packs for three-wheelers by late 2026, signaling imminent price inflection for commercial fleets. Falling input costs thus reinforce demand-side incentives, giving the India battery market dual momentum on the supply and demand fronts.
Rapid EV Adoption in Two- & Three-Wheelers
Unit sales of electric two-wheelers hit 1.149 million in fiscal 2024-25, up 21% year-on-year, while electric three-wheelers surged 57% to 159,235 units. Lower upfront prices, urban ride distances below 100 kilometers, and densifying charge networks in Bangalore, Delhi, and Pune underpin this outperformance versus passenger cars. Ather Energy’s 3.7 kWh swappable pack ecosystem spans 1,800 fast chargers across 100 cities, proving that infrastructure density can offset range anxiety. Fleet operators in Delhi show annual conversion rates above 40%, yielding total-cost-of-ownership savings of Rs 1.2 lakh per vehicle over five years compared with compressed natural gas autorickshaws. Each incremental two-wheeler needs 2-4 kWh, whereas three-wheelers demand 8-10 kWh, creating predictable procurement pipelines that anchor gigafactory utilization.
Expanding Telecom & Data-Center Backup Needs
More than 500,000 telecom towers are shifting from diesel gensets to lithium-ion modules offering 3-5 times the cycle life and 40% lower lifetime costs. Bharti Airtel and Reliance Jio ordered 80,000 lithium tower-backup units in 2024, each rated at 5 kWh. Parallelly, hyperscale data-center capacity is set to reach 2,070 MW by 2025 as AWS, Microsoft, and Google deepen their India footprints, bringing 10-20 MWh UPS requirements per site. Industrial customers favor LFP batteries for thermal stability, widening chemistry diversification, and buffering manufacturers from EV-specific demand volatility.
Restraints Impact Analysis*
| Restraint | (~) % Impact on CAGR Forecast | Geographic Relevance | Impact Timeline |
|---|---|---|---|
| Critical Mineral Supply Vulnerabilities | -1.4% | National | Medium term (2-4 years) |
| Under-developed Battery Recycling Ecosystem | -0.8% | National | Long term (≥ 4 years) |
| Peak-Hour Tariff Caps Hindering BESS Viability | -1.1% | National, state grids | Short term (≤ 2 years) |
| Global Patent Barriers for Next-Gen Chemistries | -0.6% | National | Long term (≥ 4 years) |
| Source: Mordor Intelligence | |||
Critical Mineral Supply Vulnerabilities
The India battery market remains fully import-dependent for lithium and cobalt, leaving domestic producers exposed to geopolitical shocks. Although lithium carbonate prices cooled to USD 12,000 per tonne in 2024, long-term contracts still track Chinese benchmarks influenced by strategic stockpiling. Government auctions of lithium blocks in Jammu & Kashmir and Rajasthan revealed reserves equal to just 3–4 years of projected demand at 2031 run-rates. Cobalt risks are starker because 70% of global supply comes from the Democratic Republic of Congo, where artisanal mining raises social and delivery uncertainties. OEMs are pivoting to cobalt-free LFP cathodes, yet premium NMC batteries still anchor high-range vehicles, keeping supply-chain fragility in focus.
Under-developed Battery Recycling Ecosystem
Only 10% of end-of-life lithium-ion packs were recovered in 2024, far below the 70% target set by draft Extended Producer Responsibility guidelines for 2030. Attero Recycling’s 12,000-tonne hydrometallurgical facility struggles with feedstock scarcity because informal scrap channels siphon 60% of discarded packs for export to Southeast Asia. Non-standardized pack designs inflate disassembly costs to Rs 22 per kilogram, double the viable threshold. The absence of clear liability rules for second-life batteries further stalls investment in circular supply chains.
*Our forecasts treat driver/restraint impacts as directional, not additive. The impact forecasts reflect baseline growth, mix effects, and variable interactions.
Segment Analysis
By Battery Type: Rechargeables Drive Volume and Value
Secondary batteries accounted for 65.5% of India's battery market share in 2025, and this slice is projected to expand at a 15.9% CAGR through 2031 as automotive electrification accelerates and stationary storage scales. The India battery market size for secondary cells is projected to rise from USD 8.30 billion in 2025 to almost USD 18 billion by 2031, cementing its dominance. Lithium-ion chemistries make up 42% of secondary-battery revenue, propelled by OEM transitions from lead-acid starter-lighting-ignition units to traction packs that deliver 2,000–5,000 charge cycles. Ola Electric's 5 GWh block and Exide's Rs 7,000 crore lithium line exemplify capital flowing toward rechargeables.
Primary batteries still serve remote sensors and medical devices, but will grow only 3.2% annually as portable-electronics makers adopt integrated lithium-polymer modules. NiMH packs persist in select hybrids such as Toyota's Camry because of superior high-heat tolerance.[4]Toyota Kirloskar Motor, “Hybrid Vehicle Technology Overview,” toyotabharat.com NiCd use is shrinking after Bureau of Indian Standards tightened cadmium limits. Flow and sodium-sulfur technologies are piloting grid projects, but high capital costs keep them niche.


By Technology: Lead-Acid Incumbency Meets Solid-State Disruption
Lead-acid retained a 53.2% share in 2025, thanks to entrenched automotive SLI and UPS usages serviced by nationwide dealer networks of Exide and Amara Raja. However, safety incidents, 47 EV fires linked to thermal runaway between 2022 and 2024, fuel consumer preference for advanced chemistries. Solid-state cells, with energy densities above 400 Wh/kg and non-flammable electrolytes, are forecast to grow at a 33.5% CAGR, albeit from a low base. Log9’s graphene-enhanced quasi-solid prototypes enable 15-minute charging for fleet operators, while Reliance New Energy sees sodium-ion as a transitional step until solid-state costs drop below Rs 8,000 per kWh.
Lithium-ion held a 38% share in 2025, split between NMC 811 cathodes for range-sensitive scooters and LFP for cost-focused two-wheelers and stationary storage. Ola Electric’s 4680 cylindrical-cell architecture achieves 260 Wh/kg, enabling a 181-kilometer range in the S1 Pro scooter. Emerging chemistries such as aluminum-air and lithium-sulfur collectively hold a 1.8% share but draw disproportionate R&D funding under the National Mission on Transformative Mobility and Battery Storage, which earmarked Rs 500 crore for pre-commercial validation.
By Application: Automotive Electrification Anchors Demand
Automotive batteries captured 39.6% of value in 2025 and are forecast to progress at a 15.2% CAGR through 2031, driven mainly by two- and three-wheeler electrification. The India battery market size for automotive use is expected to nearly triple over the forecast window, reflecting robust subsidy support under PM E-DRIVE. Each electric scooter requires up to 4 kWh, while a three-wheeler carries 8-10 kWh, underpinning cell demand regardless of passenger-car uptake.
Industrial segments, motive power, telecom backup, and data-center UPS, held a 34% share in 2025. Operators like Airtel and Jio swapped 80,000 tower-backup batteries in 2024, cutting replacement cycles to once a decade. Portable electronics added 18%, whereas power tools and SLI batteries filled the balance. Diversified demand streams shield suppliers from single-application downturns, a key resilience factor in the India battery market.
Geography Analysis
Gujarat, Maharashtra, Karnataka, and Tamil Nadu concentrated 72% of installed capacity in 2025, reflecting port access for imported lithium carbonate and state subsidies for capital-intensive gigafactories. Gujarat hosts Reliance’s Jamnagar complex, which will integrate 10 GWh of sodium-ion and lithium-ion lines by 2028. Tamil Nadu secured Ola Electric’s inaugural 5 GWh facility and Hyundai Global Motors’ PLI allocation owing to electricity-duty exemptions and 15% capital grants. Karnataka’s Bangalore-Mysore corridor is an R&D hub for Log9, Ather Energy, and Tata AutoComp, benefiting from proximity to high-tech labor pools.
Maharashtra’s EV policy mandates a 25% battery-electric share in state purchases, anchoring demand for Exide’s Pune line and Amara Raja’s Chakan project. Northern states, Uttar Pradesh, Haryana, and Delhi, contribute 18% of consumption, bolstered by e-commerce last-mile fleets run by Amazon and Flipkart using 45,000 electric delivery vehicles. Eastern and northeastern zones remain under-penetrated at 6% due to sparse charging infrastructure and lower disposable incomes. Potential reserves in Jammu & Kashmir and Rajasthan could seed mining-linked clusters post-2028, though commercial viability awaits resource confirmation.
Regulatory Landscape
India battery regulation is anchored by extended producer responsibility (EPR) under the Battery Waste Management Rules and subsequent amendments administered through the Central Pollution Control Board (CPCB) EPR portal. The Battery Waste Management (Amendment) Rules, 2024 introduced CPCB-set price floors and caps for EPR certificates (linked to environmental compensation). The Battery Waste Management (Amendment) Rules, 2025 then refined compliance mechanics by permitting barcode or QR-code based identification for producer registration and traceability.
Product safety and performance compliance is also tightening via the Bureau of Indian Standards (BIS). BIS issued guidance for implementing Amendment No. 1 to IS 16270:2023 (secondary cells and batteries for solar PV), with a mandatory implementation deadline for existing licensees of 08 December 2025, affecting suppliers serving rooftop solar, telecom backup, and stationary storage channels. In parallel, standards development under BIS ETD 52 includes IS 19143 (Part 4/Sec 4):2025, which addresses battery energy storage systems (BESS) using reused batteries. MNRE policy actions include 2025 updates to the viability gap funding (VGF) framework for BESS and an MNRE innovation challenge call (16 June 2025) focused on circularity in renewable batteries and solar PV.
Competitive Landscape
The top five suppliers, Exide Industries, Amara Raja Energy & Mobility, Luminous Power Technologies, Ola Electric, and Reliance New Energy, held roughly 58% of 2025 revenue, giving the India battery market a moderate concentration profile. Exide and Amara Raja defend lead-acid margins via 12,000-dealer networks while allocating 25–35% of capex to lithium-ion expansions (12 GWh and 16 GWh, respectively, by 2028). Ola Electric’s vertical integration shaves 12–15% off pack costs and reduces development lead-times for new scooter models.
Reliance New Energy leverages Faradion IP to diversify into sodium-ion stationary systems and benefits from parent-company cash flows to scale Jamnagar output in step with renewable investments. Luminous Power and Su-Vastika focus on residential storage, an emerging whitespace as rooftop solar adoption rises in tier-2 cities. Recycling specialists Lohum and Attero are positioning to capture mineral credits once EPR rules become enforceable, partnering with OEMs to offer closed-loop solutions.
Strategically, players are experimenting with battery-as-a-service. Ather Energy’s Bangalore swapping network processes 8,000 transactions daily and aims for 200 stations by 2026, signaling a pivot from product sales to energy-delivery models. Patent filings grew 34% in 2024, led by Log9 and Reliance, indicating a shift from assembly to indigenous IP creation.
India Battery Industry Leaders
Exide Industries Ltd
Luminous Power Technologies Pvt. Ltd.
HBL Power Systems Ltd
TATA AutoComp GY Batteries Pvt. Ltd.
Amara Raja Energy & Mobility Limited
- *Disclaimer: Major Players sorted in no particular order

Market Opportunities and Future Outlook
Domestic cell and pack manufacturing expansion is being pulled by policy-backed demand platforms that sit alongside fast-growing mobility electrification: the National Programme on Advanced Chemistry Cell (ACC) Battery Storage and central support for grid-scale storage. The ACC program, administered by the Ministry of Heavy Industries, carries an incentive outlay of Rs 18,100 crore covering 50 GWh of ACC manufacturing plus 5 GWh of niche ACC technologies. It also sets localization requirements (25% domestic value addition within 2 years, 60% within 5 years) and a minimum investment threshold of Rs 225 crore per GWh of committed capacity. This structure creates whitespace for component localization (electrodes, separators, electrolyte, BMS, and pack enclosures) and for contract manufacturing models that help OEMs and system integrators meet value-add norms.
On the stationary side, the Government of India is running two viability gap funding (VGF) schemes (March 2024 and June 2025 tranches) supporting around 43 GWh of BESS, aligning procurement pipelines for LFP and other thermally stable chemistries used in grid and commercial UPS deployments. Company actions indicate this opportunity is translating into capacity commitments and site selection. Waaree Energies announced an integrated 16 GWh lithium-ion gigafactory plan at Rambilli, Andhra Pradesh (February 2026), and Tata Group (Agratas) confirmed construction progress for a 20 GWh first phase at Sanand, Gujarat (April 2026). Reliance Industries has also raised its battery and cell manufacturing target to 120 GWh, with the first 40 GWh phase of its Jamnagar BESS and cell giga-factory tied to commissioning within calendar 2026. This reinforces clustering around renewable-energy hubs and supports near-term demand for EPC, testing, certification, and local supply-chain partners involved in gigafactory ramp-ups.
Recent Industry Developments
- May 2026: Exide Industries increased its investment commitment into Exide Energy Solutions Limited (EESL) for its lithium-ion cell manufacturing program in India. The additional funding supports build-out and readiness for scale in domestic cell manufacturing, a key shift away from dependence on imported cells for EV and stationary applications.
- May 2025: Amara Raja Energy & Mobility commenced construction of Giga Factory-1 at its industrial park in Telangana. The start of on-ground execution moves the company from planning to capacity creation, strengthening India-based supply options for EV OEMs and stationary storage integrators.
- August 2024: Amara Raja Energy & Mobility signed an MoU with Ather Energy to develop and supply NMC and LFP lithium-ion cells from its upcoming gigafactory in Divitipally, Telangana. The tie-up brings together an established battery manufacturer and a major two-wheeler EV player, tightening the demand linkage needed for long-term offtake and chemistry diversification.


Research Methodology Framework and Report Scope
Market Definition and Coverage
For this methodology, the India battery market covers revenues earned from batteries supplied within India across primary and secondary chemistries, across common end uses such as mobility, industrial power, and consumer devices.
Scope exclusions: Battery chargers, power electronics (inverters and converters), and standalone energy storage systems that are priced and sold as complete solutions are excluded unless the value is explicitly attributable to the battery itself.
Segmentation Overview
- By Battery Type
- Primary Batteries
- Secondary Batteries
- By Technology
- Lead-acid
- Li-ion
- Nickel-metal hydride
- Nickel-cadmium
- Sodium-sulfur
- Solid-state
- Flow Battery
- Emerging chemistries
- By Application
- Automotive (HEV, PHEV, and EV)
- Industrial (Motive, Stationary (Telecom, UPS, ESS), etc.)
- Portable (Consumer Electronics, etc.)
- Power Tools
- SLI
- Other Applications
Data Sources, Market Sizing, and Validation
Desk Research
Desk work starts with building a simple fact base for demand signals and pricing context. We refer to public sources such as Ministry of Heavy Industries releases on vehicle electrification, NITI Aayog and government policy documents, Central Electricity Authority and Ministry of Power publications for grid and storage related context, and Central Statistics Office macro indicators that influence industrial and consumer demand.
To keep imports, local manufacturing, and cost drivers grounded, we also review trade and customs statistics and notifications, BIS standards and updates where applicable, and technical papers and journals that discuss chemistry shifts and safety requirements. Company annual reports, investor presentations, and credible business press are used to cross-check capacity plans and product mix narratives. For select steps, paid subscriptions for company financials and intelligence, patent databases, and shipment-level import and export views are used to validate directional trends. These desk sources are illustrative only, and many other public documents and references were consulted for data collection and clarification.
Primary Interviews and Surveys
Primary work is used to pressure-test assumptions that desk sources cannot settle cleanly, especially for realized pricing, product mix shifts, and procurement cycles. We spoke with a mix of manufacturers, distributors, OEM and integrator side stakeholders, and large buyers across mobility, industrial backup, and device ecosystems, then re-checked points where responses showed wide variance across India.
Distribution of primary research fieldwork respondents
Distribution of primary research fieldwork respondents
| Company type | Respondent position |
|---|---|
| Top tier: 30% | CXOs: 14% |
| Mid tier: 53% | Functional/Unit leaders: 42% |
| Smaller Players: 17% | Managers: 44% |
Market-Sizing & Forecasting
Sizing begins with a top-down build where the demand pool is reconstructed from India-specific adoption and replacement signals across key battery-using areas, then translated into revenue using price and mix assumptions. In practice, the model leans on indicators such as vehicle electrification momentum, SLI replacement cycles, industrial backup needs linked to uptime requirements, device shipment trends, and chemistry mix movement between lead-acid and lithium-ion (plus smaller emerging chemistries).
Once the macro view is set, totals are corroborated using selective bottom-up approximations, such as sampled ASP x volume checks from channel feedback, supplier revenue sanity checks, and spot checks against import dependence patterns for certain chemistries. For forecasting, scenario analysis is used with a base case that reflects policy direction and manufacturing announcements, then adjusted using primary feedback on timing risks, pricing normalization, and substitution trends. Where a bottom-up trail is incomplete, gaps are handled by using conservative fill rates based on similar use cases, followed by review against overall demand indicators so the final curve stays realistic.
Data Validation & Update Cycle
Validation is done through multiple passes, where model outputs are compared with independent signals like adoption pace, replacement intensity, and the implied price per unit across chemistries. Outliers are flagged, and the assumptions behind them are revisited, after which the model is re-run and reviewed again before sign-off.
Reports refresh annually, and interim updates are triggered when a material event changes demand, trade flows, or pricing, such as major policy changes, sudden commodity moves, or a large capacity start-up. Before delivery, a final update pass is completed so the view reflects the latest available information and feedback.
Mordor Intelligence's India Battery Market Size Measured Against Other Published Estimates
Published market values for India batteries can look far apart because each publisher sets different boundaries around what counts as battery revenue, and they also pick different year timing for prices and currency conversion. Another common reason is the way the price curve is handled, since battery ASPs can move quickly with chemistry mix, raw material swings, and import dependence.
When the model is refreshed, quarterly-like price checkpoints and INR to USD timing are re-verified through channel discussions and cross-checks against trade and company disclosures, and then the market total is recomputed as a refresh-led step used by Mordor Intelligence.
Benchmark comparison
| Source | Market Size | Gaps in Research Methodology |
|---|---|---|
| Mordor Intelligence | USD 12.68 B (2025) | |
| Trade Journal A | USD 7.20 B (2024) | Uses an earlier base year and appears to apply broader average pricing across applications, which can understate revenue when higher value chemistries rise faster than unit demand. |
| Industry Publisher B | USD 9.29 B (2025) | Shows a higher growth profile that likely assumes faster ASP expansion and a more aggressive volume ramp, while the cross-checks against near-term adoption and replacement cycles are less clearly tied to India demand signals. |
Overall, the spread mainly comes from base year choice, how quickly pricing is assumed to move by chemistry and application, and how strongly near-term demand checks are enforced. Our approach keeps the size traceable to a few repeatable variables, and it reduces surprise swings by re-checking price and conversion timing before finalizing the number.


Key Questions Answered in the Report
How large is the India battery market in 2026?
The India battery market is valued at USD 14.01 billion in 2026, tracking a 10.71% CAGR toward USD 23.30 billion by 2031.
Which battery type dominates demand?
Secondary, or rechargeable, batteries led with 65.5% revenue share in 2025 and are scaling at nearly 16% annually.
What is driving rapid adoption in mobility?
Subsidies under PM E-DRIVE and falling lithium-ion prices have pushed electric two- and three-wheeler sales past 1.3 million units, anchoring automotive battery demand.
Where are most gigafactories located?
Gujarat, Tamil Nadu, Karnataka, and Maharashtra host 72% of installed and announced capacity thanks to port access and state incentives.
Are alternative chemistries gaining ground?
Yes, sodium-ion and solid-state pilots are underway, with Reliance New Energy commissioning 2 GWh of sodium-ion capacity in 2026 for stationary storage.
What challenges threaten growth?
Mineral import dependence, limited recycling, tariff-capped storage economics, and international patent barriers could shave 4% off projected CAGR if unresolved.
Page last updated on:


 Your data is secure and never sold or shared.


