
Market Overview
| Study Period | 2020 - 2031 |
|---|---|
| Forecast Data Period | 2026 - 2031 |
| Base Year Market Size (2025) | 1.12 Billion Liters |
| Market Volume (2026) | 1.12 Billion Liters |
| Market Volume (2031) | 1.15 Billion Liters |
| Growth Rate (2026 - 2031) | 0.39 % |
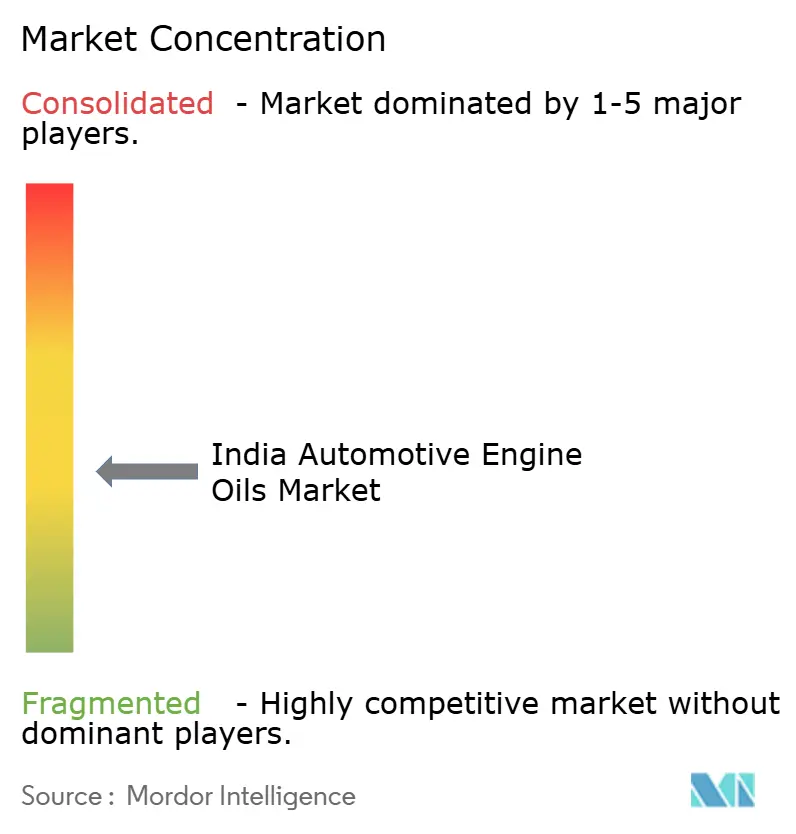
| Market Concentration | Medium |
Major Players *Disclaimer: Major Players sorted in no particular order Image © Mordor Intelligence. Reuse requires attribution under CC BY 4.0. | |
India Automotive Engine Oils Market Analysis by Mordor Intelligence
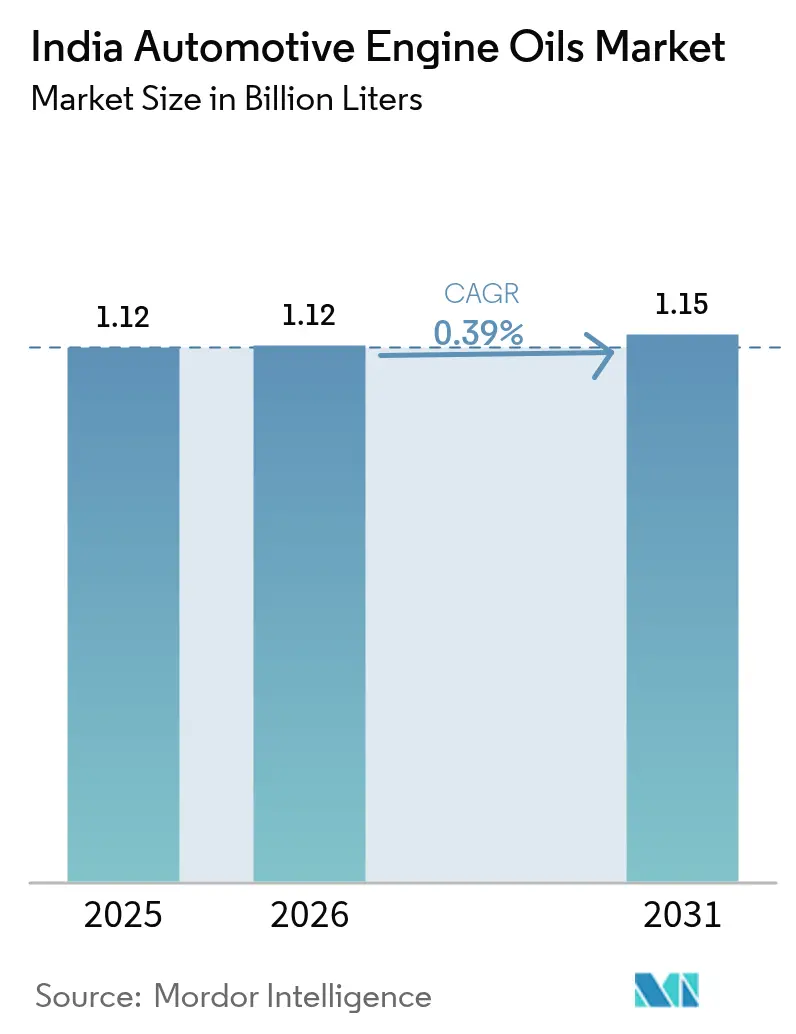
The India Automotive Engine Oils Market size was valued at 1.12 Billion Liters in 2025 and estimated to grow from 1.12 Billion Liters in 2026 to reach 1.15 Billion Liters by 2031, at a CAGR of 0.39% during the forecast period (2026-2031). Demand is shifting toward low-viscosity synthetic blends as BS-VI Stage-2 regulations tighten, CNG fleets expand, and e-commerce delivery cycles accelerate maintenance needs. Manufacturers are balancing premiumization and price sensitivity by widening their synthetic portfolios while preserving mineral-oil offerings for older vehicles. Rising two-wheeler ownership sustains per-capita lubricant demand even as extended-drain formulations curb change frequency. Competitive intensity centers on distribution reach and OEM tie-ups, with refiners guarding volume positions and multinationals targeting high-margin niches. The India automotive engine oil market remains fundamentally volume-driven, so every liter saved through electrification or telematics directly pressures revenue.
Key Report Takeaways
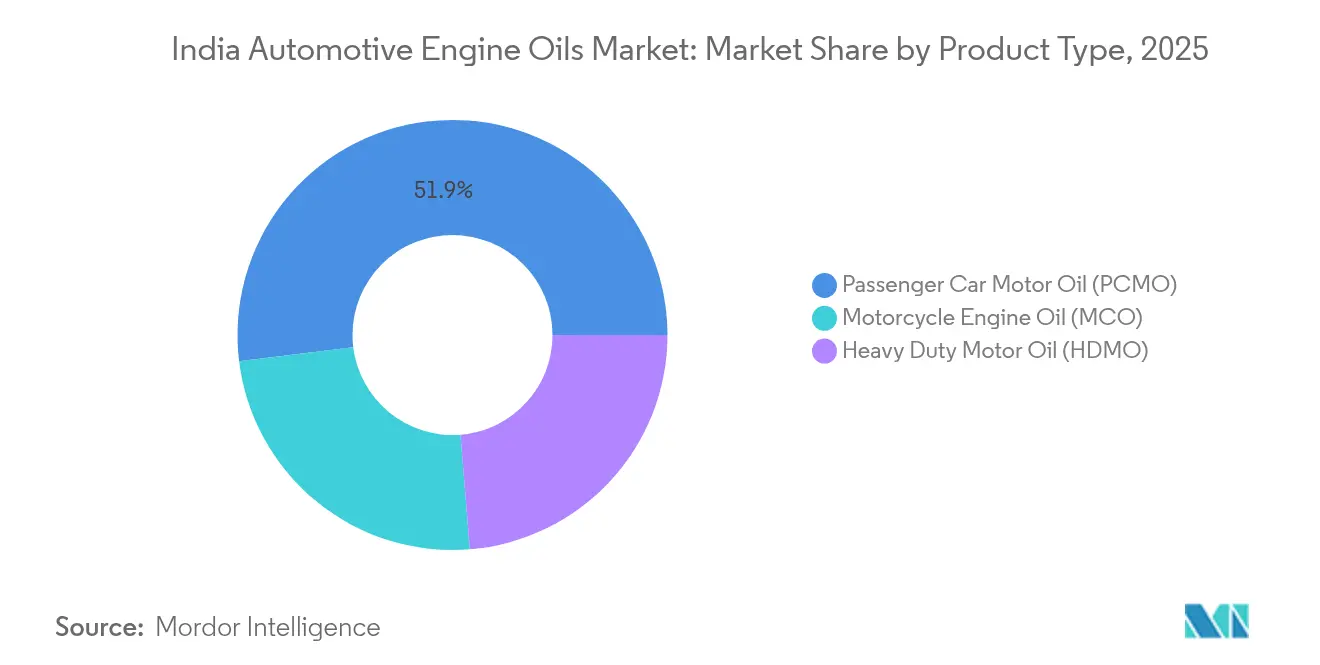
- By product type, passenger Car Motor Oil held 51.94% of the India automotive engine oil market share in 2025, while motorcycle engine oil posted the fastest growth at a 0.53% CAGR through 2031, outpacing all other product categories.
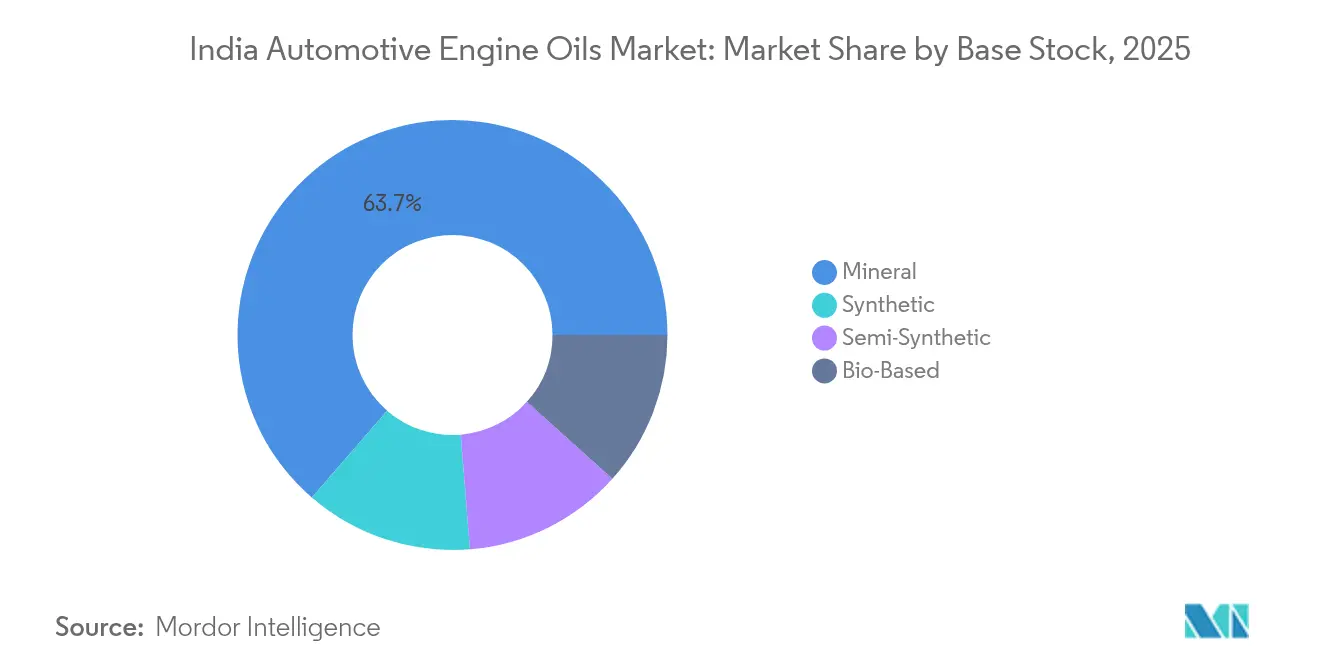
- By base stock, mineral base stocks captured 63.65% of the India automotive engine oil market size in 2025, yet synthetic oils recorded the highest 0.67% CAGR during the same period.
Note: Market size and forecast figures in this report are generated using Mordor Intelligence’s proprietary estimation framework, updated with the latest available data and insights as of 2026.
India Automotive Engine Oils Market Trends and Insights
Drivers Impact Analysis*
| Drivers | (~) % Impact on CAGR Forecast | Geographic Relevance | Impact Timeline |
|---|---|---|---|
| Rising passenger-vehicle and two-wheeler parc expansion | +0.15% | Tier-2 and tier-3 cities nationwide | Medium term (2-4 years) |
| Rapid CNG-vehicle growth and higher-temperature lube demand | +0.08% | Delhi NCR, Punjab, Gujarat | Short term (≤ 2 years) |
| BS-VI Stage-2 norms driving shift to premium low-viscosity oils | +0.12% | Nationwide | Short term (≤ 2 years) |
| E-commerce last-mile fleets shortening drain-interval cycles | +0.05% | Metro and tier-1 cities | Medium term (2-4 years) |
| Scrappage-policy led spike in factory-fill demand (2026-28) | +0.10% | Nationwide | Medium term (2-4 years) |
| Source: Mordor Intelligence | |||
BS-VI Stage-2 Norms Driving Shift to Premium Low-Viscosity Oils
The April 2023 onset of Real Driving Emissions testing forced OEMs to adopt low-SAPS oils that protect after-treatment systems under real-world conditions[1]. Synthetic and semi-synthetic grades now dominate factory-fill bids as mineral formulations struggle with tighter oxidation limits and deposit control. Fleet operators accept the 30–50% price premium because extended drains lower downtime and cut maintenance spend. Refiners have upgraded additive packages, positioning low-viscosity 5W-30 and 0W-20 grades for modern petrol and diesel platforms. Central Pollution Control Board audits reinforce compliance, making this regulatory push an irreversible driver of premiumization across the India automotive engine oil market.
Rapid CNG-Vehicle Growth and Higher-Temperature Lube Demand
India’s CNG fleet expansion in buses, taxis, and light-duty trucks raises lubricant operating temperatures, accelerating polymer shear and nitration. Premium CNG-specific oils priced 15–20% above diesel equivalents deliver the higher thermal stability and valve-seat protection these engines require. The north-centric refueling network sparks regional demand clusters where distributors prioritize CNG variants. Government targets that elevate CNG to 15% of all transport fuel by 2030 underpin steady volume growth, cushioning suppliers from BEV cannibalization in urban freight.
E-commerce Last-Mile Fleets Shortening Drain-Interval Cycles
Stop-start duty cycles in parcel and food delivery increase fuel dilution, soot loading, and oxidation, forcing oil changes 20–30% sooner than highway operations. Quick-lubrication chains and mobile service vans capture this higher-frequency maintenance business, pushing overall liter sales upward even when individual drains shrink in volume. While telematics-based condition monitoring is rolling out, most fleets still follow time-based schedules, creating a near-term volume tailwind within the India automotive engine oil market.
Scrappage-Policy Led Spike in Factory-Fill Demand (2026-28)
The national vehicle scrappage initiative retires aged commercial and private units, catalyzing new-vehicle production and factory-fill lubricant demand. OEMs negotiate multi-year supply contracts that secure volume and margin stability for lubricant partners. Peak replacement in 2026–2028 could lift annual factory-fill demand by up to 10%, helping offset long-term volume erosion from electrification and extended drains.
Restraints Impact Analysis*
| Restraints | (~) % Impact on CAGR Forecast | Geographic Relevance | Impact Timeline |
|---|---|---|---|
| Accelerating BEV and e-2W penetration eroding engine-oil volume | -0.18% | Metro cities and southern states | Long term (≥ 4 years) |
| Extended-drain synthetic oils cutting per-vehicle consumption | -0.12% | Highway corridors, national fleets | Medium term (2-4 years) |
| Telematics-based condition monitoring reducing oil changes | -0.08% | Organized logistics operators | Medium term (2-4 years) |
| Source: Mordor Intelligence | |||
Accelerating BEV and e-2W Penetration Eroding Engine-Oil Volume
FAME-II incentives and cheaper lithium-ion packs accelerate electric two-wheeler adoption, displacing motorcycles that currently anchor growth in the India automotive engine oil market[2]. Each e-scooter eliminates 800–900 milliliters of annual oil demand, and adoption is clustering in Bengaluru, Chennai, and Pune before cascading into smaller cities. Heavy-duty electrification is slower, yet every BEV truck removes up to 40 liters per drain, magnifying the long-term drag on volume.
Extended-Drain Synthetic Oils Cutting Per-Vehicle Consumption
Carriers running 40,000–60,000-kilometer drains with API CK-4 synthetics halve yearly oil use, even after paying two to three times more per liter. Warranty-backed approvals from Tata Motors and Ashok Leyland validate this switch, and national express fleets are standardizing on premium grades to shrink maintenance windows. Extended drains thus present the most immediate volume-loss risk outside electrification, especially in long-haul corridors.
*Our forecasts treat driver/restraint impacts as directional, not additive. The impact forecasts reflect baseline growth, mix effects, and variable interactions.
Segment Analysis
By Product Type: Passenger Car Motor Oil Dominance Amid MCO Momentum
Passenger Car Motor Oil posted the largest 2025 share at 51.94% of the India automotive engine oil market share, thanks to an expanding passenger-vehicle parc and slower EV uptake in midsize cars. Multigrade 5W-30 and 5W-40 synthetics now anchor OEM factory fills, while 15W-40 mineral grades linger in older compact cars across non-metro regions. Motorcycle Engine Oil, benefiting from India’s 25-million-unit annual two-wheeler production, delivered the fastest 0.53% CAGR through 2031. OEM-driven viscosity shifts toward 10W-30 and 10W-40 synthetics improve cold-start protection and clutch performance, supporting premiumization. Heavy Duty Motor Oil maintains volume stability by servicing long-haul diesel and emerging CNG trucks. Despite synthetic penetration, older mineral 20W-40 monogrades remain relevant among price-sensitive owner-drivers.
OEMs and refill brands are refining additive chemistries to secure API SP and JASO MA2 credentials, positioning for tighter emission and fuel-economy norms. Product portfolios therefore straddle premium synthetics for modern vehicles and affordable mineral lines for legacy fleets, allowing suppliers to protect share across income segments.

By Base Stock: Mineral Leadership Challenged by Synthetic Innovation
Mineral oils retained 63.65% of 2025 volume due to cost advantages and compatibility with legacy engines, yet their hold is weakening as regulatory and economic factors push fleets toward synthetics. Synthetic grades, bolstered by BS-VI Stage-2 and extended-drain economics, recorded the highest 0.67% CAGR. Semi-synthetics carve out a mid-tier value proposition, blending hydro-cracked bases with premium additives to offer 25–30% longer drains at modest price uplifts.
Imports from Singapore and South Korea supplement domestic synthetic production, but rising Group III refinery projects in India aim to localize supply. Suppliers therefore invest in flexible blending lines that can swing between Group I, II, and III stock, ensuring cost competitiveness across customer tiers.
Geography Analysis
India’s northern corridor, encompassing Delhi NCR, Punjab, and Haryana, accounted for the highest regional lubricant demand in 2025 of the India automotive engine oil market, thanks to dense CNG adoption and a large commercial fleet base. The western region, led by Maharashtra and Gujarat, is underpinned by industrial clusters and strong passenger-vehicle penetration.
The India automotive engine oil market size for the northern region is sustained by construction and freight activity, offset by efficiency gains. Western and southern regions will show more pronounced shifts toward synthetic and extended-drain regimes. Eastern and northeastern states, though smaller in absolute volume, present above-average growth potential because rising vehicle density coincides with refinery infrastructure improvements that lower distribution costs. Urban centers anchor premium product sales. Rural districts remain mineral-oil strongholds, supporting supply chains of state-owned refiners that leverage fuel-station networks. Cross-border trade with Nepal and Bangladesh also channels surplus mineral stock from eastern India, extending the geographic influence of domestic blenders.
Regulatory Landscape
India automotive engine oils are governed by product-quality and conformity requirements led by the Bureau of Indian Standards (BIS), with IS 13656:2019 laying out requirements for automotive internal combustion engine crankcase oils. Emissions policy remains the primary technical driver for formulation shifts. BS VI fuel and vehicle-emission compliance, including the 10 ppm sulfur fuel regime, push OEMs and marketers toward low-SAPS, low-viscosity oils designed to protect after-treatment systems under real-world operation.
On the supply and market-control side, the Ministry of Petroleum and Natural Gas (MoPNG) notified the Lubricating Oils and Greases (Processing, Supply and Distribution Regulation) Amendment Order, 2024 on May 3, 2024. Public Procurement (Preference to Make in India), Order, 2017, updated March 26, 2024, also affects sourcing by tightening local-content expectations in government procurement across the broader oil and gas value chain, supporting domestic blending and base-oil localization that feeds into automotive engine-oil supply.
Value Chain Analysis
The value chain runs from base-oil supply (Group I/II/III, with India still supplementing higher-grade requirements via imports) and additive procurement (detergent-dispersant, anti-wear, viscosity modifiers, pour-point depressants) through blending, testing, and packaging, and then multi-channel distribution into OEM factory fill and the aftermarket. Blending economics depend on the ability to adjust recipes across mineral, semi-synthetic, and synthetic grades as BS-VI Stage-2 and OEM approvals raise the performance bar. That lifts the role of in-house or partner labs for quality control and batch certification.
On the manufacturing and go-to-market side, established players use local plants and marketing infrastructure. For example, BPCL's lubricant operations span multiple blending locations supported by marketing laboratories, and Idemitsu's Patalganga plant. Gulf Oil India operates blending capacity at Silvassa and Ennore. Distribution is anchored in high-trust fuel-station networks, with state-owned oil marketing companies providing reach and authenticity in the consumer segment, and partnerships such as Gulf Oil's retail tie-up with Nayara Energy widening access to rural outlets. Organized fleets are served through direct sales, workshops, and quick-lube channels as extended-drain and condition-monitoring programs influence replenishment cycles.
Competitive Landscape
India’s automotive engine oil arena remains moderately fragmented. Channel partnerships reshape distribution footprints. Gulf Oil’s 2024 tie-up with Nayara Energy unlocked 6,500 retail outlets, raising its rural penetration and reinforcing mid-tier brand credentials. Technology is the new battleground. ExxonMobil pilots IoT sensor kits that alert fleets to oil degradation, aligning lubricant supply with predictive maintenance contracts. Domestic challenger Veedol launched EstoBioLides-based synthetics in 2025 to carve out a sustainability niche. Start-ups offer direct-to-consumer packs via online marketplaces, but logistics costs and return-policy risks constrain their scale. Overall, pricing discipline remains intact in premium segments, while intense competition keeps mineral-oil margins thin, especially in the rural aftermarket.
India Automotive Engine Oils Industry Leaders
-
Bharat Petroleum Corporation Limited
-
BP plc
-
Gulf Oil International
-
Hindustan Petroleum Corporation Limited
-
Indian Oil Corporation Limited
- *Disclaimer: Major Players sorted in no particular order
Market Opportunities and Future Outlook
Premiumization around BS-VI Stage-2 and OEM warranty requirements continues to create whitespace in low-viscosity synthetic and semi-synthetic grades (including 0W-20 and 5W-30) across passenger cars and newer two-wheelers. In addition, CNG usage in select corridors (Delhi NCR, Punjab, Gujarat) supports differentiated, higher-temperature-stability engine-oil propositions. Aftermarket pull is increasingly shaped by organized fleet maintenance behavior and the spread of multi-brand quick service formats, which rewards suppliers that can bundle products with testing, training, and drain-interval programs rather than competing only on price.
A second opportunity track involves supply-chain localization in higher-grade base stocks and expanded domestic blending capacity to address import dependence and improve response to OEM bid specifications. In May 2026, Chennai Petroleum Corporation Limited (CPCL) began work on a specialized base-oil unit at its Manali refinery to produce Group II and Group III lube oil base stocks. In June 2026, Gulf Oil Lubricants India announced capex for capacity expansion at Silvassa and Chennai to lift installed capacity. Together, these projects expand availability of higher-performance inputs and finished lubricants in-country, supporting wider availability of API- and OEM-aligned formulations and reducing lead-time and overseas base-oil supply exposure.
Recent Industry Developments
- June 2026: Gulf Oil Lubricants India announced capital expenditure for capacity expansion at its Silvassa and Chennai facilities to materially increase installed blending capacity. This improves supply responsiveness for premium engine-oil grades and supports service levels for OEM and aftermarket demand clusters across western and southern India.
- December 2025: Gulf Oil Lubricants India launched the Gulf Syntrac 100% fully synthetic motorcycle engine oil range with API SP compliance across multiple SKUs and viscosity grades. This expanded its premium two-wheeler portfolio as OEM viscosity shifts and higher-temperature operating conditions push customers toward higher-performance formulations.
- April 2024: The Ministry of Petroleum and Natural Gas notified the Lubricating Oils and Greases (Processing, Supply and Distribution Regulation) Amendment Order, 2024, reinforcing the compliance framework governing lubricant processing and distribution. Tighter oversight increases the importance of standardized quality systems for blenders and marketers, shaping how products are formulated, tested, and routed through formal distribution channels.
Research Methodology Framework and Report Scope
Market Definition and Coverage
This market covers engine oil used in on-road vehicles operating in India, counted as demand volumes sold through OEM fill and the aftermarket. It includes engine oils consumed in passenger cars, commercial vehicles, and two-wheelers, across mineral, semi-synthetic, and synthetic formulations.
Scope exclusions: Automotive lubricants that are not engine oils (such as transmission fluids, brake fluids, and greases) are excluded from this market size.
Segmentation Overview
- By Resin Type
- Passenger Car Motor Oil (PCMO)
- 0W-XX
- 5W-XX
- 10W-XX
- 15W-XX
- Monogrades
- Other Grades
- Heavy Duty Motor Oil (HDMO)
- 0W-XX
- 5W-XX
- 10W-XX
- 15W-XX
- Monogrades
- Other Grades
- Motorcycle Engine Oil (MCO)
- 0W-XX
- 5W-XX
- 10W-XX
- 15W-XX
- Monogrades
- Other Grades
- Passenger Car Motor Oil (PCMO)
- By Base Stock
- Mineral
- Synthetic
- Semi-Synthetic
- Bio-Based
Data Sources, Market Sizing, and Validation
Desk Research
Desk research began with mapping the vehicle demand pool and how quickly it turns into engine oil consumption in India. We used public references such as India road transport statistics from MoRTH, vehicle production and wholesale data from SIAM, and macro indicators from RBI that help explain freight activity and consumer spending.
On the product side, we reviewed government and standards references (including BIS notifications), published technical and used-oil guidance from CPCB, and open literature on drain intervals and viscosity grades in peer-reviewed journals. To connect these signals to company-level reality, we also used filings, annual reports, investor decks, and reputed press coverage, and we supplemented data gaps using paid subscriptions focused on company financials and intelligence and a lubricants-specific market information database. The sources listed are illustrative only, and other public documents and datasets were referenced during data collection, validation, and research clarification.
Primary Interviews and Surveys
Primary work focused on checking how demand moves by vehicle category and channel, and on collecting practical ranges for drain intervals, pack mix, and pricing ladders in the Indian market. We spoke with stakeholders across the value chain, including blenders, distributors, workshops, fleet maintenance teams, and OEM-linked service networks, and we balanced coverage across major consuming zones of India to avoid a single-city bias.
Distribution of primary research fieldwork respondents
| Company type | Respondent position |
|---|---|
| Top tier: 33% | CXOs: 14% |
| Mid tier: 51% | Functional/Unit leaders: 36% |
| Smaller Players: 16% | Managers: 50% |
Market-Sizing & Forecasting
Sizing used a top-down demand-pool logic where the vehicle parc, annual mileage, and typical sump sizes reconstruct the oil consumption requirement, then the total is adjusted by drain intervals and service habits. We built passenger cars, commercial vehicles, and two-wheelers separately so the model reflects differences in maintenance behavior tied to usage intensity.
To keep totals grounded, we corroborated results with selective bottom-up approximations, such as sampled price per liter by viscosity grade and channel, combined with expected volumes by vehicle class and workshop throughput checks. Key inputs used in the model included vehicle parc and new registrations, average annual kilometers for private and fleet vehicles, drain interval trends under BS-VI type conditions, the split between mineral and synthetic blends (which changes replacement frequency and pricing), and the share of OEM service versus independent workshops.
For forecasting, we ran scenario analysis so expected cases and stress cases could be tested against shifts in vehicle sales, fleet utilization, and drain interval extension. Where direct bottom-up visibility was weak (for example, informal workshop sales), we used range-based assumptions supported by interview feedback, then normalized outcomes to align with broader demand pool signals.
Data Validation & Update Cycle
Validation started with cross-checking modeled consumption against independent signals such as vehicle population trends and, where relevant, lubricant import and base oil movement proxies, alongside reported company commentary on volume direction. When an output looked unusual, we rechecked the input drivers, then ran a second internal review by another analyst to reduce the risk of errors persisting.
We also ran variance checks across vehicle categories to confirm that implied drain intervals and liters per service stayed within realistic ranges. Reports are refreshed annually, and interim updates are made when material events occur, including large regulatory changes, unusual price shocks, or major shifts in vehicle sales mix. Before delivery, a final update pass is completed so clients receive the most recently updated view.
Mordor Intelligence's India Automotive Engine Oils Market Sizing Compared With Other Published Estimates
Published market sizes for India automotive engine oils can differ because the scope and unit of measurement are not handled the same way, and because pricing and drain interval assumptions update on different timelines. We also see some estimates combine adjacent lubricant products into one headline number, which changes the total even before forecasting begins.
Transmission fluids and other non-engine automotive lubricants sit outside Mordor Intelligence's scope here, which narrows the count to engine oil demand only and keeps volumes traceable to the vehicle parc and service cycle. Differences also come from whether the model treats premiumization as a volume shift or only a price shift, how base-oil linked price changes are converted into end-market pricing, and whether demand is anchored to registrations alone or to parc and usage indicators.
Benchmark comparison
| Source | Market Size | Gaps in Research Methodology |
|---|---|---|
| Mordor Intelligence | USD 1.12 B (2025) | |
| Trade Journal A | USD 6.94 B (2024) | This figure represents a broader India automotive lubricants total, so it likely includes multiple product categories beyond engine oils and applies value-based pricing assumptions rather than a vehicle parc led volume build. |
| Regional Consultancy B | USD 5.04 B (2026) | The estimate appears to be value-based and may include wider channel markups and a different product basket, and the base year timing can shift totals when currency conversion and oil price cycles are not aligned. |
The spread in published totals mostly comes down to whether the number is engine oils only or a wider automotive lubricants basket, followed by how pricing and drain intervals are treated over time. By keeping the demand pool linked to vehicles in use and by checking assumptions with interviews, the estimate stays easier to replicate and audit when new data points arrive.
Key Questions Answered in the Report
How large is the India automotive engine oil market in 2026?
It stands at 1.12 billion liters in 2026 and is projected to reach 1.15 billion liters by 2031 at a 0.39% CAGR.
Which product segment uses the most engine oil in India today?
Passenger Car Motor Oil leads with 51.94% market share in 2025.
Why are synthetic oils gaining ground so quickly?
BS-VI Stage-2 regulations, extended-drain economics, and OEM warranties push fleets to adopt low-viscosity synthetic blends.
How will electric two-wheelers affect lubricant demand?
Each electric scooter removes up to 900 milliliters of annual engine-oil consumption, making e-2W adoption a key volume headwind.
What role does the scrappage policy play in the lubricant outlook?
Between 2026 and 2028, accelerated vehicle replacement is expected to lift factory-fill lubricant demand by up to 10%.
Which companies dominate premium synthetic sales?
Shell, ExxonMobil, and BP leverage advanced additive technology and OEM tie-ups to capture the high-margin synthetic segment.