
Market Overview
| Study Period | 2020 - 2031 |
|---|---|
| Forecast Data Period | 2026 - 2031 |
| Base Year Market Size (2025) | USD 36.09 Billion |
| Market Size (2026) | USD 38.18 Billion |
| Market Size (2031) | USD 50.55 Billion |
| Growth Rate (2026 - 2031) | 5.78 % |
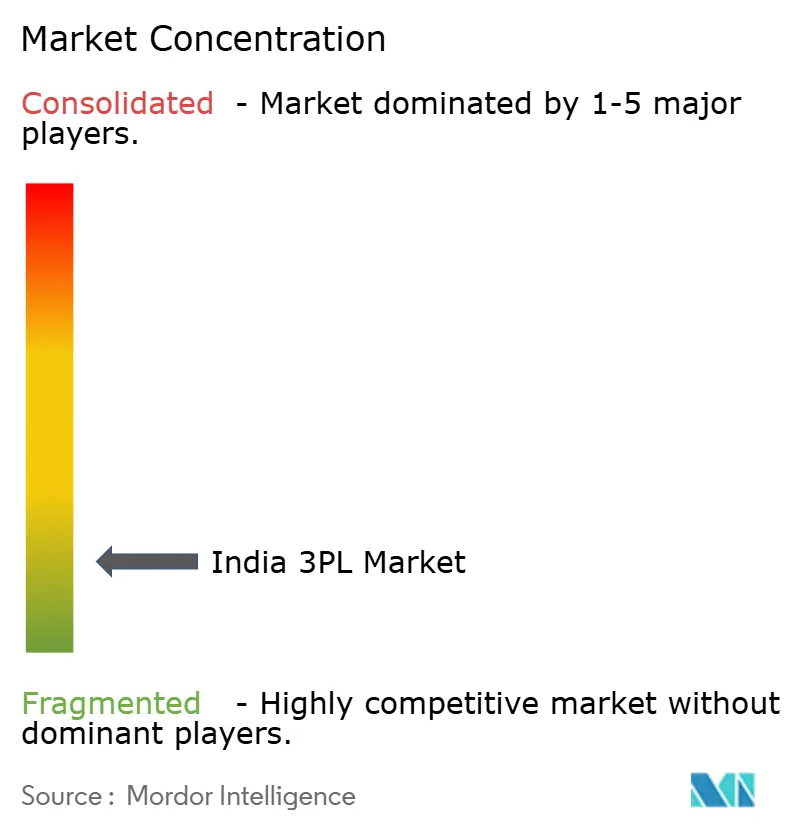
| Market Concentration | Low |
Major Players *Disclaimer: Major Players sorted in no particular order Image © Mordor Intelligence. Reuse requires attribution under CC BY 4.0. | |
India 3PL Market Analysis by Mordor Intelligence
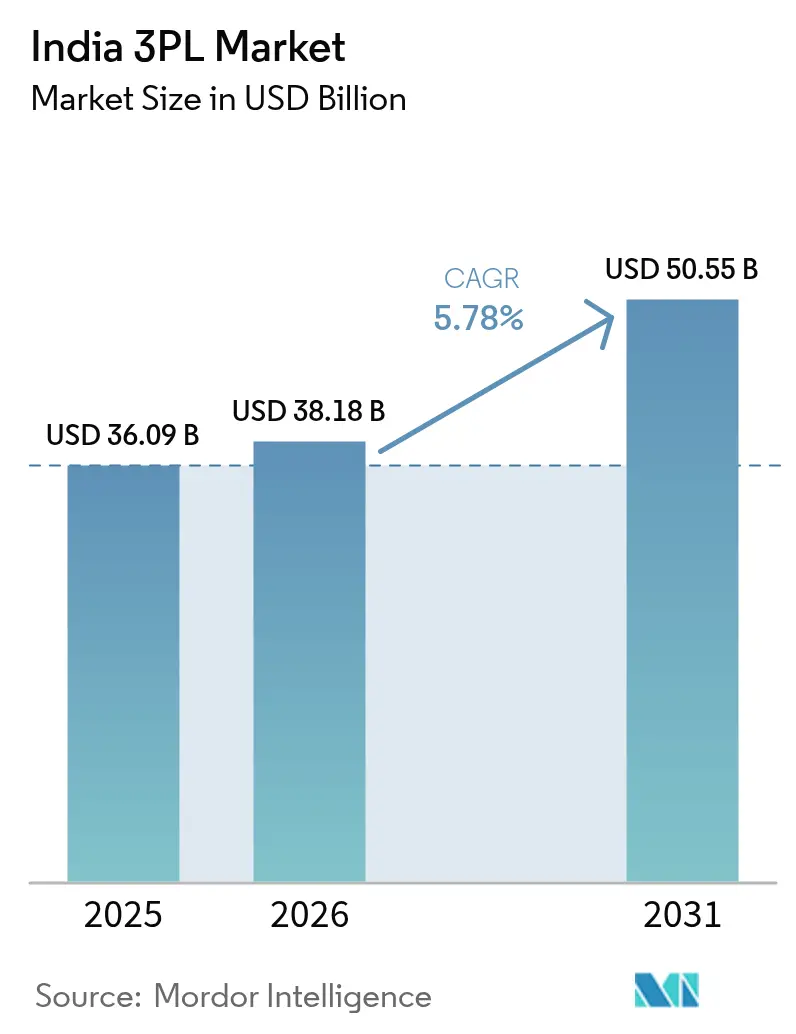
India 3PL market size in 2026 is estimated at USD 38.18 billion, growing from 2025 value of USD 36.09 billion with 2031 projections showing USD 50.55 billion, growing at 5.78% CAGR over 2026-2031.
Growth stems from multi-modal infrastructure upgrades, expanding export manufacturing, and digital platforms that compress delivery lead times while lowering fulfillment costs. Shippers increasingly demand real-time shipment visibility, pushing providers toward cloud control towers and automated sortation that convert fragmented networks into integrated solutions. Asset-light orchestration, coupled with selective investment in automated hubs, is becoming the preferred scaling model as firms balance capital discipline with service assurance. Regulatory incentives under the PM GatiShakti National Master Plan reinforce the transition, targeting a reduction in logistics expenditure from 13-14% of GDP toward single-digit global benchmarks.
Key Report Takeaways
- By service, domestic transportation management led with 55.40% revenue share of the India third-party logistics market in 2025. Value-added warehousing and distribution is advancing at a 6.84% CAGR, the fastest among all offerings, through 2031.
- By end user, E-commerce captured 26.80% share of the India third-party logistics market size in 2025, while life sciences & healthcare is projected to expand at an 7.92% CAGR through 2031.
- By logistics model, asset-light operators held 41.60% of the India third-party logistics market share in 2025; hybrid models exhibit the highest growth at a 6.55% CAGR to 2031.
- By Region, West India accounted for 28.70% of revenue in 2025, whereas South India is slated to post the quickest 6.96% CAGR on the back of technology and automotive clusters.
Note: Market size and forecast figures in this report are generated using Mordor Intelligence’s proprietary estimation framework, updated with the latest available data and insights as of 2026.
India 3PL Market Trends and Insights
Drivers Impact Analysis*
| Driver | (~) % Impact on CAGR Forecast | Geographic Relevance | Impact Timeline |
|---|---|---|---|
| E-commerce order-volume surge | +1.8% | West & South India concentration | Medium term (2-4 years) |
| Government infrastructure push | +1.2% | Nationwide; early gains in Delhi-NCR, Maharashtra, Karnataka | Long term (≥ 4 years) |
| FMCG & retail demand for integrated solutions | +0.9% | National; spill-over to tier-2/3 cities | Medium term (2-4 years) |
| MSME shift to multi-client automated warehouses | +0.7% | Gujarat, Tamil Nadu, Telangana | Short term (≤ 2 years) |
| Sustainability mandates from shippers | +0.4% | Maharashtra, Karnataka | Long term (≥ 4 years) |
| D2C & quick-commerce penetration | +0.6% | Tier-2/3 cities nationwide | Medium term (2-4 years) |
| Source: Mordor Intelligence | |||
E-commerce order-volume surge
Rapid growth in online shopping has shifted freight from bulk B2B pallets to millions of B2C parcels that demand precise last-mile execution. Quick-commerce platforms now promise two-hour delivery windows, compelling 3PLs to install micro-fulfillment nodes and AI-enabled sorters that compress cycle times. Providers such as Delhivery are pooling dark stores to boost network density for same-day reach. ONDC’s open network integrates hyperlocal specialists, giving smaller sellers instant access to nationwide delivery rails. Annual express-parcel movements are on course for double-digit expansion, and the provider that balances urban speed with rural reach will capture an outsized wallet share.
Government infrastructure push (Gati Shakti, DFCs)
A unified digital portal now synchronizes 44 ministries, enabling project approvals and cargo routing to converge on a single map. The completed Eastern and Western Dedicated Freight Corridors have already trimmed transit times for export consignments leaving Gujarat ports for northern consumption centers, lifting rail freight revenue and reliability. Over USD 602 billion in planned public investment under the National Infrastructure Pipeline is unlocking land for multimodal parks that knit road, rail, and coastal shipping into continuous corridors. For the India third-party logistics market, these corridors lower direct operating costs and encourage modal shifts that dilute road congestion[1]Press Information Bureau, “Eastern and Western Dedicated Freight Corridors: Operational Update,” Ministry of Railways, pib.gov.in.
FMCG & retail demand for integrated solutions
Consumer-goods majors are replacing fragmented trucking contracts with single-window 3PL relationships that envelop primary haulage, cross-docking, and value-added tasks such as kitting and labeling. Grade-A warehouse stock is on pace to surpass 300 million sq ft by 2025, and 3PL operators are behind one-quarter of that build-out to serve organized retail. Temperature-controlled nodes support fresh and packaged foods as modern trade reaches smaller cities. Real-time dashboards cut inventory buffers, letting brands shrink working capital while safeguarding service levels. Compliance under GST has further advantaged organized players that can automate e-way bill generation and audit trails[2]IBEF Research Team, “Indian Warehousing Market Report 2025,” India Brand Equity Foundation, ibef.org.
MSME shift to multi-client automated warehouses (ONDC)
ONDC’s roll-out across 85 cities connects thousands of micro-sellers to plug-and-play logistics modules. Shared facilities divide fixed costs and offer robotics-enabled picking that was once the preserve of large retailers. Government incentives extend soft loans for racking and sorting automation, lowering the entry barrier for professional warehousing. Platforms such as Shiprocket bolt stock visibility to storefronts across beauty, fashion, and electronics, reinforcing omnichannel fulfilment. The India third-party logistics market consequently gains new volume streams from MSMEs that previously relied on informal trucking[3]Thampy Koshy, “ONDC Progress Report September 2024,” Open Network for Digital Commerce, ondc.org.
Restraints Impact Analysis*
| Restraint | (~) % Impact on CAGR Forecast | Geographic Relevance | Impact Timeline |
|---|---|---|---|
| Fragmented trucking capacity & low visibility | -0.8% | East & Central India | Medium term (2-4 years) |
| Rising fuel, toll, and compliance costs | -0.6% | Long-haul corridors nationwide | Short term (≤ 2 years) |
| Warehouse-automation talent crunch | -0.4% | Major logistics hubs | Medium term (2-4 years) |
| Data-localization-driven IT-cost inflation | -0.3% | Large operators | Long term (≥ 4 years) |
| Source: Mordor Intelligence | |||
Fragmented trucking capacity & low visibility
Road freight still leans on millions of single-truck owners who operate without telematics or route optimization. The dominance of such micro-fleets erodes service reliability, inflates empty-haul mileage, and limits the real-time updates shippers expect. Multiple roadside inspections exacerbate dwell times, particularly on east-bound lanes where infrastructure lags. Although digital freight exchanges are emerging, adoption remains uneven, keeping the visibility gap wide for the India third-party logistics market.
Rising fuel, toll, and compliance costs
Diesel accounts for up to 40% of door-to-door road costs, and every upward tick in pump prices compresses provider margins. Toll hikes on national highways widen route economics between rail and road, nudging 3PLs to re-engineer line-haul configurations. GST slabs lifted levies on handling services, amplifying administrative overhead. Fleet upgrades to BS-VI norms raise capital outlay, while mandatory e-way bills add paperwork costs for operators lacking automated back-office systems.
*Our forecasts treat driver/restraint impacts as directional, not additive. The impact forecasts reflect baseline growth, mix effects, and variable interactions.
Segment Analysis
By Service: Transportation dominates while warehousing accelerates
Domestic transportation management generated 55.40% of India's third-party logistics market in 2025, reflecting the economy’s continued road dependence for inter-city cargo. Fuel volatility and driver scarcity, however, are pressuring margins, pushing incumbents toward route optimization algorithms and relay trucking concepts. Value-added warehousing & distribution is growing at a 6.84% CAGR, the fastest among all services, as omnichannel retailers demand deferred customization, kitting, and temperature-controlled storage. Dedicated freight corridors funnel more bulk product to rail, nudging road-only operators to partner for line-haul legs, a shift that exemplifies the market’s multimodal evolution.
Automated storage and retrieval systems and goods-to-person robots are now standard in new builds, and cloud WMS lets 3PLs integrate inventory views across multiple clients in real time. International transportation rides on India’s export ambitions; alliances like Delhivery–Team Global Logistics offer LCL connectivity to 120 countries. Coastal shipping remains niche but gains relevance under Sagarmala, while airfreight addresses time-critical pharma and electronics consignments. As customers prize turnkey visibility, providers that knit these modes into one control-tower dashboard are winning longer contracts and cross-selling opportunities in the India third-party logistics market.


By End User: E-commerce leads while healthcare surges
E-commerce occupied 26.80% of the India third-party logistics market share in 2025, thanks to a quadrupling in grade-A warehousing since 2017 and the march of quick-commerce into tier-3 districts. Order patterns have fragmented into high-frequency, low-value parcels that strain legacy hub-and-spoke models, fueling investment in regional sort centers and delivery lockers. Life sciences & healthcare shows the highest 7.92% CAGR to 2031. Export-oriented pharmaceutical clusters around Hyderabad and Ahmedabad require GDP-certified cold chain, lane validation, and regulatory documentation. Vaccine distribution and specialty biologics have accelerated demand for validated packaging and multi-temperature storage.
Automotive volumes stabilize as OEMs shift to just-in-time sequencing and explore electric-vehicle component flows, creating needs for hazmat battery transport and reverse logistics. Production-Linked Incentive schemes spur electronics and textile factories to scale, feeding new B2B flows. Temperature-controlled segments in food & beverages capitalize on rising urban disposable incomes, pushing 3PLs to extend refrigerated capacity deeper into smaller towns. Energy projects, particularly renewables, draw specialized heavy-lift and last-mile microgrid deliveries, broadening the India third-party logistics market canvas.

By Logistics Model: Asset-light prevails while hybrid gains momentum
Asset-light orchestration captured 41.60% of 2025 revenue, validating a strategy that privileges network reach over fixed-asset ownership. Tech platforms match loads with third-party carriers, turning variable costs into a leverable advantage. Yet hybrid models, combining strategic asset control with outsourced spokes, are expanding at a 6.55% CAGR. Providers selectively own automated mega-hubs and trailer pools for peak assurance while subcontracting last-mile vans to regional partners. Asset-heavy players maintain end-to-end control but face utilization risk.
API-first platforms let hybrid operators surface unified visibility, enabling dynamic SLA allocation regardless of asset owner. ONDC integration makes dormant capacity discoverable, effectively expanding the virtual fleet for asset-light orchestrators. As contract tenures lengthen and customers audit ESG metrics, selective asset ownership—especially electric vehicle fleets—can hedge supply risk and bolster sustainability credentials in the India third-party logistics market.
Geography Analysis
West India led with a 28.70% share in 2025, propped up by Maharashtra’s Mumbai-Pune industrial belt and Gujarat’s twin-port engine of JNPT and Kandla. Automotive, pharma, and chemical exporters rely on dense road-rail-port linkages, and the Western Dedicated Freight Corridor now moves containers from hinterland factories to docks faster than legacy lines. Grade-A warehouses continue to cluster along the NH-48 corridor, though land prices and congestion push new facilities toward peripheral nodes. Providers with rail-road transloading capability gain an edge by blending cheaper rail for trunk movement with road for the final 100 km stretch.
South India is on track for the fastest 6.96% CAGR through 2031. Bangalore anchors high-value electronics returns and forward flows, demanding secure cross-dock and reverse logistics. Chennai’s auto OEMs integrate inbound sequencing yards with just-in-time assembly, requiring hour-level precision. Hyderabad’s pharmaceutical exports call for GDP-qualified cold rooms and validated packaging lanes. Ports such as Chennai, Ennore, Krishnapatnam, and Visakhapatnam provide multimodal exits, lowering dwell times for export boxes. 3PLs that align hub locations to this mixed cargo base are positioned to capture recurring contract revenue within the India third-party logistics market.
North India’s Delhi-NCR remains a consumption magnet, feeding steady FMCG and retail inbound tonnage. Connectivity upgrades like the 121-km Haryana Orbital Rail Corridor will divert industrial freight away from saturated urban arterials, unlocking land for new logistics parks. Seasonal farm output from Punjab and Haryana, however, imposes capacity peaks that strain fragmented truck supply. East India, historically constrained by limited industry and infrastructure gaps, is set to benefit as the Eastern Dedicated Freight Corridor links Kolkata hinterlands to northern demand centers. Central India, with land-locked Madhya Pradesh at its core, is pitching itself as a pan-India DC location, leveraging equidistant access to four metros and offering lower real-estate costs.
Regulatory Landscape
India's 3PL operating environment is shaped by the National Logistics Policy and PM GatiShakti governance, coordinated through the Empowered Group of Secretaries and the Logistics Division under the Department of Commerce. A key direction is digitization and interoperability, with the Unified Logistics Interface Platform (ULIP) integrating data across government systems to standardize processes and improve end-to-end shipment visibility for shippers and logistics providers.
Trade and border compliance is shifting toward mandatory electronic filings and reduced manual intervention. The Central Board of Indirect Taxes and Customs (CBIC) is rolling out pan-India Sea Cargo Manifest and Transhipment Regulations (SCMTR) electronic message filing, with transition relief extended through 31 August 2026 (excluding Import Transhipment), while customs automation initiatives increasingly route container movement monitoring through ICEGATE rather than manual gate checks. On safety, the Ministry of Ports, Shipping and Waterways issued draft Merchant Shipping (Carriage of Dangerous Goods) Rules, 2026, which reference SOLAS and the IMDG Code and reinforce standardized packaging, testing, and certification practices for hazardous cargo movements.
Value Chain Analysis
India's 3PL value chain runs from shipper procurement and order capture (including e-commerce and MSME sellers) to origin pick-up and first-mile consolidation, then line-haul movement (road-dominant with rising rail trunking on freight corridors), followed by destination distribution via sort centers, multi-client warehouses, and last-mile delivery partners. Providers differentiate through orchestration layers such as control towers, transport management systems, and warehouse management systems, increasingly connected to government digital rails through ULIP; this data layer works alongside physical assets including hubs, cross-docks, cold rooms, and transloading points at ports and inland terminals.
Corridor-led infrastructure is tightening the link between nodes in the chain, shifting value creation toward multimodal planning, container and trailer turn-time reduction, and inventory positioning. Evidence of this shift includes Dedicated Freight Corridor commissioning reaching 2,741 km by March 2026 (over 96% of the planned network), the commissioning of 118 Gati Shakti Cargo Terminals out of 306 approved proposals, and ongoing planning for 35 Multimodal Logistics Parks under Bharatmala. Bottlenecks increasingly sit outside ports and terminals, such as urban access, last-mile connectivity, and fragmented trucking capacity, which keeps aggregation, compliant documentation, and carrier digitization as points where organized 3PLs capture margin and improve service reliability.
Competitive Landscape
The competitive terrain is transitioning from fragmented regional operators to a tiered structure of pan-India giants, tech-first disrupters, and niche specialists. Incumbents such as Allcargo, Mahindra Logistics, and TVS Supply Chain leverage multimodal assets, while digital natives like Delhivery emphasize cloud orchestration and data analytics. Delhivery’s USD 170 million purchase of Ecom Express in 2025 unlocks network overlap savings and raises the entry bar for mid-sized parcel players.
International integrators—DHL, FedEx, and Kuehne + Nagel—retain strongholds in temperature-controlled pharma and automotive sequencing but face price competition on domestic lanes. Growth white space lies in tier-2/3 cities where organized penetration remains shallow; here, shared dark stores and drone pilots promise differentiated reach. Sustainability is emerging as a tie-breaker; early adopters of electric vans and solar-powered DCs secure mandates from ESG-focused shippers. Compliance mastery around GST, e-invoicing, and safety certifications serves as a moat, nudging informal fleets either toward aggregation platforms or exit. Over the next five years, industry observers expect accelerated roll-ups as capitalized leaders consolidate scale, data, and talent-dense automation infrastructure within the India third-party logistics market.
India 3PL Industry Leaders
Allcargo Logistics Ltd.
DHL Supply Chain India
Mahindra Logistics Ltd.
TVS Supply Chain Solutions Ltd.
Delhivery Ltd.
- *Disclaimer: Major Players sorted in no particular order

Market Opportunities and Future Outlook
Investment and program execution across ports, corridors, and inland logistics hubs are creating whitespace for 3PLs that can combine multimodal planning with compliant, technology-led execution. Notable proof points include RSA Global's June 2026 MoU with the Government of Maharashtra to develop an automated empty container yard at JNPA (Uran) with a reported investment of INR 2,580 crore, and JNPA commencing development of a 62-acre empty container yard with Phase I scheduled to be operational in July 2026. These developments support opportunities in container logistics services (empty repositioning, depot operations, and faster gate-to-gate movement), alongside value-added warehousing and cross-dock operations aligned to western port gateways.
Inland consolidation hubs and regional warehousing expansion also support demand for integrated 3PL offerings that include multi-client storage, inventory visibility, and secondary distribution into tier-2/3 consumption centers. Uttar Pradesh's approval of a Multi-Modal Logistics Hub in Dadri (823 acres, INR 7,064 crore) anchors NCR-linked distribution planning, while work on Mundra's fifth container terminal (CT5) by Adani Ports, with an initial 1 million TEU capacity target referenced for October 2026, increases the need for inland haulage orchestration and port-adjacent staging. Alongside physical infrastructure, the widening footprint of ULIP-integrated processes creates room for 3PLs to productize compliance, documentation, and track-and-trace services for MSMEs and cross-border shippers that want standardized digital workflows.
Recent Industry Developments
- July 2026: Allcargo Logistics executed a definitive share purchase agreement to acquire the remaining 25% stake in Allcargo Group Services Private Limited. The transaction consolidates control over domestic warehousing and fulfillment support capabilities, strengthening Allcargo's ability to offer integrated solutions across warehousing, distribution, and ancillary logistics services.
- November 2025: DHL Group announced a multi-year investment program of around EUR 1 billion in India through 2030. The commitment targets logistics infrastructure such as health logistics hubs and automated sorting, raising the competitive bar for network quality and specialized handling in organized 3PL services.
- October 2025: Mahindra Logistics opened two Grade-A warehousing facilities in Guwahati and Agartala, adding more than 4 lakh square feet of capacity as part of its Go-East expansion. The added footprint improves serviceability for the North-East region and supports multi-client distribution models for manufacturers and e-commerce shippers.


Research Methodology Framework and Report Scope
Market Definition and Coverage
For this study, the India 3PL market is defined as revenue earned by third-party logistics providers for outsourced logistics work in India, including transportation management, warehousing and distribution, and related value-added services that are billed to shippers.
Scope exclusions: In-house (captive) logistics operations run by shippers themselves and pure last-mile gig delivery that is not contracted as a 3PL service are not counted.
Segmentation Overview
- By Service
- Domestic Transportation Management (DTM)
- Roadways
- Railways
- Airways
- Waterways
- International Transportation Management (ITM)
- Roadways
- Railways
- Airways
- Waterways
- Value-Added Warehousing & Distribution (VAWD)
- Domestic Transportation Management (DTM)
- By End User
- Automotive
- Energy & Utilities
- Manufacturing
- Life Sciences & Healthcare
- Technology & Electronics
- E-commerce
- Consumer Goods & FMCG
- Food & Beverages
- Others
- By Logistics Model
- Asset-Light
- Asset-Heavy
- Hybrid
- By Region (Value)
- North India
- Delhi-NCR
- Punjab
- Haryana
- Others
- South India
- Karnataka
- Tamil Nadu
- Telangana
- Others
- West India
- Maharashtra
- Gujarat
- Others
- East India
- West Bengal
- Odisha
- Others
- Central India
- Madhya Pradesh
- Chhattisgarh
- North India
Data Sources, Market Sizing, and Validation
Desk Research
Desk research was used to set the operating context and to anchor the model to repeatable public indicators. We referred to official and non-paywalled sources such as the Ministry of Road Transport and Highways for freight corridor and road movement signals, Indian Railways and Dedicated Freight Corridor updates for modal capacity shifts, and the Ministry of Commerce and Industry trade statistics to read import-export linked logistics demand.
To avoid building the market on a single proxy, we also checked sources such as the National Sample Survey and periodic government releases that reflect warehousing activity and services output, along with customs and port authority dashboards where available. Company annual reports, investor presentations, and reputable business press were then used to map service mixes, client industries, and pricing direction. We also used paid subscriptions for company financials and intelligence, and for shipment-level import-export datasets to validate corridor intensity. The sources listed here are illustrative only, and many other references were used during data collection, validation, and clarification.
Primary Interviews and Surveys
Primary work focused on confirming which outsourced logistics activities are contracted as 3PL in practice, and how billing structures move with fuel, labor, and warehousing rents. We spoke with a mix of 3PL operators, freight forwarders, warehouse specialists, and shipper-side logistics teams across major consumption and production clusters, so gaps from desk inputs could be closed and assumptions could be challenged before finalizing totals.
Distribution of primary research fieldwork respondents
| Company type | Respondent position |
|---|---|
| Top tier: 34% | CXOs: 13% |
| Mid tier: 46% | Functional/Unit leaders: 27% |
| Smaller Players: 20% | Managers: 60% |
Market-Sizing & Forecasting
Market sizing started with a top-down reconstruction where India logistics demand was built from trade and domestic movement signals, and then filtered through outsourcing penetration to arrive at the 3PL revenue pool. Where the math needed grounding, we corroborated totals using selective bottom-up approximations such as sampled provider revenue run-rates, service mix splits, and sanity checks on average billing per shipment lane and per occupied square foot.
Inputs used in the model include freight activity by mode (road and rail signals), manufacturing and retail output trends that influence shipment frequency, warehousing stock additions and vacancy movement that affect storage revenue, fuel price direction and tolling changes that move line-haul pricing, and the pace of e-commerce parcel growth that changes fulfillment handling intensity. Forecasting was carried out using scenario analysis supported by simple multivariate relationships, where growth is linked to industrial output, trade growth, and infrastructure execution, and then moderated by primary feedback on pricing pass-through and contract tenures. When bottom-up information was missing for smaller operators, gaps were handled through calibrated ratios based on corridor density and service mix observed in interviews.
Data Validation & Update Cycle
Validation was done in layers so the output does not rely on one assumption. We compared the modeled market totals against independent signals like warehousing capacity additions, trade-linked freight movement, and services output trends, and then rechecked any sharp year-on-year swings for data breaks or one-time events.
Before sign-off, the model goes through peer review with variance checks on key inputs such as outsourcing rates, price escalation, and mode mix, followed by targeted re-contact with respondents when a mismatch persists. Reports are refreshed annually, and interim updates are made when material events occur, such as policy changes that impact freight costs or major infrastructure commissioning. Right before delivery, a final pass is run so clients receive the latest updated view.
Mordor Intelligence's India 3pl Market Sizing Compared With Other Published Estimates
Published market sizes for India 3PL can look far apart, even when they sound like they cover the same topic, because the scope boundary is not always consistent and the input variables are not always tied to visible demand indicators. Differences also show up when one estimate leans heavily on a single growth assumption, while another links the forecast to trade, industrial output, and pricing drivers.
By tracking corridor-level freight indicators and refreshing outsourcing penetration with periodic primary checks, the market size remains tied to contracted services in India, consistent with Mordor Intelligence, rather than adjacent logistics activity that is not billed as 3PL. Some studies appear to use a faster price progression or a broader definition that blends contract logistics with wider freight services, while others rely on a base year that is not aligned to recent cost pass-through cycles and capacity additions.
Benchmark comparison
| Source | Market Size | Gaps in Research Methodology |
|---|---|---|
| Mordor Intelligence | USD 38.18 B (2026) | |
| Industry Publisher A | USD 34.26 B (2024) | Uses a different base year and a longer horizon, and the page-level method notes are limited on how outsourcing penetration and price pass-through are validated, which can pull the current market value down versus a contracted-revenue view. |
| Industry Publisher B | USD 38.74 B (2025) | Starts from a 2025 base and applies a higher long-range growth path, and it can shift totals if warehousing, value-added services, and transport are bundled with different inclusions or if currency timing differs across years. |
Across the three values, the spread is mainly explained by base year selection, what is treated as billable 3PL revenue versus wider logistics spend, and how pricing escalation is carried forward. When those boundaries and update steps are made explicit, the market size becomes easier to trace back to real freight and warehousing signals, and it also becomes simpler to replicate year to year.


Key Questions Answered in the Report
How large is the India third-party logistics market in 2026?
The market stands at USD 38.18 billion and is on a 5.78% CAGR trajectory toward USD 50.55 billion by 2031.
Which service segment is growing quickest?
Value-added warehousing and distribution is expanding at a 6.84% CAGR thanks to omnichannel fulfillment demand.
What end-user vertical shows the fastest logistics growth?
Life sciences & healthcare leads with an 7.92% CAGR driven by cold-chain pharmaceutical exports.
Why are hybrid logistics models gaining ground?
They blend ownership of critical automation assets with outsourced route legs, balancing capital efficiency and service control.
Which region is expected to post the highest growth?
South India is forecast to grow at 6.96% CAGR on the back of technology, automotive, and pharma clusters.
How is government policy influencing logistics costs?
PM GatiShakti corridors and ULIP digital integration are designed to push logistics costs toward single-digit GDP levels by enhancing multimodal efficiency.
Page last updated on:


 Your data is secure and never sold or shared.


