Market Overview
| Study Period | 2020 - 2031 |
|---|---|
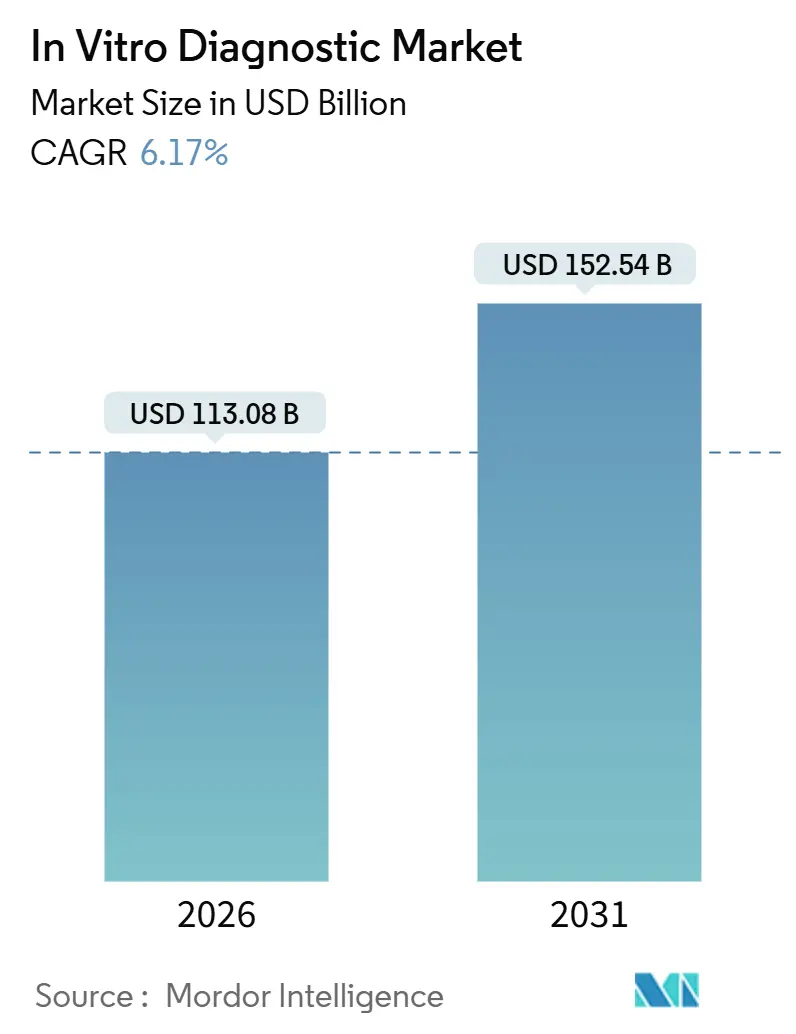
| Market Size (2026) | USD 113.08 Billion |
| Market Size (2031) | USD 152.54 Billion |
| Growth Rate (2026 - 2031) | 6.17% CAGR |
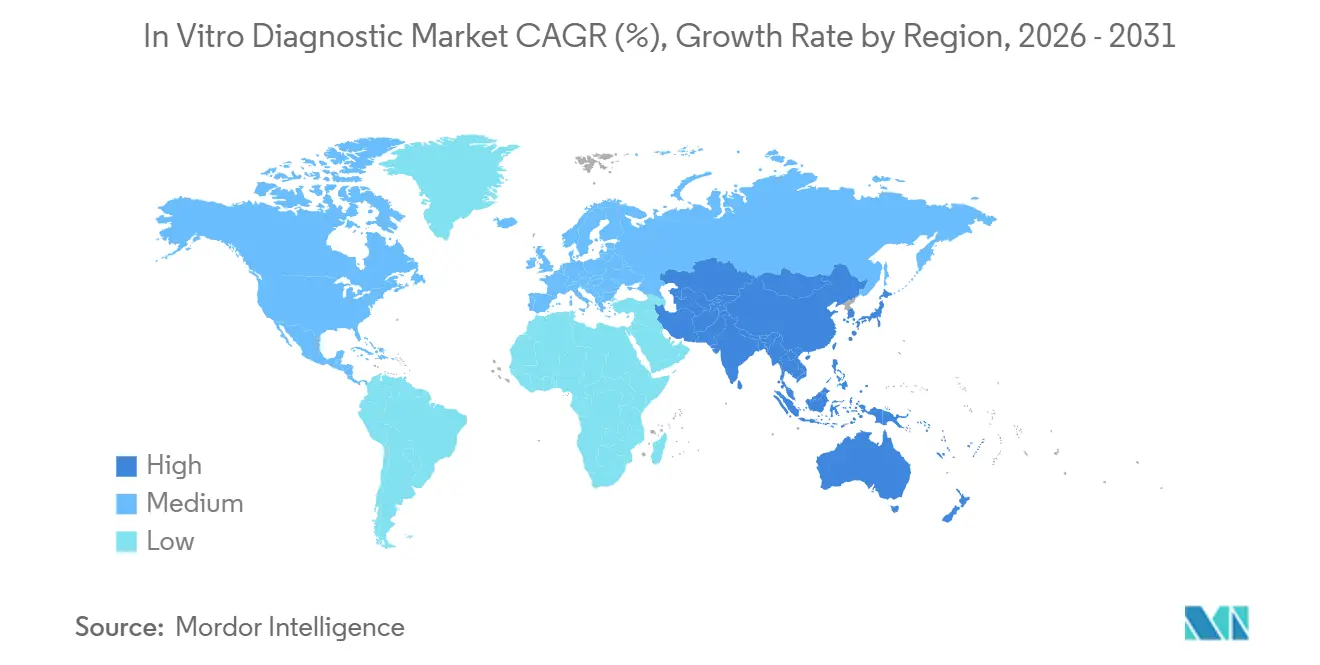
| Fastest Growing Market | Asia Pacific |
| Largest Market | North America |
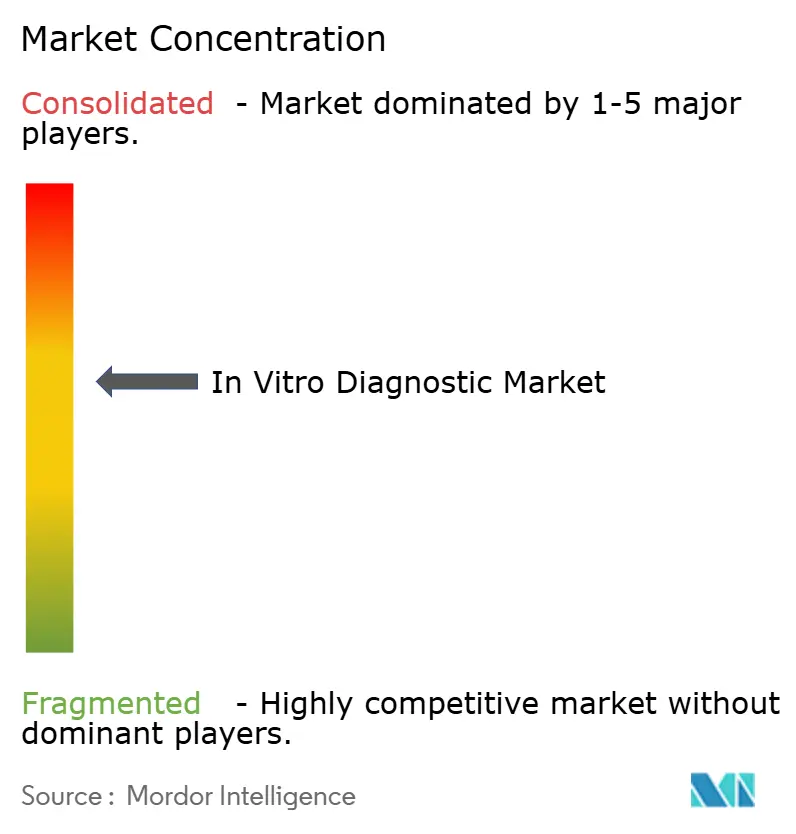
| Market Concentration | Medium |
Major Players *Disclaimer: Major Players sorted in no particular order Image © Mordor Intelligence. Reuse requires attribution under CC BY 4.0. | |
In Vitro Diagnostic Market Analysis by Mordor Intelligence
The In Vitro Diagnostic Market size is estimated at USD 113.08 billion in 2026, and is expected to reach USD 152.54 billion by 2031, at a CAGR of 6.17% during the forecast period (2026-2031).
Chronic disease prevalence, an aging global population, and artificial intelligence workflows now drive demand more sustainably than the pandemic surge. Laboratories are investing in cloud-based middleware, bundled reagent rental contracts, and integrated automation to contain labor costs and shorten turnaround times. Competitive pressure from ISO 13485-certified regional suppliers is compressing reagent margins, prompting multinationals to emphasize service bundles and decision-support software. Regulatory fragmentation, workforce shortages, and cybersecurity vulnerabilities remain structural headwinds; however, rising test volumes in the Asia-Pacific region and the increasing number of decentralized sites offset these constraints.
Key Report Takeaways
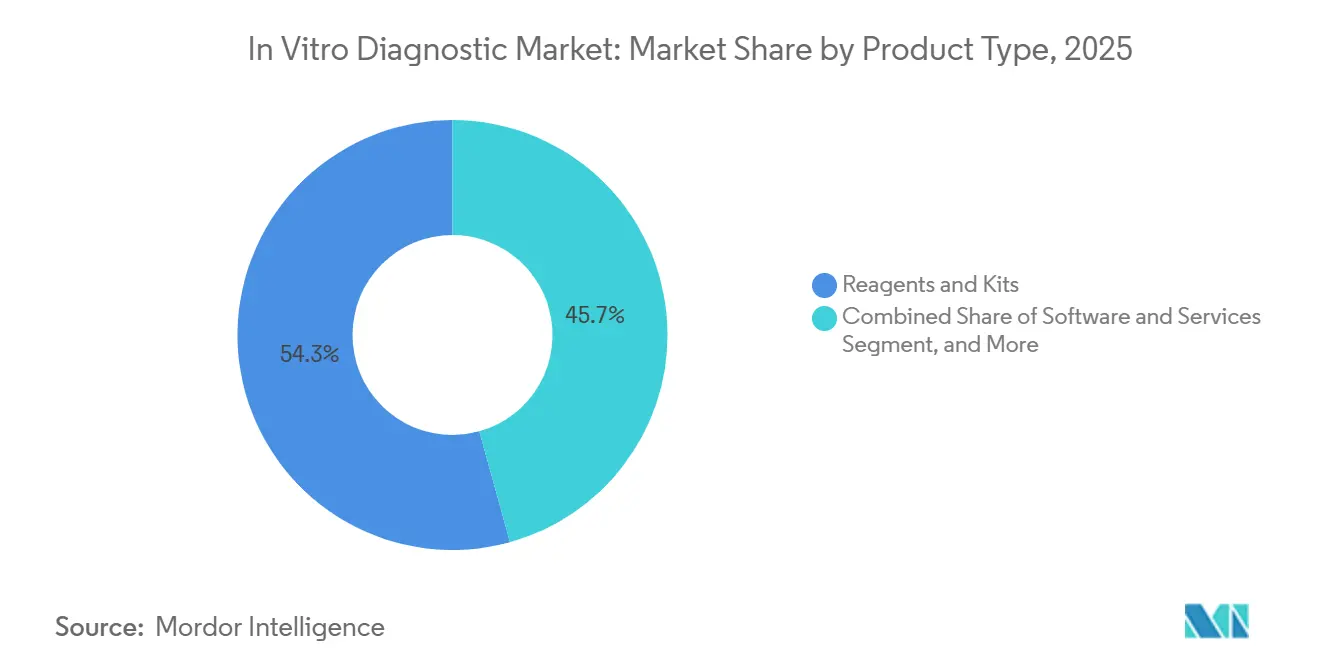
- By product type, reagents and kits accounted for 54.28% of revenue in 2025, while software and services are forecast to expand at a 10.29% CAGR through 2031.
- By technology, immunoassay led with 26.63% revenue share in 2025; molecular diagnostics are projected to advance at an 8.21% CAGR through 2031.
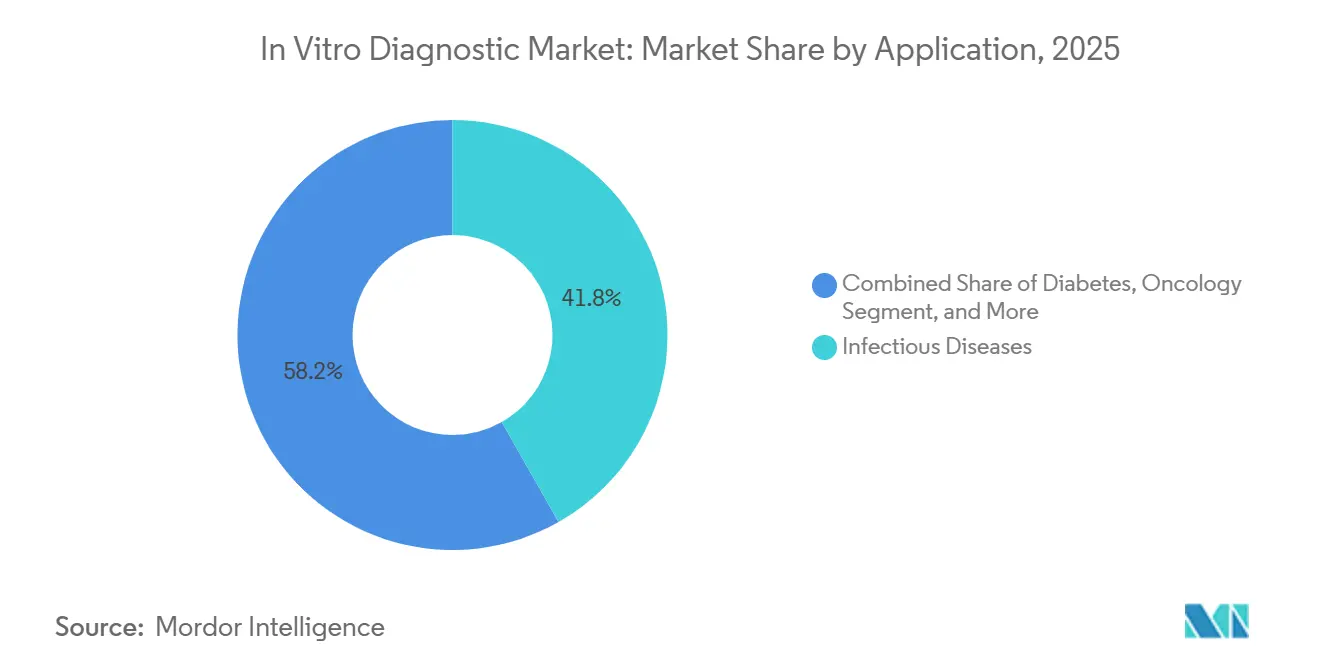
- By application, infectious diseases accounted for 41.76% of the in vitro diagnostic market share in 2025, whereas oncology is set to grow at a 9.94% CAGR to 2031.
- By end user, hospitals and academic laboratories held 48.28% share in 2025; point-of-care sites are poised for 7.94% CAGR through 2031.
- By geography, North America captured 37.16% of 2025 revenue, yet Asia-Pacific is forecast to register a 7.19% CAGR to 2031.
Note: Market size and forecast figures in this report are generated using Mordor Intelligence’s proprietary estimation framework, updated with the latest available data and insights as of January 2026.
Global In Vitro Diagnostic Market Trends and Insights
Drivers Impact Analysis
| Driver | (~) % Impact on CAGR Forecast | Geographic Relevance | Impact Timeline |
|---|---|---|---|
| Expanding Adoption of Point-of-Care Diagnostics | +1.2% | North America, Europe, Asia-Pacific urban centers | Medium term (2-4 years) |
| High Prevalence of Chronic Diseases | +1.5% | North America, Europe, Urban Asia-Pacific | Long term (≥ 4 years) |
| Aging Population Boosting Testing Volumes | +0.9% | Europe, Japan, South Korea, China | Long term (≥ 4 years) |
| Growing Infectious-Disease Burden | +0.8% | Sub-Saharan Africa, South Asia, Latin America | Short term (≤ 2 years) |
| Surge in Decentralized POC Testing | +1.0% | North America, Europe, Asia-Pacific | Medium term (2-4 years) |
| Lab Automation & Digital Pathology Convergence | +0.7% | North America, Europe, Developed Asia-Pacific | Medium term (2-4 years) |
| Source: Mordor Intelligence | |||
Expanding Adoption of Point-of-Care (POC) Diagnostics
Regulators expanded CLIA-waived categories in 2024 and 2025, allowing pharmacies and employer clinics to perform rapid strep, influenza, and lipid panels without requiring laboratory staff. Retail chains such as CVS Health and Walgreens now capture routine tests that once flowed to reference labs, forcing central facilities to specialize in esoteric sequencing and autoimmune panels.[1]“CVS Health Expands Access to Care with New MinuteClinic Services,” CVS Health, cvshealth.com FDA clearance of Dexcom’s over-the-counter continuous glucose monitor in 2024 demonstrated that consumer electronics firms can bypass legacy infrastructure entirely. Handheld immunoassay readers and smartphone-linked lateral-flow devices meet hospital-grade precision, narrowing the performance gap that protected central labs. This decentralization boosts test access but squeezes reagent volumes in high-margin hospital settings.
High Prevalence of Chronic Diseases
Diabetes, cardiovascular disease, and chronic kidney disease drove 1.3 billion diagnostic procedures in 2025, straining global laboratory capacity.[2]“Diabetes,” World Health Organization, who.int Diabetes prevalence climbed to 537 million adults in 2024, with the fastest growth in South Asia and the Middle East. Each chronic-care patient requires serial lipid, troponin, and kidney-function assays, raising consumable demand even as reimbursement remains flat. Wearable biosensors now continuously stream glucose and lactate data, shifting some monitoring from venipuncture to cloud analytics. Vendors, therefore, bundle laboratory reporting with longitudinal analytics subscriptions to preserve revenue even as traditional consumable sales plateau.
Aging Population Boosting Chronic Disease Testing Volumes
Citizens aged 65 plus generate a disproportionate share of chemistry panels. Japan’s over-75 cohort alone accounted for 47% of all clinical-chemistry tests in 2024.[3]“Ministry of Health, Labour and Welfare, Japan,” mhlw.go.jp Reimbursement cuts compelled laboratories to automate, integrating cartridge-based multiplex assays that combine hemoglobin A1c, creatinine, and lipid markers in a single run, thereby reducing labor time per specimen. China’s 2025 rural screening program for residents over 60 secured fixed-price contracts favoring high-volume reagent producers. Rising cancer incidence within aging populations likewise increases demand for tumor markers and liquid-biopsy monitoring, embedding advanced diagnostics deep into chronic-care pathways.
Growing Infectious-Disease Burden Fueling Rapid Diagnostics
Following the pandemic, hospitals adopted multiplex PCR panels that detect up to 30 pathogens in a single cartridge, maintaining high utilization even as COVID-19 testing subsided. WHO reported 10.8 million new tuberculosis cases in 2024, with 410,000 drug-resistant infections requiring two-hour molecular resistance profiling. Donor-funded programs distributed 120 million malaria rapid tests in 2024, reinforcing demand for low-infrastructure assays across Sub-Saharan Africa. Primary-care sites value a 15-minute turnaround, which improves antimicrobial stewardship and reduces hospital admissions, thereby sustaining growth in molecular diagnostics.
Restraint Impact Analysis
| Restraint | (~) % Impact on CAGR Forecast | Geographic Relevance | Impact Timeline |
|---|---|---|---|
| Stringent Multi-Region Regulatory Timelines | -0.6% | Europe, Asia-Pacific, North America | Medium term (2-4 years) |
| Reimbursement Uncertainty for Emerging Tests | -0.5% | North America, Europe, Asia private payers | Medium term (2-4 years) |
| Cybersecurity & Data Interoperability Gaps | -0.3% | Connected infrastructures in North America, Europe | Short term (≤ 2 years) |
| Global Shortage of Skilled Lab Technologists | -0.4% | North America, Europe, Developed Asia-Pacific | Long term (≥ 4 years) |
| Source: Mordor Intelligence | |||
Stringent Multi-Region Regulatory Approval Timelines
The European Union’s IVD Regulation, fully enforced in May 2024, transitioned thousands of low-risk assays from self-certification to notified-body review, resulting in a median approval time of 22 months. Japan and China impose parallel data requirements, adding 18 to 24 months before multinational launches reach the Asia region. Small innovators lack the regulatory manpower to run simultaneous trials, so they prioritize the United States first, ceding early share abroad. Staggered launches delay global scale and allow fast-follower rivals to secure reimbursement ahead of pioneers, marginally shaving the in vitro diagnostic market CAGR.
Reimbursement Uncertainty Across Emerging Test Classes
CMS issued non-coverage decisions for several multi-cancer early-detection tests in 2024 due to the limited availability of mortality data. Private insurers echoed the stance, forcing laboratories to self-pay or negotiate risk-sharing contracts. FoundationOne CDx receives a Medicare reimbursement of USD 5,800, whereas comparable assays lacking FDA approval often face claim denials. Laboratories hesitate to deploy costly oncology panels until reimbursement is stabilized, slowing the adoption curve even after regulatory clearance.
Segment Analysis
By Product Type: Consumables Anchor Revenue, Software Captures Growth
Reagents and kits accounted for 54.28% of 2025 revenue, underscoring the consumable-based economics that sustain most laboratories. Hospitals favor reagent-rental agreements that waive analyzer acquisition costs in exchange for multi-year consumable purchases, a model that smooths vendor revenue. Software and services are forecast to post a 10.29% CAGR through 2031, powered by AI decision-support, cloud-hosted middleware, and remote instrument diagnostics. Instruments remain vital as lock-in platforms; Siemens Healthineers’ Atellica Solution processes 440 tests per hour and auto-verifies 85% of results, saving labor minutes per report. The in vitro diagnostic market size for software is currently small, but its double-digit trajectory signals a shift by laboratories toward analytics and compliance outsourcing.
Software now decouples from hardware under the FDA’s Software-as-a-Medical-Device framework, enabling independent algorithm upgrades. Vendors differentiate by pairing cloud dashboards with quality-control materials, creating sticky ecosystems. As capital budgets tighten, revenue from reagent rental and subscription-based software will rise faster than hardware placements, reshaping vendor profit pools within the in vitro diagnostic market.
Note: Segment shares of all individual segments available upon report purchase
Get Detailed Market Forecasts at the Most Granular Levels
Download PDF
By Technology: Molecular Diagnostics Outpace Legacy Platforms
Immunoassay retained a 26.63% revenue share in 2025, driven by thyroid, cardiac, and tumor markers. Yet, molecular diagnostics are projected to expand at an 8.21% CAGR, driven by liquid biopsy approvals, CRISPR assays, and syndromic infectious disease panels. Clinical chemistry automation has commoditized metabolic panels, so vendors now differentiate themselves through faster throughput and middleware integration rather than reagent chemistry. Hematology platforms incorporate AI-based cell classification, while microbiology shifts from culture to MALDI-TOF for rapid identification in 15 minutes.
Technology convergence is blurring legacy silos; next-generation platforms combine immunoassay, molecular techniques, and mass spectrometry on a single track. Laboratories welcome consolidated workflows that reduce sample handling, minimize error risk, and contain labor costs. As these hybrid systems scale, the in vitro diagnostic market will shift toward multi-modal analyzers that integrate AI-driven sample triage, increasing switching costs and solidifying vendor relationships.
By Application: Oncology Accelerates, Infectious Disease Stabilizes
Infectious diseases accounted for 41.76% of 2025 revenue, buoyed by multiplex respiratory panels that remained in use after the pandemic peaks. Growth, however, is moderating as COVID-19 volumes return to normal. Oncology diagnostics, in contrast, are projected to increase by 9.94% per year to 2031, driven by companion diagnostics and minimal residual disease liquid biopsies, such as Guardant360. Diabetes testing remains a high-volume market but faces price pressure as continuous glucose monitors become available over the counter.
Cardiology markers are migrating to emergency department POC settings, while autoimmune and nephrology panels are gaining market share through multiplex formats that enhance diagnostic efficiency. Oncology’s higher reimbursement and clinical urgency drive capital investment in sequencing, flow cytometry, and mass spectrometry, positioning cancer testing as the fastest-growing slice of the in vitro diagnostic market.
Note: Segment shares of all individual segments available upon report purchase
Get Detailed Market Forecasts at the Most Granular Levels
Download PDF
By End User: Point-of-Care Sites Gain Share, Hospitals Retain Complexity
Hospitals and academic centers accounted for 48.28% of 2025 revenue, primarily driven by stat and high-complexity assays that require advanced infrastructure. Point-of-care sites, pharmacies, urgent care clinics, and employer health centers are forecasted to grow at a 7.94% CAGR, propelled by waived cartridges that deliver immediate results. Reference laboratories scale esoteric menus but endure payer pressure on routine panels. Home and over-the-counter channels remain small but exhibit steep growth as the FDA clears consumer diagnostics, such as continuous glucose monitors.
End-user fragmentation compels vendors to tailor offerings: compact analyzers for POC clinics, automation lines for hospitals, and cloud portals for at-home results. This segmentation increases touchpoints for the in vitro diagnostic market, expanding the total addressable volume but requiring versatile portfolios and adaptive go-to-market models.
Geography Analysis
North America accounted for 37.16% of the 2025 revenue, supported by early adoption of molecular diagnostics and robust reimbursement. CMS value-based-care models now tie laboratory utilization to bundled payments, pressuring providers to limit low-value testing. FDA cybersecurity mandates increase compliance costs but improve data integrity. Canada and Mexico consolidate testing into regional hubs to capture scale economies.
The Asia-Pacific region is forecast to post a 7.19% CAGR from 2026 to 2031, the fastest regional pace. China’s volume-based procurement slashed reagent prices by up to 60%, yet soaring volumes protect vendor revenue. India’s National Health Mission funded 5,000 district labs in 2024-25, increasing per-capita test penetration from 0.08 to 0.15 tests per capita annually. Aging Japan and South Korea are automating aggressively to offset labor shortages, resulting in increased capital expenditure on total laboratory automation.
Europe enforces the IVD Regulation, extending approval timelines and favoring multinationals with seasoned regulatory teams. GCC states channel oil revenue into laboratory infrastructure under Vision 2030. Sub-Saharan Africa remains under-penetrated but benefits from donor-funded HIV, tuberculosis, and malaria programs. South American laboratories struggle with currency fluctuations and import tariffs, sourcing reagents locally whenever possible to manage costs.
Get Analysis on Important Geographic Markets
Download PDF
Competitive Landscape
The top five suppliers, Roche, Abbott, Siemens Healthineers, Danaher, and Thermo Fisher, indicate moderate consolidation. Each bundle of instruments, reagents, and AI middleware is locked into multi-year contracts that tie hospitals to exclusive reagent streams. Regional challengers in Asia and Latin America undercut pricing by up to 40% while meeting ISO 13485 standards, forcing incumbents to emphasize service, connectivity, and cybersecurity.
Technology innovation remains the battlefield. Roche’s cobas pro cuts turnaround time by 22%, justifying premium reagent pricing. Danaher’s Beckman Coulter filed 14 microfluidic-cartridge patents in 2024, while Siemens Healthineers secured nine predictive-maintenance AI patents. Consumer electronics giants are exploring non-invasive biosensors that could bypass venipuncture diagnostics, posing a long-term disruptive threat.
Regulatory and cybersecurity hurdles intensify competitive pressure. FDA’s 2024 guidance now requires encryption and patch management for connected devices, a standard that strains smaller firms. As decentralized testing gains ground, incumbents acquire niche innovators, such as Bio-Rad’s Stilla dPCR and bioMérieux’s SpinChip, to secure beachheads in faster-growing segments, thereby preserving relevance across diversified test settings.
In Vitro Diagnostic Industry Leaders
F. Hoffmann-La Roche Ltd
Thermo Fischer Scientific Inc
Siemens Healthineers AG
Abbott Laboratories
bioMerieux SA
- *Disclaimer: Major Players sorted in no particular order
Need More Details on Market Players and Competitors?
Download PDF
Recent Industry Developments
- March 2025: Labcorp agreed to acquire oncology and clinical-testing assets from BioReference Health, bolstering specialized cancer diagnostics.
- February 2025: Bio-Rad Laboratories accepted a binding offer to acquire Stilla Technologies, adding next-generation digital PCR platforms.
- January 2025: bioMérieux completed the acquisition of SpinChip Diagnostics, gaining a 10-minute whole-blood immunoassay system for acute-care cardiology.
- December 2024: Ortho Clinical Diagnostics received CE marking for its Ortho Vision Analyzer, a compact immunoassay system for mid-sized European labs.
Research Methodology Framework and Report Scope
Market Definitions and Key Coverage
Mordor Intelligence defines the in-vitro diagnostics (IVD) market as the aggregate revenue generated by instruments, reagents, kits, software, and services that analyze human blood, urine, tissue, and other specimens outside the body for screening, diagnosis, monitoring, or therapy guidance.
Scope exclusion: investigational-use-only or research-use-only assays are excluded.
Segmentation Overview
- By Product Type
- Instruments
- Reagents & Kits
- Software & Services
- By Technology
- Immunoassay
- Clinical Chemistry
- Molecular Diagnostics
- Hematology
- Microbiology
- Coagulation
- Urinalysis
- Others
- By Application
- Infectious Diseases
- Oncology
- Diabetes
- Cardiology
- Autoimmune Diseases
- Nephrology
- Others
- By End User
- Hospitals & Academic Labs
- Reference Laboratories
- Point-of-Care Testing Sites
- Homecare/OTC Settings
- By Geography
- North America
- United States
- Canada
- Mexico
- Europe
- Germany
- United Kingdom
- France
- Italy
- Spain
- Rest of Europe
- Asia-Pacific
- China
- Japan
- India
- Australia
- South Korea
- Rest of Asia-Pacific
- Middle East & Africa
- GCC
- South Africa
- Rest of Middle East & Africa
- South America
- Brazil
- Argentina
- Rest of South America
- North America
Detailed Research Methodology and Data Validation
Primary Research
We validate secondary findings through structured calls with laboratory directors, reagent distributors, hospital procurement leads, and regional regulators across North America, Europe, Asia-Pacific, Latin America, and the Middle East and Africa. Their insights refine price bands, installed-base utilization, and upcoming regulatory inflection points that are hard to capture from public documents alone.
Desk Research
Our analysts map the market landscape through publicly available, high-credibility sources such as the World Health Organization's chronic-disease registries, OECD Health Statistics, the U.S. FDA's device 510(k)/IVDR listings, Centers for Medicare and Medicaid Services payment schedules, Eurostat trade flows, and peer-reviewed journals that track test-volume trends. Company 10-Ks, investor decks, and trade-association dashboards complement the picture, while paid databases like D&B Hoovers and Dow Jones Factiva let us cross-check revenue splits. The sources named illustrate the range; many additional datasets underpin the model.
Market-Sizing and Forecasting
The baseline is produced with a top-down construct that rebuilds global test-type revenue pools from clinical procedure volumes, average reimbursement tariffs, and import-export values, which are then corroborated with selective bottom-up snapshots, supplier roll-ups, cartridge pull-through ratios, and point-of-care channel checks to adjust for gray-market leakages and kit bundling. Key variables modeled include HbA1c and CRP test counts, molecular cartridge penetration, analyzer replacement cycles, reagent-to-instrument ratios, and average selling-price migration. Forecasts to 2030 employ multivariate regression blended with scenario analysis, where growth levers such as chronic-disease incidence, healthcare spending per capita, and regulatory timetables drive the projections. Data gaps in bottom-up samples are bridged using regional proxy coefficients agreed upon during expert interviews.
Data Validation and Update Cycle
Outputs pass a multi-layer review: automated variance flags, peer analyst audits, and a senior analyst sign-off. Reports are refreshed annually; interim updates trigger when policy shifts, major M&A, or pandemic-scale events materially alter assumptions. A final validation pass occurs before client delivery.
Why Mordor's In Vitro Diagnostic Baseline Commands Confidence
Published estimates often diverge because firms pick differing product mixes, price assumptions, and refresh rhythms.
Key gap drivers include: some publishers fold research-only consumables into market value, others apply uniform global price points ignoring regional reimbursement cuts, and a few project forward using linear COVID-era test demand. Mordor's disciplined scope alignment, variable-level calibration, and annual refresh provide a balanced midpoint.
Benchmark comparison
| Market Size | Anonymized source | Primary gap driver |
|---|---|---|
| USD 100.08 B | Mordor Intelligence | - |
| USD 109.07 B | Global Consultancy A | Includes RUO assays and uniform ASP escalation |
| USD 114.25 B | Data Publisher B | Uses supplier revenue without adjusting for double counting across channels |
| USD 77.73 B | Industry Forecasting C | Excludes point-of-care kits and home-use tests |
Taken together, the comparison shows that while other studies tilt higher or lower by expanding or narrowing scope, Mordor's carefully screened inputs, regular primary validation, and transparent math give decision-makers a dependable, traceable baseline.
Need A Different Region or Segment?
Customize Now
Key Questions Answered in the Report
How fast is the in vitro diagnostic market expected to grow through 2031?
It is projected to expand from USD 113.08 billion in 2026 to USD 152.54 billion by 2031, translating to a 6.17% CAGR.
Which technology segment shows the highest growth potential?
Molecular diagnostics are forecast to grow at an 8.21% CAGR, outpacing immunoassay and clinical chemistry.
Why are point-of-care sites gaining importance?
CLIA-waived cartridge analyzers let pharmacies and urgent-care clinics perform routine panels, driving a 7.94% CAGR among point-of-care users.
What is the key driver behind Asia-Pacific growth?
Volume-based procurement in China and public-lab expansion in India are pushing Asia-Pacific toward a 7.19% CAGR through 2031.
How are vendors responding to skilled-labor shortages?
Laboratories invest in total automation and AI middleware that reduce manual review time, while vendors offer reagent-rental and remote-service models.


