
Implantable Drug Delivery Devices Market Size and Share
Market Overview
| Study Period | 2020 - 2031 |
|---|---|
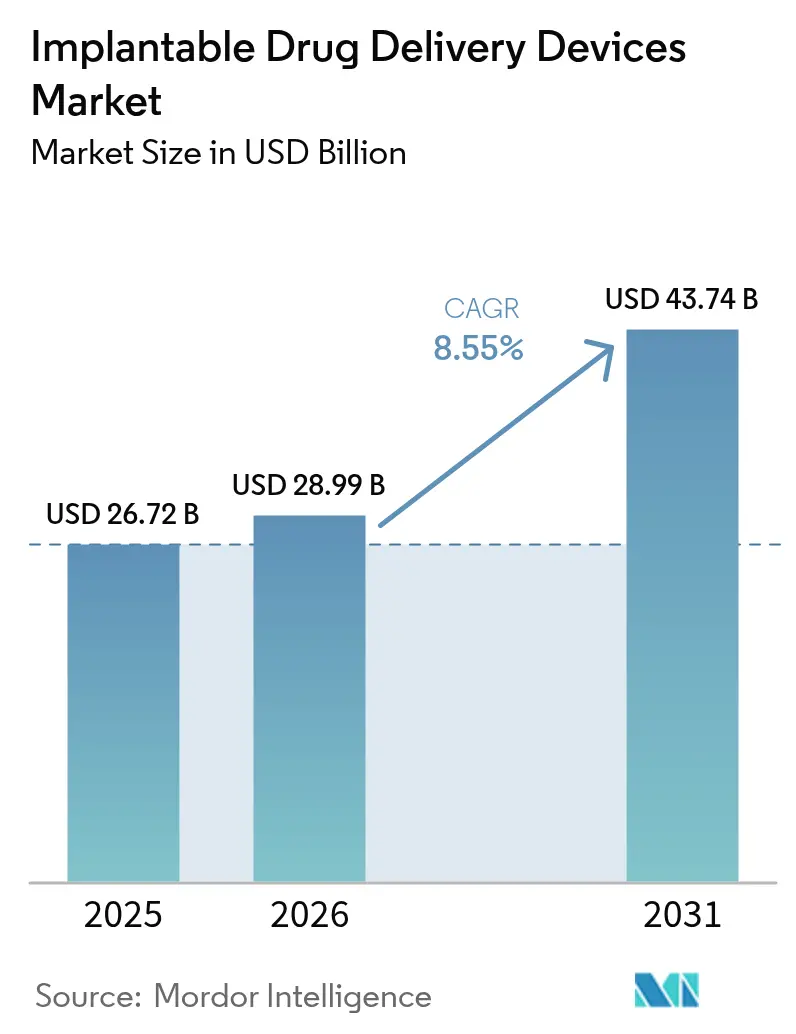
| Market Size (2026) | USD 28.99 Billion |
| Market Size (2031) | USD 43.74 Billion |
| Growth Rate (2026 - 2031) | 8.55 % |
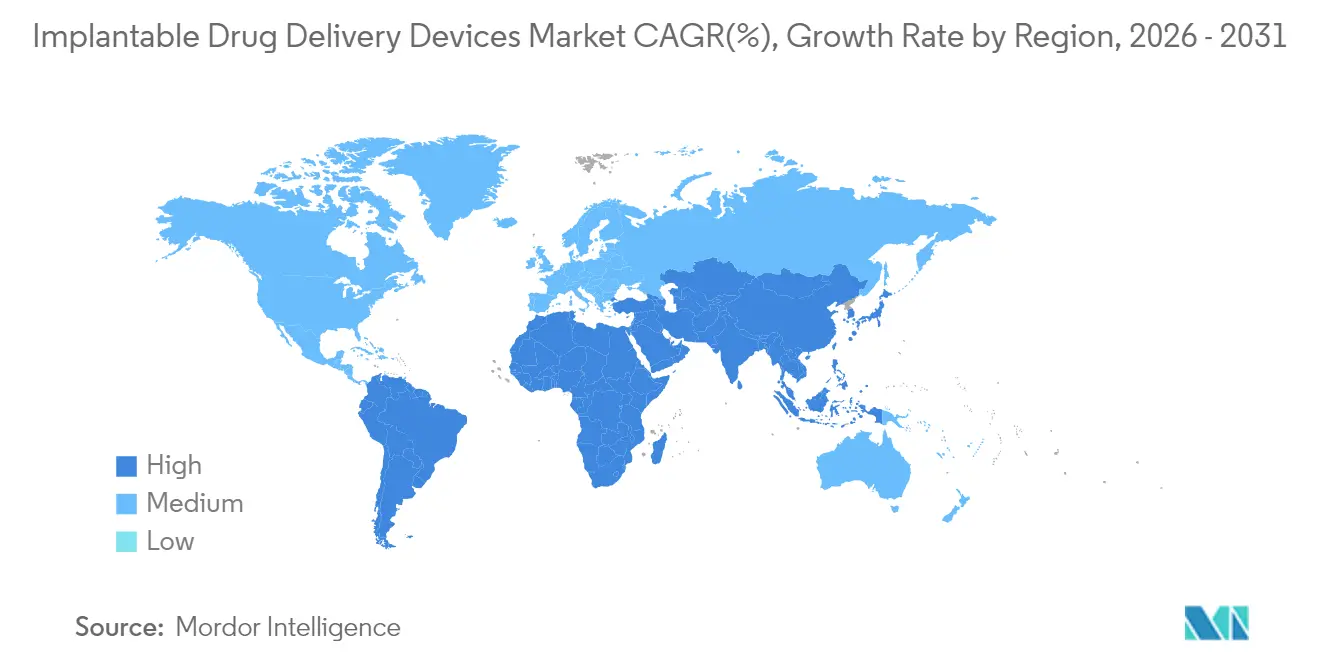
| Fastest Growing Market | Asia Pacific |
| Largest Market | North America |
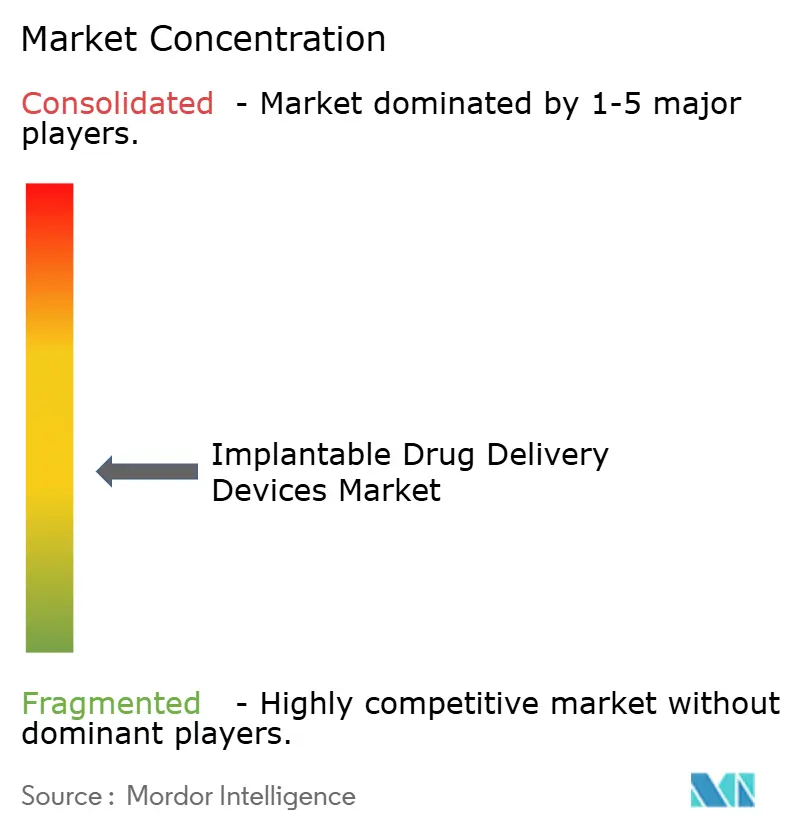
| Market Concentration | Medium |
Major Players *Disclaimer: Major Players sorted in no particular order Image © Mordor Intelligence. Reuse requires attribution under CC BY 4.0. | |
Implantable Drug Delivery Devices Market Analysis by Mordor Intelligence
Implantable drug delivery devices market size in 2026 is estimated at USD 28.99 billion, growing from 2025 value of USD 26.72 billion with 2031 projections showing USD 43.74 billion, growing at 8.55% CAGR over 2026-2031. Growth reflects the steady transition from broad therapeutic regimens toward precision medicine that minimizes systemic exposure, improves adherence, and curbs repeat procedures. Rising chronic disease prevalence, wider adoption of minimally invasive techniques, and breakthroughs in bioresorbable materials jointly widen clinical indications while lowering lifetime complication risks. Rapid innovation across oncology, ophthalmology, and metabolic care supports new revenue streams that complement the established cardiovascular base. Competition is intensifying as pharmaceutical firms and biotech start-ups introduce drug–device hybrids, compelling incumbent device manufacturers to accelerate R&D alliances and portfolio refurbishments. Regulators are responding with combination-product guidance that balances safety with expedited access, thereby sustaining investor appetite for disruptive platforms.
Key Take Aways
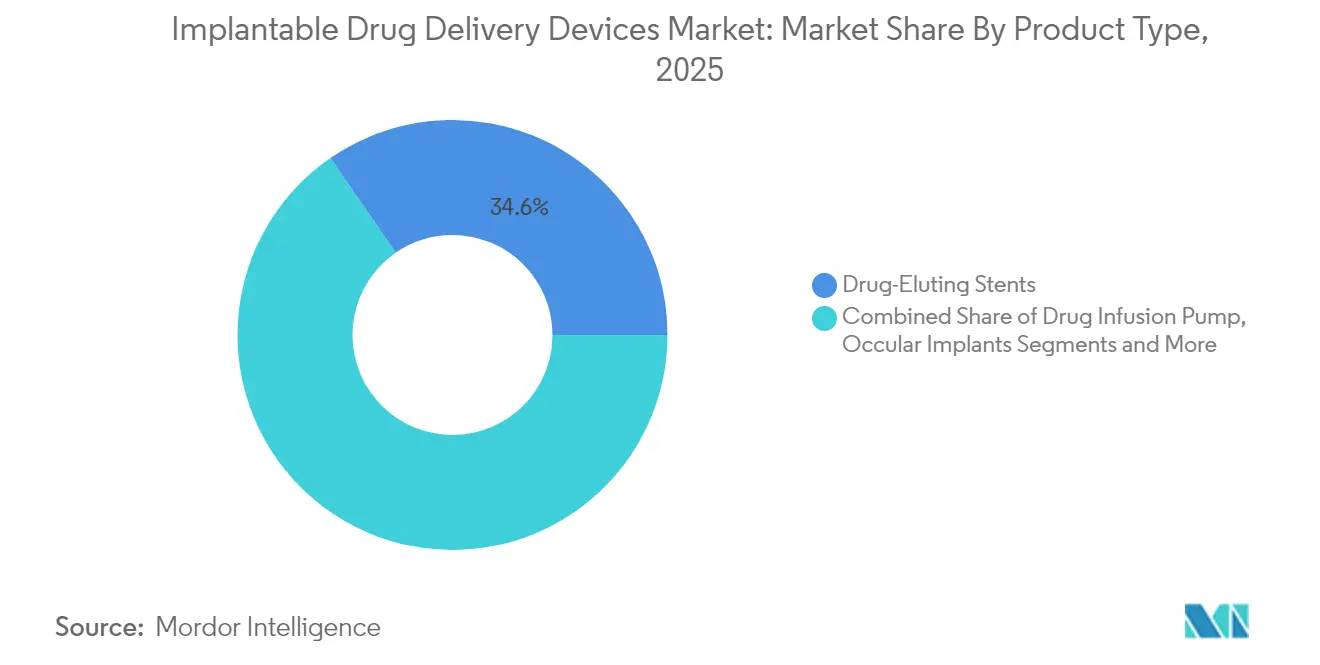
- By product type, drug-eluting stents led with 34.62% revenue share in 2025; bioresorbable stents are projected to advance at a 9.95% CAGR through 2031.
- By technology, non-bioresorbable implants held 57.41% of the implantable drug delivery devices market share in 2025, while bioresorbable formats are forecast to post a 10.23% CAGR to 2031.
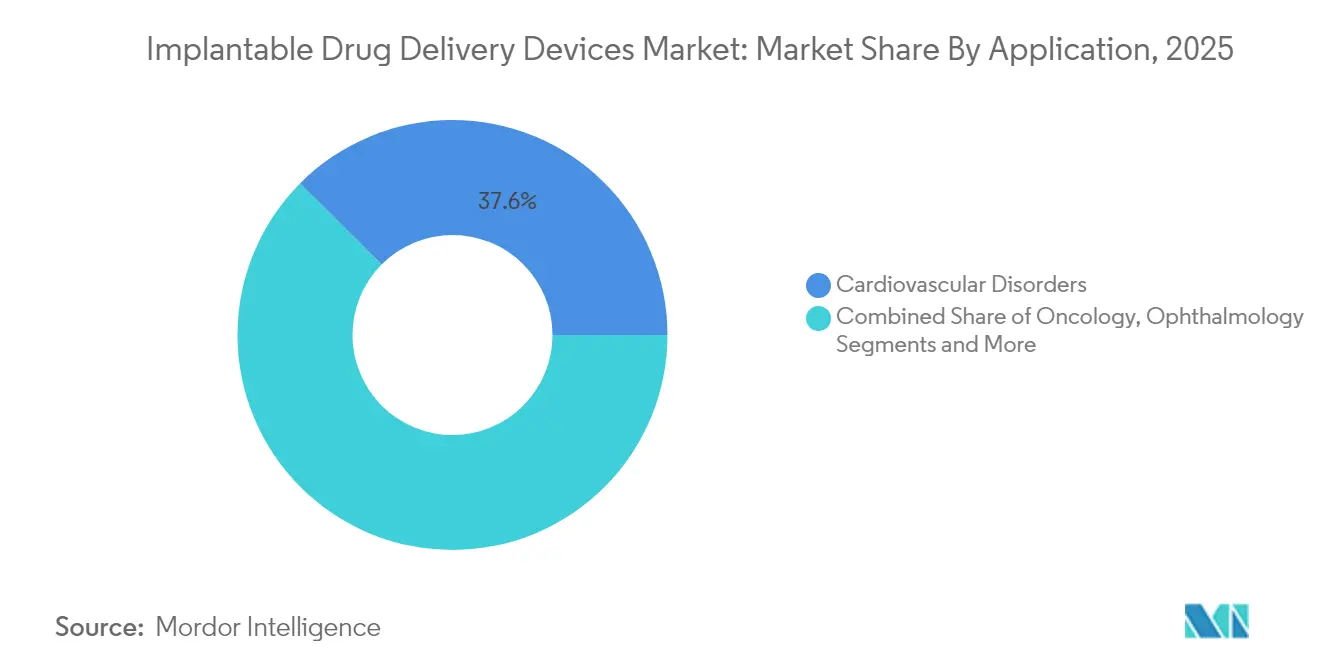
- By application, cardiovascular therapies accounted for 37.55% of the implantable drug delivery devices market size in 2025; oncology applications are expected to expand at a 9.56% CAGR between 2026-2031.
- By end-user, hospitals and surgical centers captured 48.55% share in 2025, whereas ambulatory settings are set to grow quickest at a 8.93% CAGR through 2031.
- By geography, North America maintained 40.62% share in 2025; Asia-Pacific is the fastest-growing region at 9.34% CAGR
Note: Market size and forecast figures in this report are generated using Mordor Intelligence’s proprietary estimation framework, updated with the latest available data and insights as of 2026.
Market Trends and Insights
Driver Impact Analysi of Implantable Drug Delivery Devices Market*
| Driver | (~) % Impact on CAGR Forecast | Geographic Relevance | Impact Timeline |
|---|---|---|---|
| High Burden of Chronic Diseases | 2.4% | Global, with higher impact in North America and Europe | Long term (≥ 4 years) |
| Growing Preference for Targeted and Sustained Drug Delivery | 1.8% | North America, Europe, and developed APAC (Japan, South Korea) | Medium term (2-4 years) |
| Advancements in Biocompatible Materials and Microtechnology | 1.5% | Global, led by North America and Europe | Medium term (2-4 years) |
| Increasing Demand for Minimally Invasive Procedures | 1.2% | Global, with higher adoption in developed regions | Medium term (2-4 years) |
| Benefits Associated with the Use of Implantable Drug Delivery Systems and Patient Awareness | 0.9% | North America, Europe, and urban centers in APAC | Medium term (2-4 years) |
| Integration of smart sensors and wireless telemetry enabling real-time, personalized dose modulation | 0.7% | North America, Europe, and developed APAC | Long term (≥ 4 years) |
| Source: Mordor Intelligence | |||
High Burden of Chronic Diseases
Soaring chronic disease prevalence underpins sustained demand for implantable solutions. In 2024, 60% of US adults lived with at least one chronic condition, with cardiovascular disease alone projected to affect 45.1% of the national population by 2035.[1], [2] Hospitals and payers, therefore, prioritize targeted, long-acting therapies that curb hospital readmissions and long-term pharmacotherapy costs. Drug-eluting stents and emerging bioresorbable scaffolds address restenosis while minimizing systemic drug exposure, reinforcing clinician confidence and fuelling procurement budgets. Similar patterns appear across Europe and high-income Asia, where aging demographics magnify chronic disease treatment gaps.
Growing Preference for Targeted and Sustained Drug Delivery
Healthcare providers increasingly favor controlled, site-specific delivery that reduces dosing frequency, toxicity, and adherence lapses. Implantable reservoirs release APIs over months rather than hours, improving performance in glaucoma, chronic pain, and endocrine disorders. Payers welcome the reduction in repeat pharmacy visits and emergency care, while patients gain from fewer side effects and lower lifestyle disruption. Collectively, these benefits catalyze multi-year purchasing plans across accountable-care organizations in the United States and value-based systems in Western Europe.
Advancements in Biocompatible Materials and Microtechnology
Breakthroughs in polymer chemistry and micro-machining elevate device capabilities and safety. Next-generation poly-L-lactic acid scaffolds sustain mechanical integrity and drug elution for up to 150 days while dissolving within 24 months, as documented in a 2025 Journal of Biomaterials Science study.[3] Magnesium alloys and tyrocore blends further widen the therapeutic toolkit by shortening degradation times and enhancing radiopacity. Complementary surface-modification techniques improve titanium implant hemocompatibility, trimming rejection rates. These material advances directly expand the implantable drug delivery devices market by overcoming prior durability and inflammation constraints.
Increasing Demand for Minimally Invasive Procedures
Clinicians and patients alike gravitate toward catheter-based or keyhole implantation that lowers infection risk, cuts hospital stays, and facilitates same-day discharge. The SpyGlass intraocular platform, implanted during routine cataract surgery, cut intraocular pressure by 43.7% at 18 months in glaucoma subjects, eliminating topical drops for all participants. Parallel progress in cardiovascular catheter delivery has broadened eligibility for fragile seniors once excluded from open procedures, bolstering procedural volumes in ambulatory surgical centers.
Safety Concerns and Product Recalls
Regulatory vigilance remains high following high-profile recalls such as the 2024 BioZorb incident, which prompted an FDA warning letter highlighting the need for robust post-market surveillance.[4] Even isolated events can dampen surgeon confidence and delay procurement cycles, especially in reimbursement-sensitive markets such as Germany or Japan. Companies must therefore demonstrate comprehensive risk-management frameworks and transparent field-action communication to preserve clinician trust and protect growth trajectories.
Limited Drug Compatibility with Novel Biodegradable Matrices
Roughly 30% of oncology candidates tested in 2025 displayed inadequate stability or altered pharmacokinetics when loaded into biodegradable polymers. Large-molecule biologics remain particularly challenging because conformational integrity can suffer during polymer curing or degradation. Formulation innovations and novel excipients are under development but lengthen R&D timelines and elevate unit costs, temporarily restraining penetration in complex therapeutic categories.
*Our forecasts treat driver/restraint impacts as directional, not additive. The impact forecasts reflect baseline growth, mix effects, and variable interactions.
Implantable Drug Delivery Devices Market Segment Analysis
By Product Type:
Bioresorbable stents reshape competitive prioritiesThe product landscape reached an estimated implantable drug delivery devices market size of USD 26.72 billion in 2025, with drug-eluting stents capturing 34.62% share owing to proven restenosis mitigation. Bioresorbable stents, however, command the fastest 9.95% CAGR on the promise of dissolving post-healing and thus averting late-stage thrombosis. The 2024 FDA clearance for Abbott’s Esprit scaffold spurred hospital formulary updates across the United States and the United Kingdom. In ophthalmology, three-year intracameral implants such as SpyGlass' bimatoprost platform advance patient adherence and heighten specialty-clinic demand. Drug infusion pumps remain a workhorse across pain and diabetes indications, and programmable osmotic pumps are moving into neurology, offering micro-dosing that matches circadian rhythms.
Growing clinical evidence accelerates physician uptake. Randomized data show that bioresorbable scaffolds achieve comparable revascularization rates to permanent metal stents at one year, yet avoid the need for lifelong dual-antiplatelet therapy. Such benefits resonate in emerging markets where medication adherence is variable. Meanwhile, contraceptive implants preserve a stable niche, supported by recognized effectiveness and favorable reimbursement. Collectively, these developments keep the implantable drug delivery devices market on an upward trajectory as hospitals diversify inventories to align with specialty-driven care pathways.

By Technology:
Bioresorbable platforms headline the innovation waveNon-bioresorbable formats dominated 2025 revenue at 57.41%, reflecting decades of clinical familiarity. Yet the superior risk profile of degradable systems will lift bioresorbable market value at a 10.23% CAGR. Recent advances in biopolymer gels presented by the Royal Society of Chemistry enable synchronized strength retention and drug-release modulation. Diffusion-controlled implants continue to hold the largest installed base thanks to simple engineering and limited maintenance. Osmotic pressure-driven devices satisfy disease states requiring nanoliter-scale accuracy, while magnetically triggered implants—validated in 2025 Nanoscale research—offer on-demand release with centimeter-level precision.
Electronic pump miniaturization benefits from Moore’s law and wireless charging refinements, opening avenues for home-care deployment. Polymer degradation-driven matrices appeal to oncologists seeking predictable kinetics for local chemotherapy. Together, these trends diversify revenue sources and reinforce long-term confidence in the implantable drug delivery devices market.
By Application:
Oncology demonstrates the fastest clinical uptakeCardiovascular applications retained 37.55% revenue in 2025, but oncology illustrates the steepest 9.56% CAGR as localized chemotherapy and immunotherapy implants ease systemic toxicity. Biodegradable wafers delivering chemotherapeutics into resected tumor beds now extend progression-free intervals in glioblastoma and pancreatic cancer models. Ophthalmology also moves quickly: PolyActiva’s latanoprost implant maintained efficacy for six months in phase II trials, signaling broader potential for chronic ocular diseases. Chronic pain and neurology exploit electronic pumps that titrate dosing via remote algorithms, whereas metabolic disorders rely on implantable insulin pumps that mimic physiologic secretion.
Growing cancer incidence in Asia-Pacific, coupled with under-penetrated radiation capacity, positions localized drug implants as cost-effective adjuncts. In cardiovascular care, the availability of below-the-knee scaffold solutions propels peripheral arterial disease treatment volumes. These dynamics keep the implantable drug delivery devices market diversified across clinical specialties.
By End-user:
Ambulatory settings capture expansion momentumHospitals and surgical centers represented 48.55% of 2025 revenues, reflecting complexity and acute-care financing. Nevertheless, outpatient migration will lift ambulatory settings at a 8.93% CAGR as device miniaturization and catheter techniques cut procedure times. Medicare data show ASC payment rates below those of hospital outpatient departments, incentivizing payers to redirect elective interventions. Specialty ophthalmology clinics integrate drug-delivery implants into standard cataract workflows, while home-care models extend reach via remote monitoring dashboards that adjust dosing without clinic visits.
Urbanizing populations in Asia and Latin America prefer ambulatory centers for convenience and lower copayments, accelerating device procurement. Hospitals respond by launching dedicated same-day implant suites, ensuring the implantable drug delivery devices industry remains adaptable to care-delivery reforms.
Geography Analysis
North America Implantable Drug Delivery Devices Market
North America defended a 40.62% revenue slice in 2025, guided by robust reimbursement, concentrated R&D, and rapid policy adaptation. The FDA’s 2024 communications pilot heightened recall transparency while pledging priority reviews for breakthrough combination products. This environment supports continuous product cycles and early adoption of AI-enabled pumps. The United States contributes roughly 85% of regional sales as ambulatory centers add device procedures to offset elective surgery backlog.
Europe Implantable Drug Delivery Devices Market
Europe ranks second; Germany and the United Kingdom anchor demand through cardiology and oncology investment. Implementation of the Medical Device Regulation entails additional EMA consultation for drug-device combinations, prolonging dossier compilation yet reinforcing clinical credibility. Notwithstanding these hurdles, local innovators benefit from public grants targeting biodegradable scaffold research, bolstering long-term competitiveness.
APAC Implantable Drug Delivery Devices Market
Asia-Pacific delivers the swiftest 9.34% CAGR, propelled by chronic-disease epidemiology, insurance expansion, and domestic manufacturing. China’s medical device segment grew above 15% annually, with implantables spotlighted as strategic during the 14th Five-Year Plan. Japan’s super-aging demographics translate into outsized ophthalmology and cardiovascular case volumes, while India leverages public-private hospital partnerships to upgrade catheter-lab capacity. Collaborative trials with Western partners shorten learning curves, injecting credibility into local implants and magnifying export prospects.
LATAM and MEA Implantable Drug Delivery Devices Market
Latin America and the Middle East/Africa advance more gradually, constrained by import tariffs and specialist shortages. Still, GCC nations widen adoption through government-funded mega hospitals, whereas Brazil’s private insurers support bioresorbable stent rollouts in tier-one urban centers. Cross-border tele-mentoring mitigates training deficits and opens incremental unit sales.
Regulatory Landscape
Implantable drug delivery devices are regulated largely as combination products, requiring coordinated oversight of the drug and device constituents across design controls, clinical evidence, and post-market surveillance. In the United States, 21 CFR Part 4 establishes CGMP requirements for combination products, linking compliance to both drug CGMP (21 CFR parts 210/211) and device quality system requirements. This affects manufacturers that integrate drug fill-finish with implant assembly.
A recent quality compliance change for device constituents is the FDA Quality Management System Regulation (QMSR), effective February 2, 2026, which aligns device quality requirements more closely with ISO 13485:2016 and supports global harmonization for companies running multi-region quality systems. On June 26, 2025, FDA issued draft guidance on Unique Device Identifier (UDI) requirements for combination products, reinforcing labeling and traceability expectations for device constituent parts. In Europe, combination products sit at the interface of MDR 2017/745 and medicinal-product rules, with EMA support through its combination-products operational coordination; EMA also revised its Q&A in February 2025 by introducing a Marketing Authorisation Holder (MAH) General Safety and Performance Requirements (GSPR) compliance statement concept for certain Class I devices used in integral combinations, adding documentation and notified-body interaction considerations.
Value Chain Analysis
The value chain covers advanced materials and API sourcing, component and subassembly manufacturing (catheters, reservoirs, pumps, microfluidic elements), drug-device integration (including sterile fill-finish where applicable), sterilization, final packaging and labeling, and distribution through hospital and specialty-clinic channels. Upstream inputs typically include biocompatible and bioresorbable polymers and implant-grade metals, as well as precision components that must meet long-term implantation requirements, including USP Class VI-type biocompatibility expectations and validated performance over extended residence times.
For implantable combination products, manufacturing execution concentrates on a smaller set of capabilities: precision machining or microfabrication, aseptic processing, validated sterilization, and integrated quality systems that can meet both pharmaceutical and device expectations. CDMOs and specialized suppliers are increasingly positioned as end-to-end partners, combining device build with drug-product handling to reduce transfer risk and documentation gaps. Key bottlenecks include long lead times for custom tooling, limited supplier capacity to qualify implantable-grade materials at scale, and the burden of biocompatibility validation and change control, which can slow second-sourcing and make supply continuity a differentiator for established players.
Competitive Landscape
The implantable drug delivery devices market features moderate fragmentation characterized by overlapping portfolios across medical-device majors, pharmaceutical companies, and agile start-ups. Medtronic, Boston Scientific, and Abbott hold notable shares in cardiovascular stents, benefiting from entrenched surgeon trust and scale-driven procurement discounts. Yet innovation leadership increasingly emerges from ophthalmology and oncology specialists such as SpyGlass Pharma and PolyActiva, whose focused R&D cycles outpace conglomerate processes.
Strategic alliances bridge material science, drug formulation, and sensor analytics. In 2025, Abbott disclosed an AI-enhanced pump prototype that adjusts real-time dosing via physiological feedback, signaling convergence between digital health and implantable therapeutics. Boston Scientific broadened pipeline scope through minority stakes in magnetically triggered implant start-ups, hedging against diffusion-only obsolescence. Simultaneously, pharmaceutical firms leverage drug portfolios to launch combination implants that extend IP protection beyond molecule expiration.
Regulatory sophistication acts as both moat and catalyst. Companies mastering combination-product submissions secure multi-year lead times. Conversely, missteps—as evidenced by BioZorb’s recall—expose reputational risk and invite challenger share gains. Across regions, distributor consolidation yields pricing leverage, motivating manufacturers to adopt direct sales channels or co-marketing with hospital networks. Overall, the sector rewards differentiated technology, robust evidence packages, and agile market-access strategies
Implantable Drug Delivery Devices Industry Leaders
-
Medtronic PLC
-
Boston Scientific Corporation
-
Abbott Laboratories
-
Bayer AG
-
Bausch + Lomb Inc.
- *Disclaimer: Major Players sorted in no particular order
Implantable Drug Delivery Devices Market Companies Covered in this Report
- Medtronic
- Boston Scientific
- Abbott Laboratories
- Allergan PLC (AbbVie)
- Bayer
- Roche
- Bausch + Lomb Inc.
- Terumo
- Teleflex
- Elixir Medical
- Delpor
- Solventum
- BIOTRONIK
- Flowonix Medical Inc.
- Ocular Therapeutix Inc.
- Santen Pharmaceutical Co. Ltd.
- Johnson & Johnson (Ethicon / Vision)
- Merck
- Intarcia Therapeutics
- Beckton Dickinson
- Tricumed Medizintechnik
- Cook Group
- Camurus AB
Read Analysis of Implantable Drug Delivery Devices Companies
Market Opportunities and Future Outlook
White-space is expanding around intelligent and long-duration implants that reduce treatment burden and support therapy personalization. Daré Bioscience is advancing an Intelligent Drug Delivery System (IDDS) concept designed for multi-year use with MEMS-based, on-demand dosing capability, while academic work reported in March 2026 described remotely controlled electrochemical pump designs and biohybrid implants that combine engineered therapeutic cells with wireless bioelectronics for multi-drug production. These efforts shift competition from passive diffusion platforms toward electronically actuated and bioelectronic systems, creating scope for differentiated offerings in oncology, metabolic disorders, and neurology where dosing precision and adherence remain persistent constraints.
Regulatory and manufacturing alignment also opens room for global suppliers and CDMOs to package drug-device integration within compliant quality systems. The FDA QMSR effective February 2, 2026 incorporates ISO 13485:2016 by reference, supporting harmonized quality operations for multinational programs and lowering friction for platforms targeting multiple regions. Europe continues to run integral combinations through MDR-linked requirements and medicinal-product interfaces, which increases demand for strong documentation packages (including GSPR-related evidence where applicable) and earlier notified-body engagement. On the provider side, continued migration of procedures into ambulatory settings and specialty ophthalmology centers improves the business case for minimally invasive implants paired with simplified follow-up workflows, particularly when devices incorporate monitoring or dose-adjustment features.
Recent Industry Developments in Implantable Drug Delivery Devices Market
- June 2026: Bayer completed its acquisition of Perfuse Therapeutics for an upfront payment of USD 300 million, adding rights to a sustained-release intravitreal implant program (PER-001) targeting glaucoma and diabetic retinopathy. The deal strengthens Bayer's positioning in implant-enabled ophthalmology and accelerates portfolio depth in long-acting local delivery approaches that reduce reliance on frequent clinic-administered dosing.
- December 2025: Medtronic began the U.S. commercial launch of its MiniMed 780G system with the Instinct sensor made by Abbott. The rollout advances integrated, sensor-linked insulin delivery workflows and underscores how device partnerships can compress integration timelines in metabolic care platforms that blend hardware, software, and drug delivery consumables.
- August 2024: Medtronic announced FDA approval of Simplera CGM and a global partnership with Abbott. Expanding sensor availability and interoperability supports broader closed-loop and connected delivery ecosystems, influencing procurement decisions for implant-adjacent and pump-based drug delivery solutions in diabetes pathways.
Implantable Drug Delivery Devices Market Report Scope and Research Methodology
Market Definition and Coverage
For this study, the market covers implantable devices that deliver a drug inside the body in a controlled way for at least seven days, which can be temporary or permanent and are placed through a medical procedure.
Scope exclusions: We exclude external infusion pumps and wearable delivery devices that can be removed without a minor procedure.
Segments Covered in This Report
- By Product Type
- Drug-Eluting Stents
- Bioresorbable Stents
- Drug Infusion Pumps (incl. Intrathecal)
- Intra-/Trans-Ocular Implants
- Contraceptive Implants
- Programmable Osmotic Pumps
- Other Product Types
- By Technology
- Diffusion-Controlled Implants
- Osmotic Pressure–Driven Implants
- Magnetically-Triggered Implants
- Pump-Based (Electronic / Mechanical)
- Polymer Matrix Degradation–Driven
- By Application
- Cardiovascular Disorders
- Oncology
- Autoimmune / Inflammatory Diseases
- Obstetrics and Gynecology
- Ophthalmology
- Chronic Pain and Neurology
- Metabolic Disorders (e.g., Diabetes)
- Other Applications
- By End-user
- Hospitals and Surgical Centres
- Ambulatory Care and Pain Clinics
- Specialty Ophthalmology Centres
- Home-Care Settings
- Geography
- North America
- United States
- Canada
- Mexico
- Europe
- Germany
- United Kingdom
- France
- Italy
- Spain
- Rest of Europe
- Asia-Pacific
- China
- Japan
- India
- South Korea
- Australia
- Rest of Asia-Pacific
- Middle East and Africa
- GCC
- South Africa
- Rest of Middle East and Africa
- South America
- Brazil
- Argentina
- Rest of South America
- North America
Data Sources, Market Sizing, and Validation
Desk Research
Desk research is used to set the clinical and regulatory boundaries of what qualifies as an implantable drug delivery device, and then to gather the key demand and supply signals that can be tracked year over year. We rely on public sources such as the US FDA database and guidance for combination products, the US National Library of Medicine (ClinicalTrials.gov) for active pipeline and trial activity, and the World Health Organization for disease and treatment context.
To keep the model grounded in real utilization, we also review sources such as the OECD health statistics for procedure and care setting indicators, and peer reviewed journals for evidence around implant longevity, refill cycles, and adherence impact. On top of that, we read company filings, investor decks, earnings call notes, and reputable medical device press to understand launches and discontinuations. For standardization and cross-checking, a few paid subscriptions are used for company financials and intelligence, plus patent databases and selected import-export shipment level views where it helps validate manufacturing and trade movement. These examples are not exhaustive, and many other public sources are reviewed for data collection, validation, and clarification.
Primary Interviews and Surveys
Primary work is used to test the scope and assumptions with people who see the market in day to day practice, including device manufacturers, hospital and clinic stakeholders, and specialist physicians involved in implant procedures and follow up. We also cover distributors and service partners, and then make sure the view is balanced across major geographies so adoption and pricing differences are not averaged out too early.
Distribution of primary research fieldwork respondents
| Company type | Respondent position | Region |
|---|---|---|
| Top tier: 27% | CXOs: 17% | APAC: 48% |
| Mid tier: 55% | Functional/Unit leaders: 28% | EMEA: 32% |
| Smaller Players: 18% | Managers: 55% | Americas: 20% |
Market-Sizing & Forecasting
Market sizing is built using a top-down and bottom-up approach, where procedure and treated-patient pools are first reconstructed by major therapy areas and care settings, and then translated into device demand using adoption and replacement logic. Since implants are used in controlled, clinician driven pathways, the model relies heavily on how many eligible procedures occur, how often implants are replaced or refilled, and what share of patients are actually routed to implantable delivery.
To keep the math traceable, we use a short list of practical inputs such as chronic disease prevalence by indication, relevant procedure volumes (where available), average implant duration and refill cycle assumptions, adoption shifts toward long-acting therapies, and pricing ranges by device category and region. Forecasts are run using scenario analysis, where each key variable is moved within a realistic band agreed during expert discussions, and the final trajectory is selected only after the scenario outputs fit clinical adoption patterns.
Selective bottom-up approximations are then used to corroborate the totals, such as sampled price times volume checks in priority countries and channel conversations on typical annual placements. When product level data is incomplete, gaps are handled by using proxy indicators like therapy penetration and the installed base replacement curve, and then tested again in follow up calls before locking the model.
Data Validation & Update Cycle
Validation is done through several checks so the final numbers do not depend on one source or one assumption. We compare outputs against independent signals like procedure trends, launch timing, and expected replacement dynamics, and then review variances at region and category level to spot outliers that need explanation.
If an estimate moves beyond a reasonable range, the assumptions are revisited and, when needed, experts are re-contacted to confirm what changed in practice or pricing. Before sign-off, the model goes through multi-step analyst review, with formula checks and consistency checks across years. Reports are refreshed annually, and interim updates are made when material events occur, followed by a final pre-delivery review so clients receive the latest view.
Mordor Intelligence's Implantable Drug Delivery Devices Market Estimate Compared With Other Published Estimates
It is normal to see different market sizes published for implantable drug delivery devices because each study draws the line differently on what counts as an implant, which therapy areas are emphasized, and what year is used as the anchor. Differences also come from how pricing is treated, since list prices, tender pricing, and blended realized pricing do not move in the same direction across regions.
By tracking procedure linked demand signals and refreshing conversion assumptions with expert inputs, Mordor Intelligence keeps the total tied to devices that deliver drugs inside the body for at least seven days, instead of mixing in removable external pumps or broader drug delivery hardware.
Benchmark comparison
| Source | Market Size | Gaps in Research Methodology |
|---|---|---|
| Mordor Intelligence | USD 28.99 B (2026) | |
| Global Consultancy A | USD 29.32 B (2024) | Uses a different base year and may apply a wider inclusion set for implantable technologies without an explicit duration threshold, which can shift pricing and volume assumptions across regions. |
| Industry Publisher B | USD 13.29 B (2025) | Lower total is consistent with a narrower product and application scope and a more conservative growth pathway, with longer forecast horizons that can dampen near-term adoption and ASP progression. |
The spread across published totals is mainly explained by scope boundaries, the choice of base year, and how adoption and pricing are carried forward. Our approach stays transparent by linking demand to clinical pathways and replacement cycles, and then checking the result with practical price times volume tests so the number can be reproduced and reviewed.
Key Questions Answered in the Report
How large is the implantable drug delivery devices market in 2026?
The implantable drug delivery devices market size stands at USD 28.99 billion in 2026 and is forecast to grow to USD 43.74 billion by 2031.
Which product segment holds the largest market share?
Drug-eluting stents led the market with 34.62% share in 2025, thanks to wide adoption in cardiovascular interventions.
Which is the fastest growing region in Implantable Drug Delivery Devices Market?
Asia Pacific is estimated to grow at the highest CAGR over the forecast period (2026-2031).
What is the fastest-growing regional market?
Asia-Pacific is expanding at a 9.34% CAGR through 2031, driven by rising chronic disease incidence and accelerating healthcare investment.
Which application area shows the highest growth rate?
Oncology applications are projected to advance at a 9.56% CAGR as localized implants reduce systemic chemotherapy toxicity.
How are regulatory changes affecting market growth?
New FDA combination-product guidelines and Europe’s Medical Device Regulation lengthen approval timelines but offer clearer pathways, rewarding firms that align early with enhanced evidence requirements .
What technological trend will shape future competition?
Bioresorbable materials integrating AI-enabled dosing sensors are poised to redefine therapy personalization and could unlock new indications across neurodegenerative and metabolic disorders.